

Chart Groups
Introduction
A Chart Group in Devtron is a collection of Helm charts grouped together (e.g., what a folder is to files) to help you create, manage, and deploy them easily.
When setting up a new environment or a microservice, or when your application requires multiple Helm charts, you can simply group the required charts into a chart group. You can then view, manage, and deploy related charts together in one place instead of searching and installing each one individually.
Prerequisites
Ensure the Build and Deploy (CI/CD) module is installed in your Devtron instance if you are an OSS user. Enterprise user can skip this step.
Create and Deploy a Chart Group
Who Can Perform This Action?
A user with the Create permission enabled for Chart Groups can create a chart group. However, they will not be able to deploy it.
Only a Super-Admin can create as well as deploy a chart group.
To create a chart group, follow the instructions below:
Navigate to Chart Store.
Click the Create Group button. The Create Chart Group page is displayed.
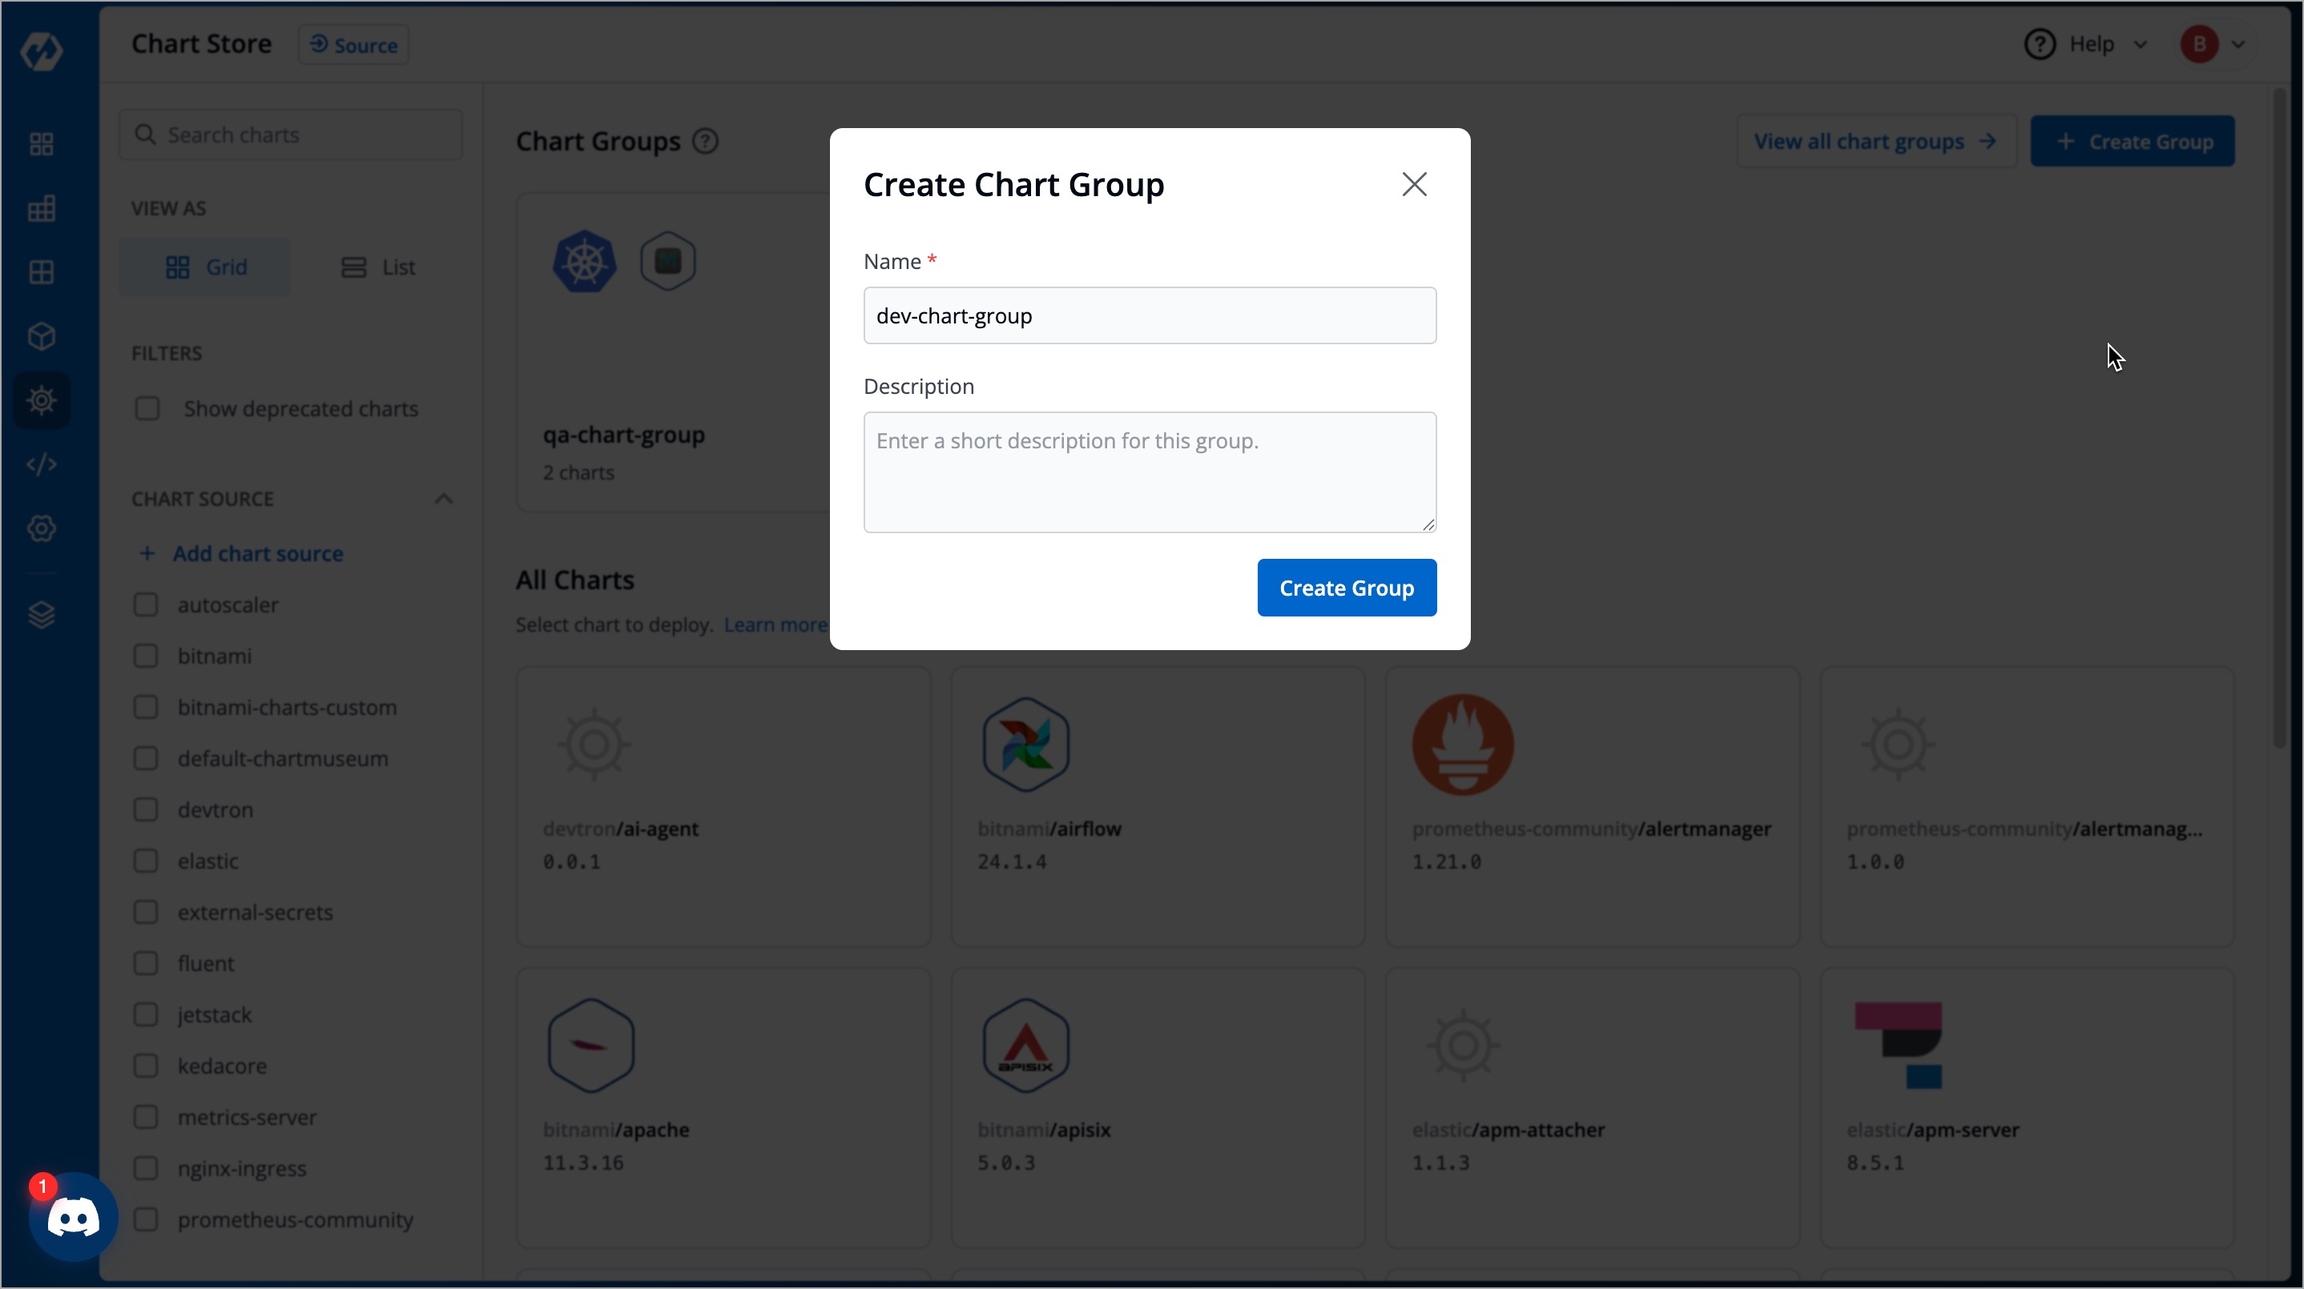
Figure 1: Create Chart Group Enter your preferred chart group name in the Name field.
(Optional) Enter the chart group description in the Description field.
Click Create Group button.
Select your preferred charts from the list of charts available in the Edit group page.
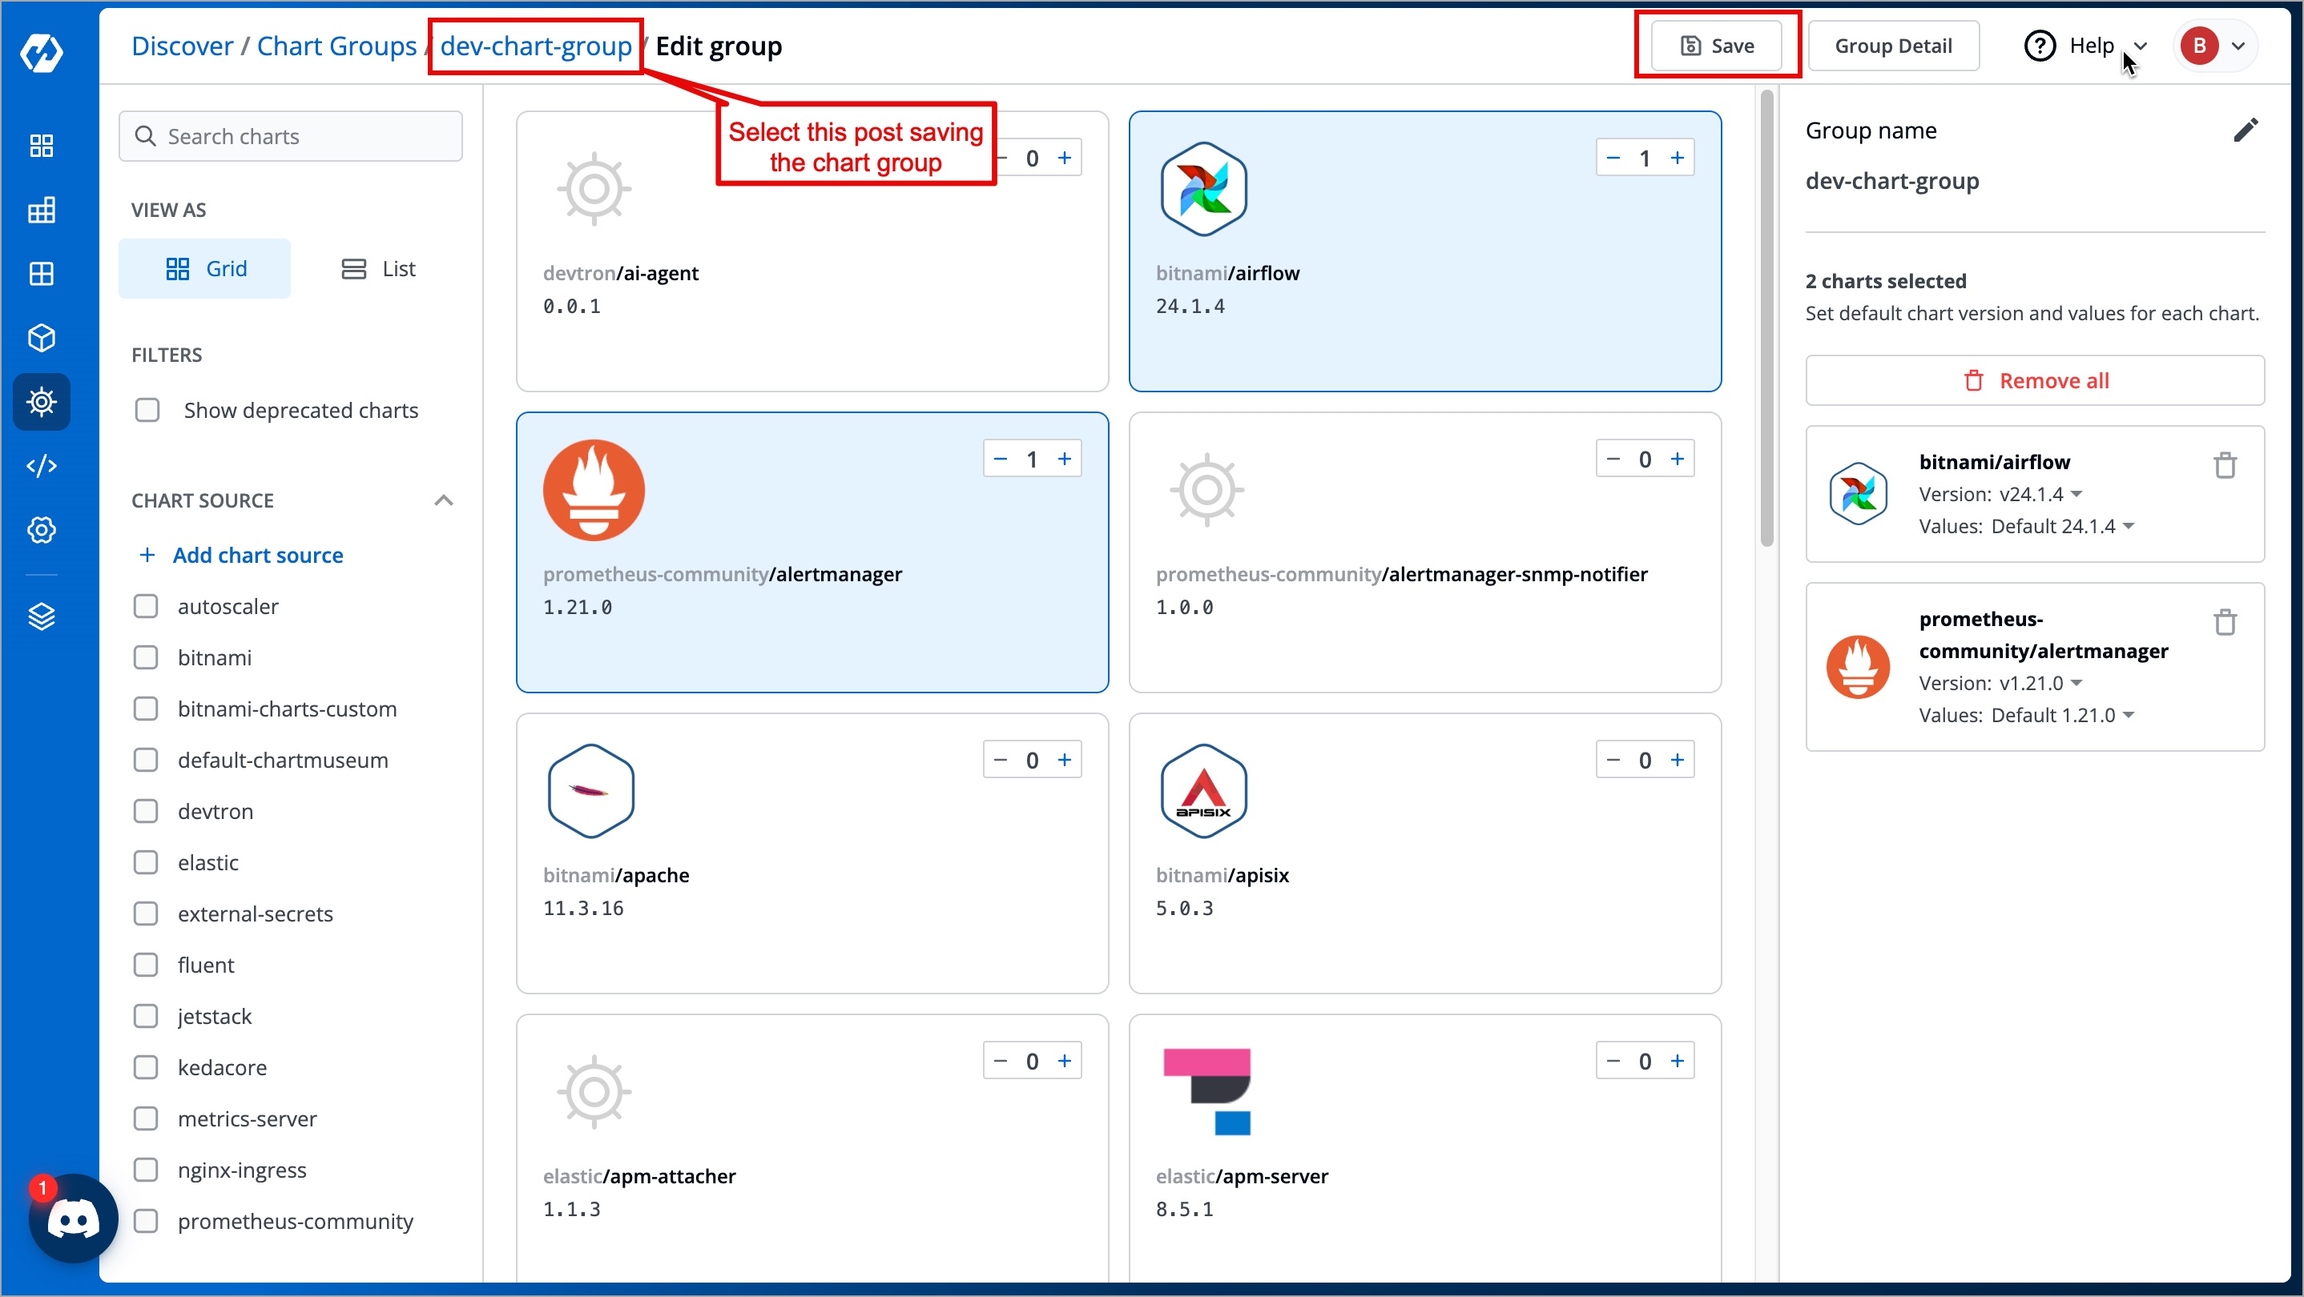
Figure 2: Edit Group Click Save. The chart group is now saved.
Navigate back to the chart group page.
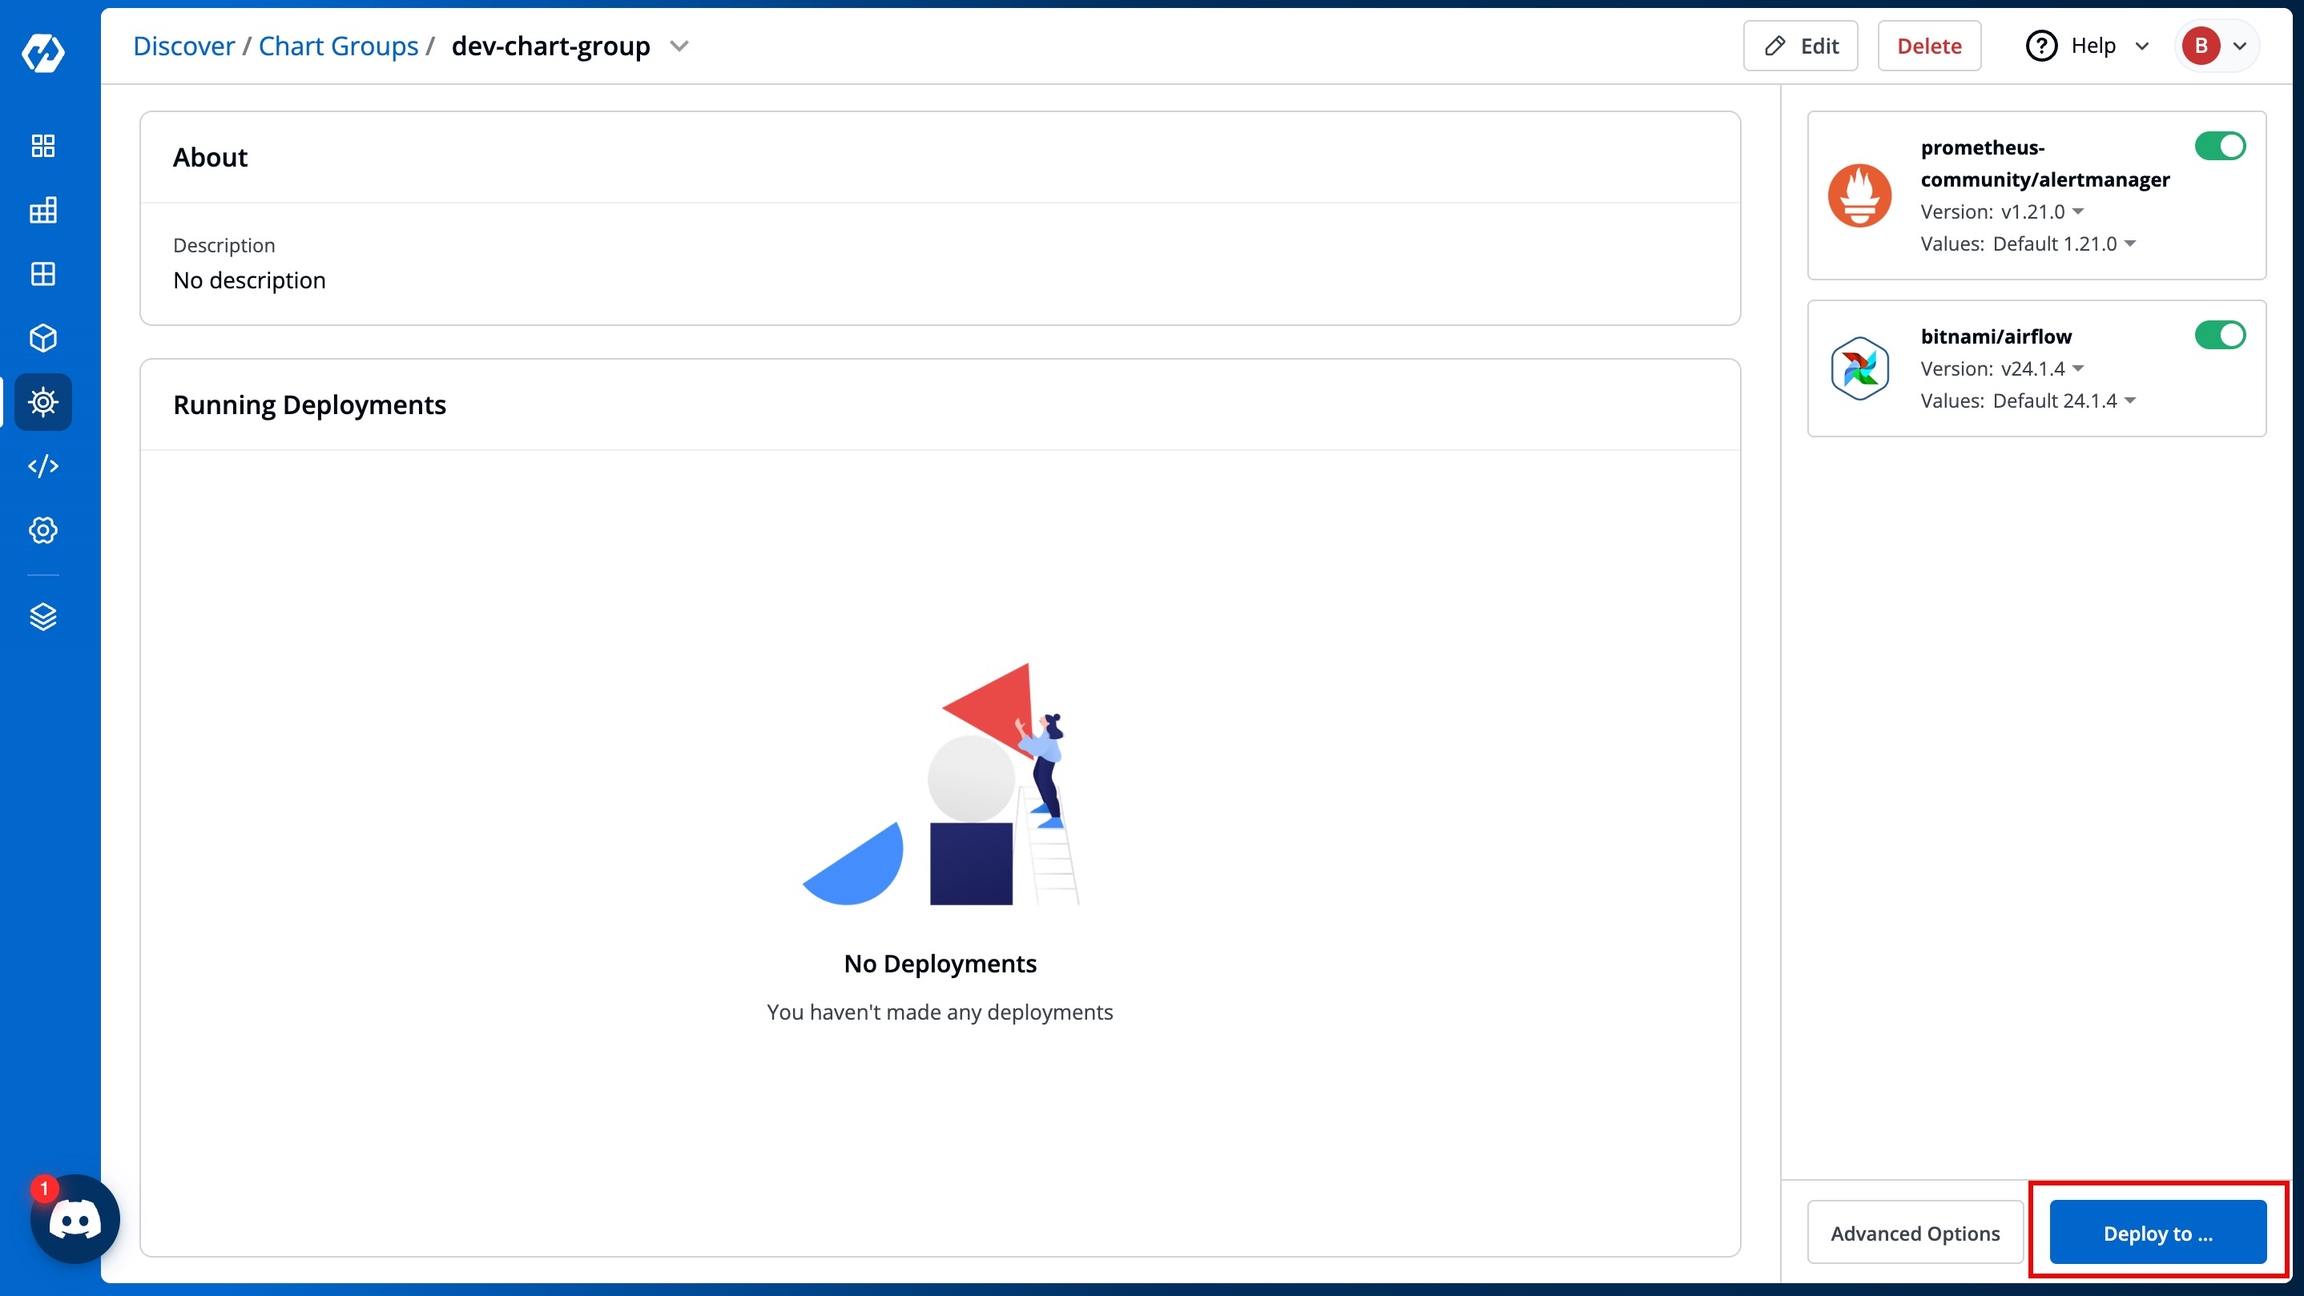
Figure 3: Chart Group Click on the Deploy to... button. The Deploy Selected Charts screen is displayed.
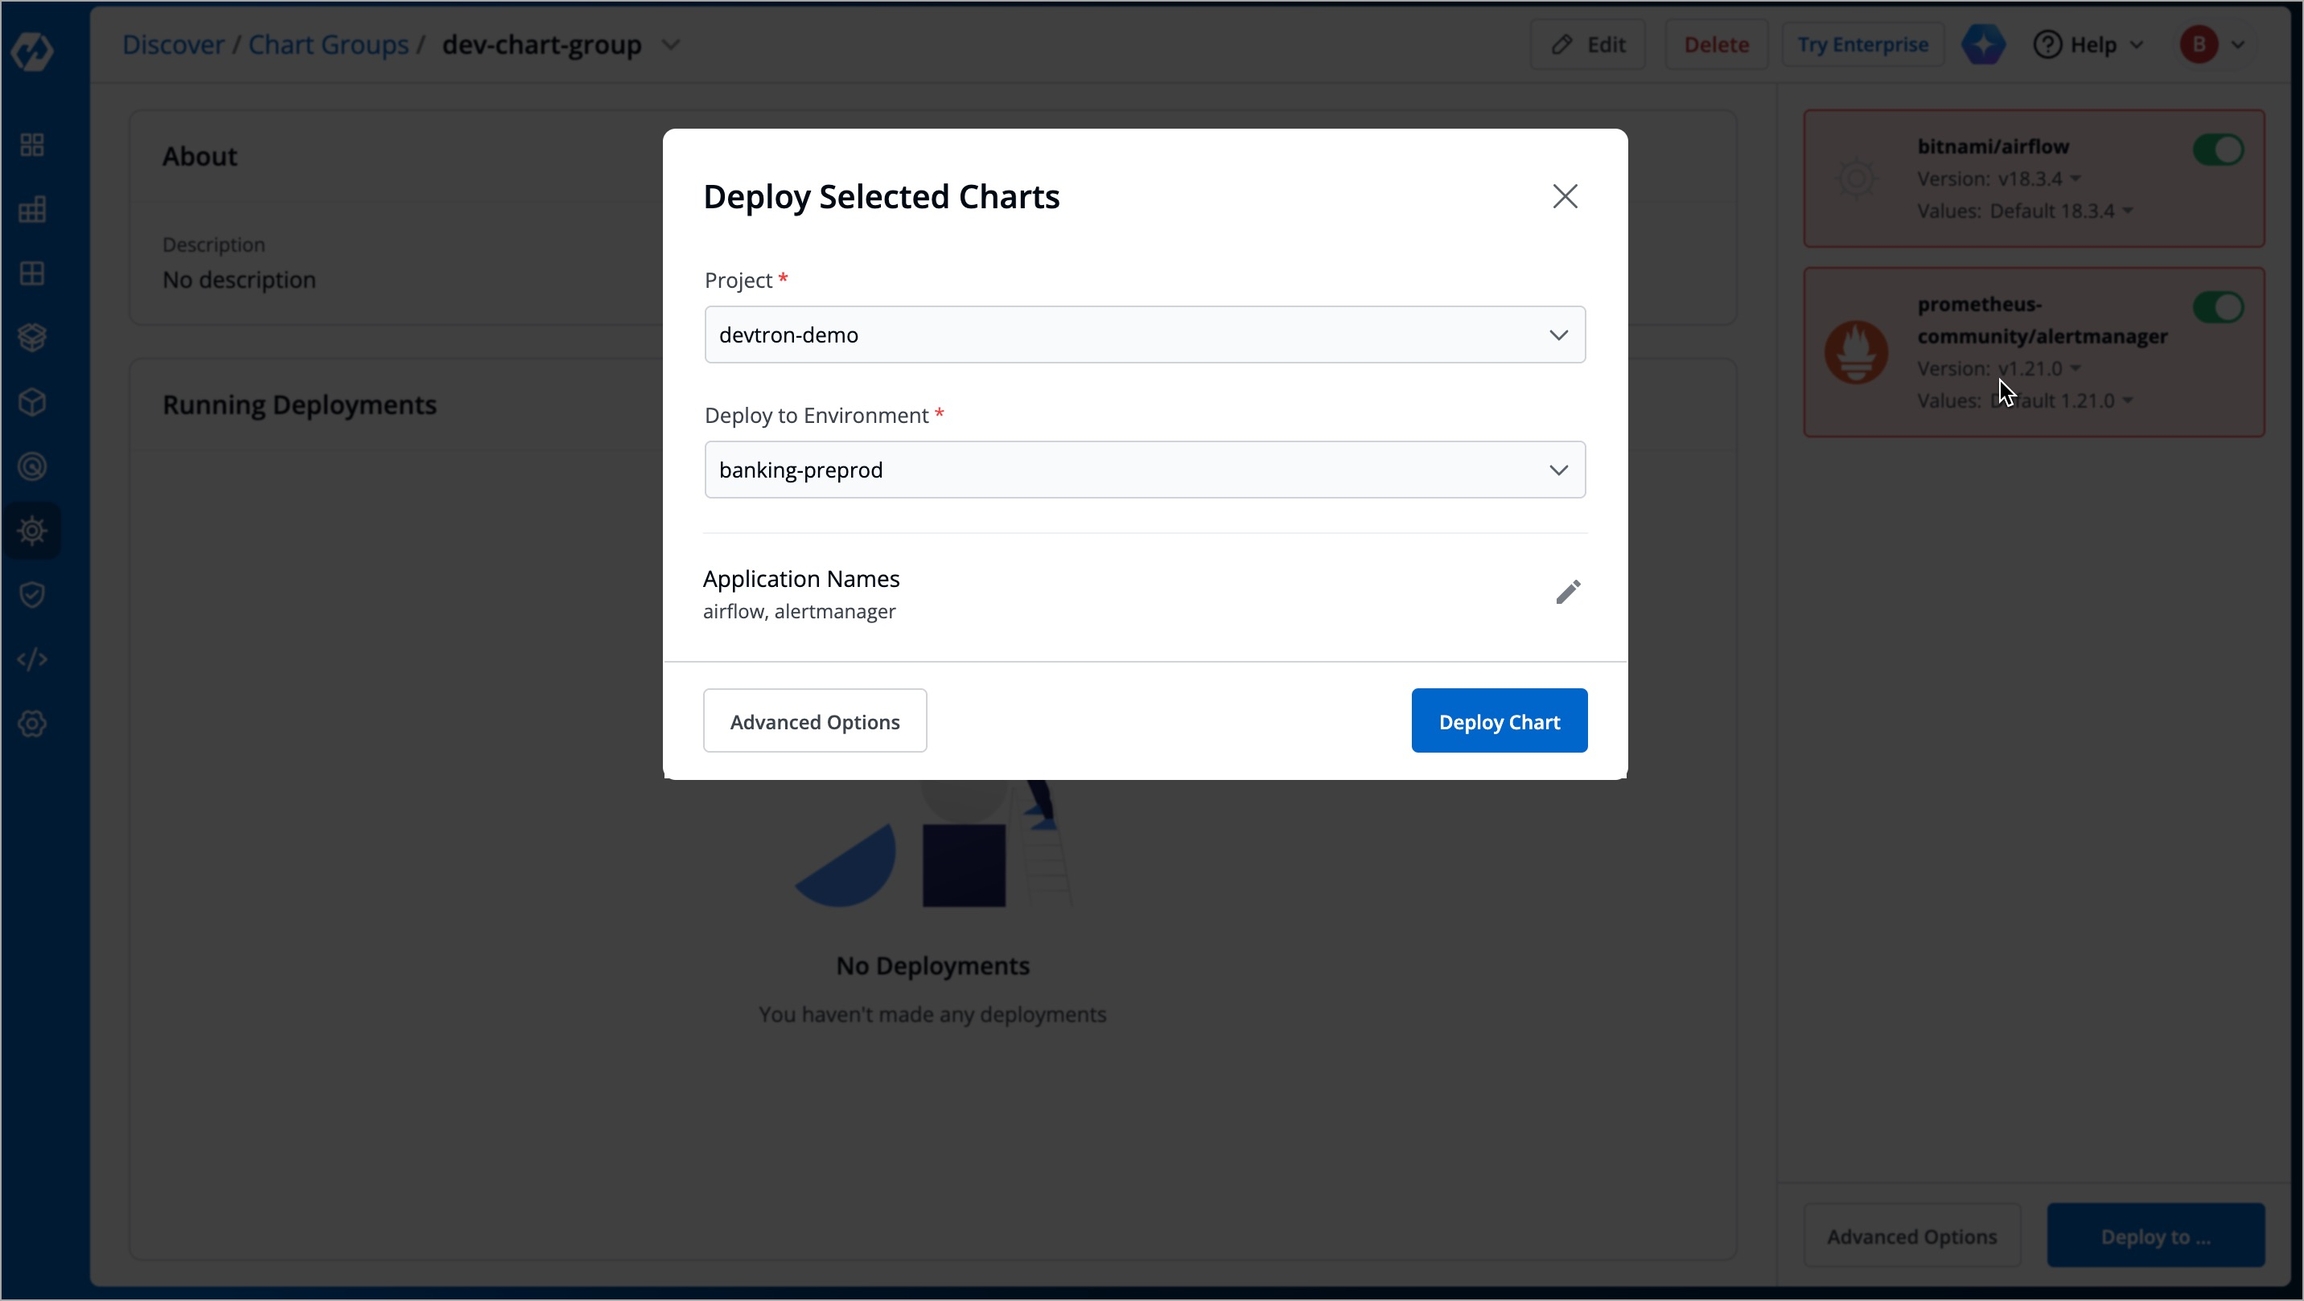
Figure 4: Deploy Selected Charts Select the project in the Project drop-down box.
Select the environment where you want to deploy the charts in the Deploy to Environment drop-down box.
Click Deploy Chart to deploy the charts. The deployment will be initiated.
If you prefer to change the chart values in the
.yamlfile or change chart configurations, click Advanced Options. Refer to Advanced Options for more information.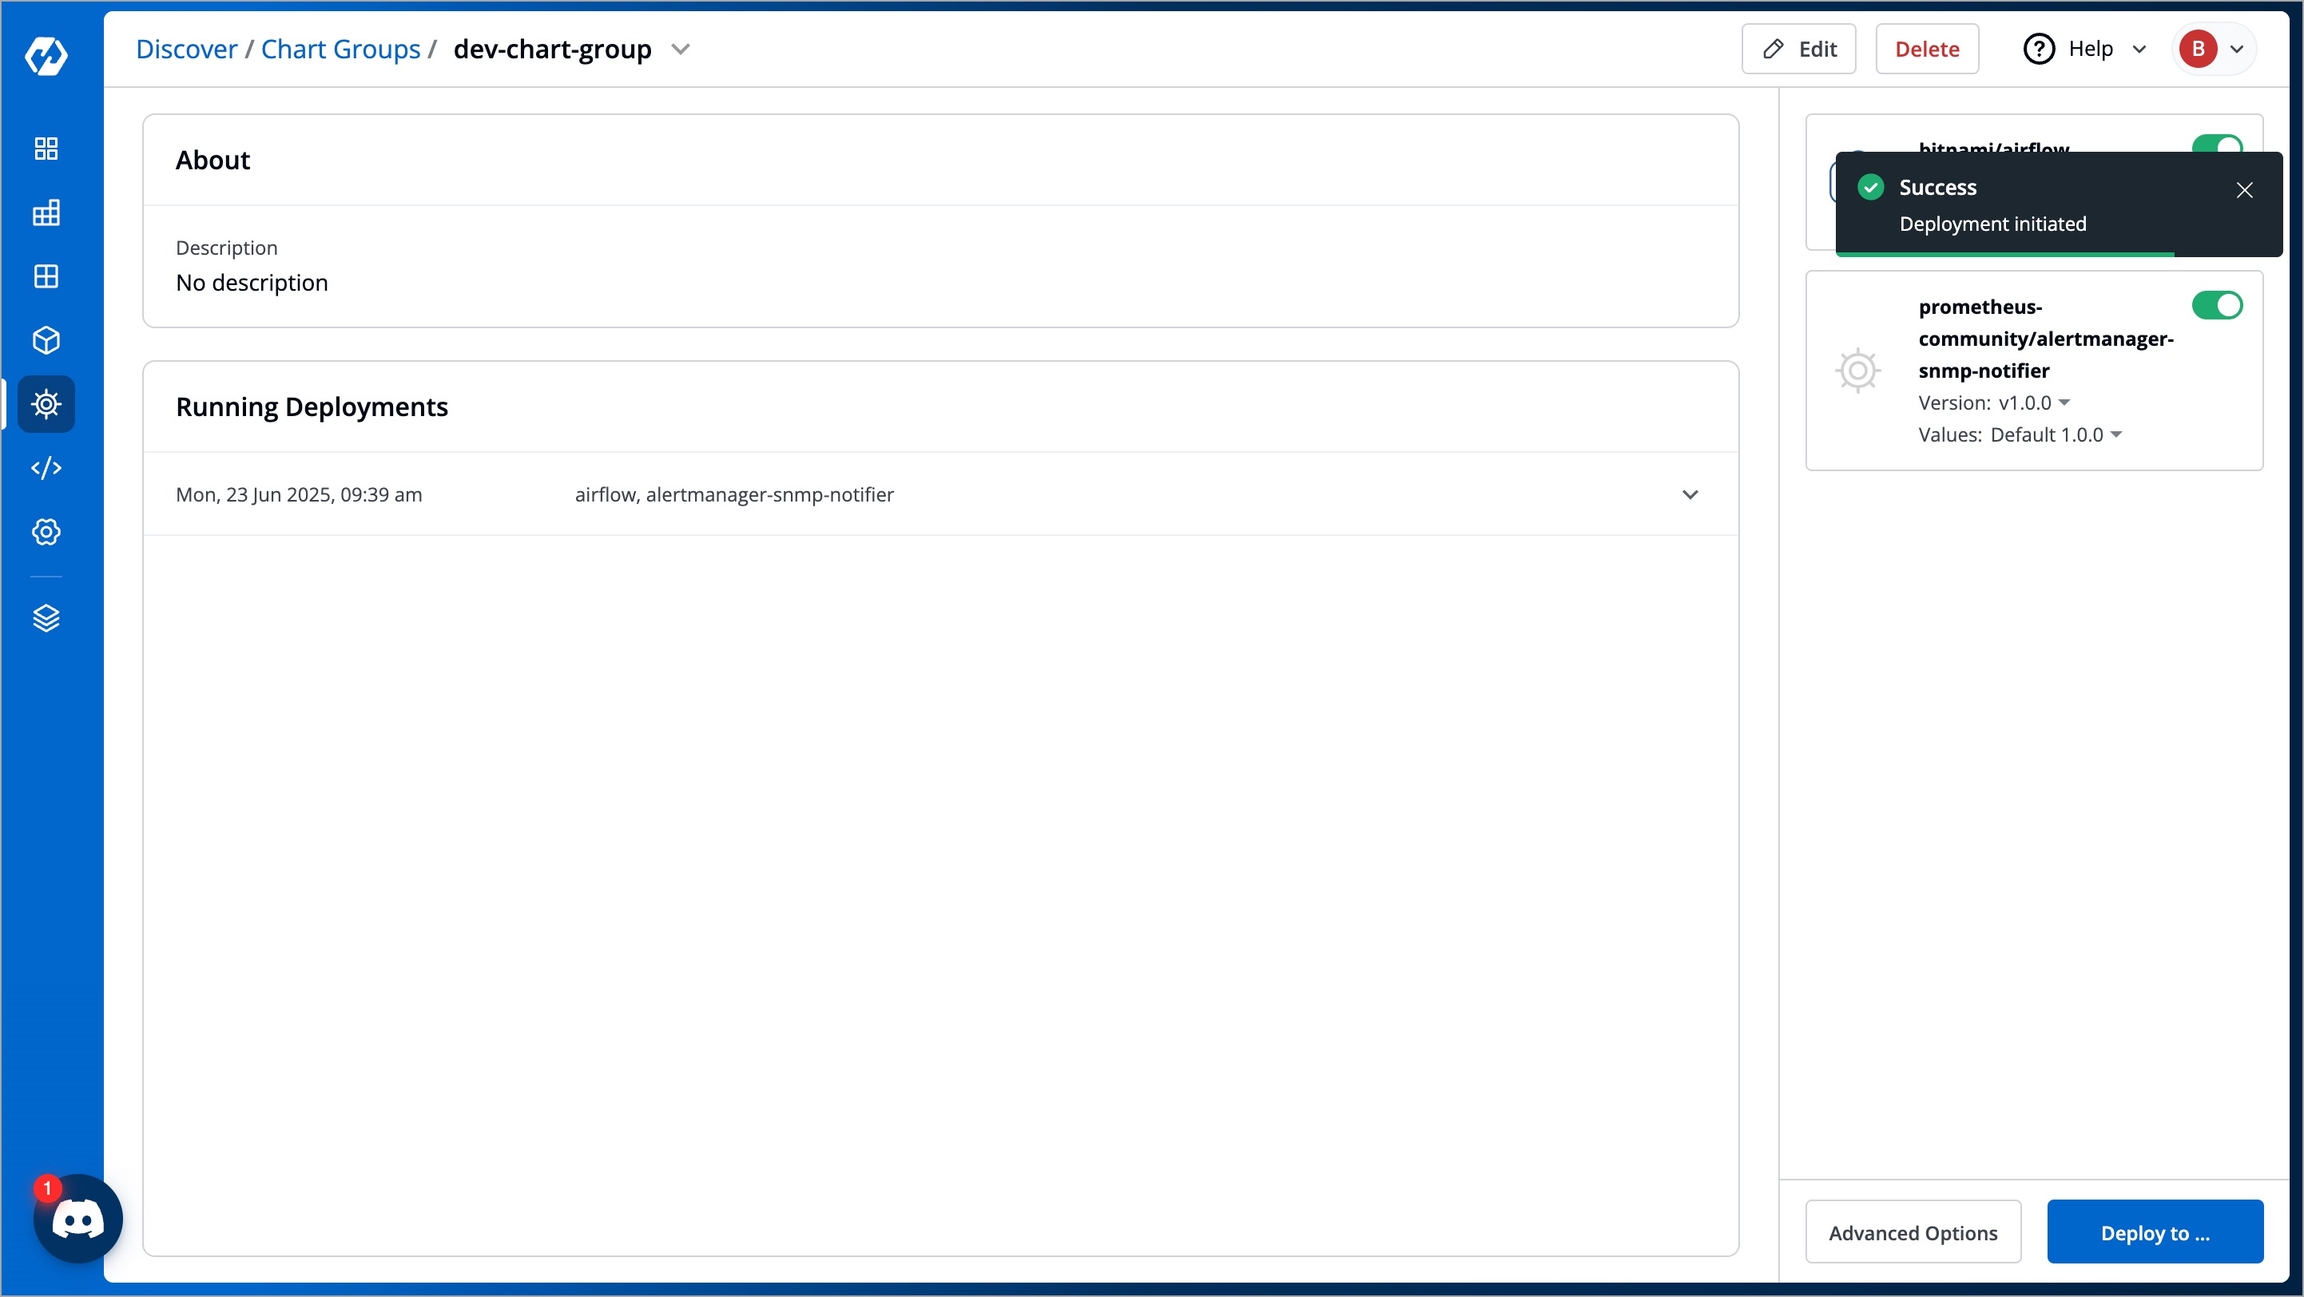
Figure 5: Deployment Initiated
Edit a Chart Group
Who Can Perform This Action?
A user with the Edit permission for the specific Chart Group can edit that chart group.
A Super-Admin can also edit a chart group.
If you want to add/remove a chart to your existing chart group, or change the chart group name, you can edit the chart group. Follow the below instructions to edit a chart group:
Select your preferred chart group in the Chart Store.
Figure 6: Edit a Chart Group Click the Edit button. The Edit group page is displayed.
Add or remove charts based on your needs from the list of charts available in the Edit group page.
Enter your new chart group name (if required) in the Group name field.
Click Save to save the changes.
Delete a Chart Group
Who Can Perform This Action?
Only a Super-Admin or a user with the Create permission can delete a chart group.
When you delete a chart group, only the chart group is deleted. Application deployed using that chart group remain unaffected. Follow the below instructions to delete a chart group.
Select your preferred chart group in the Chart Store.
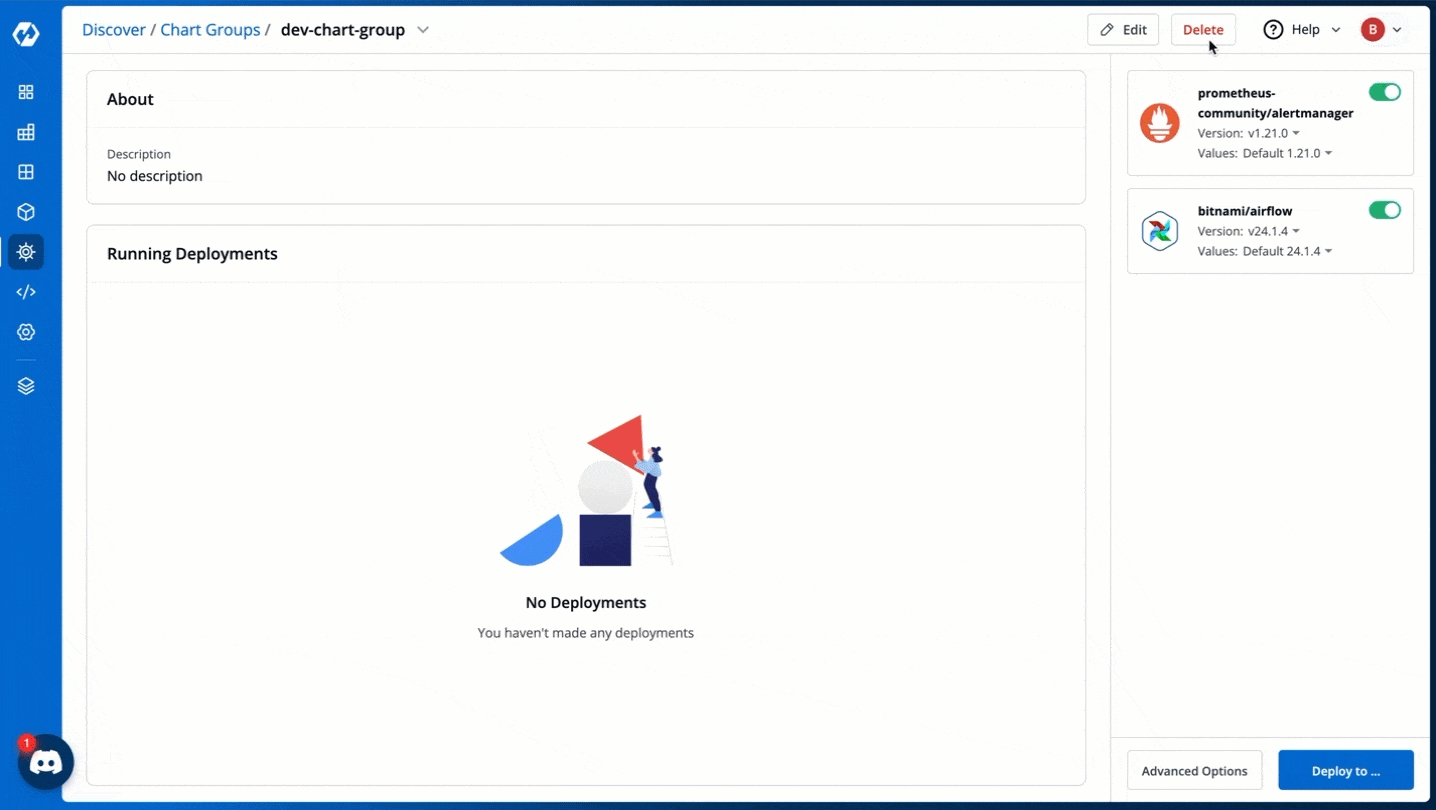
Figure 7: Delete a Chart Group Click the Delete button. A pop-up window will appear, asking for confirmation to delete the chart group.
Extras
Advanced Options
The Advanced Options page enables you to change the chart values, chart configurations, use preset values (if already configured) for your charts.
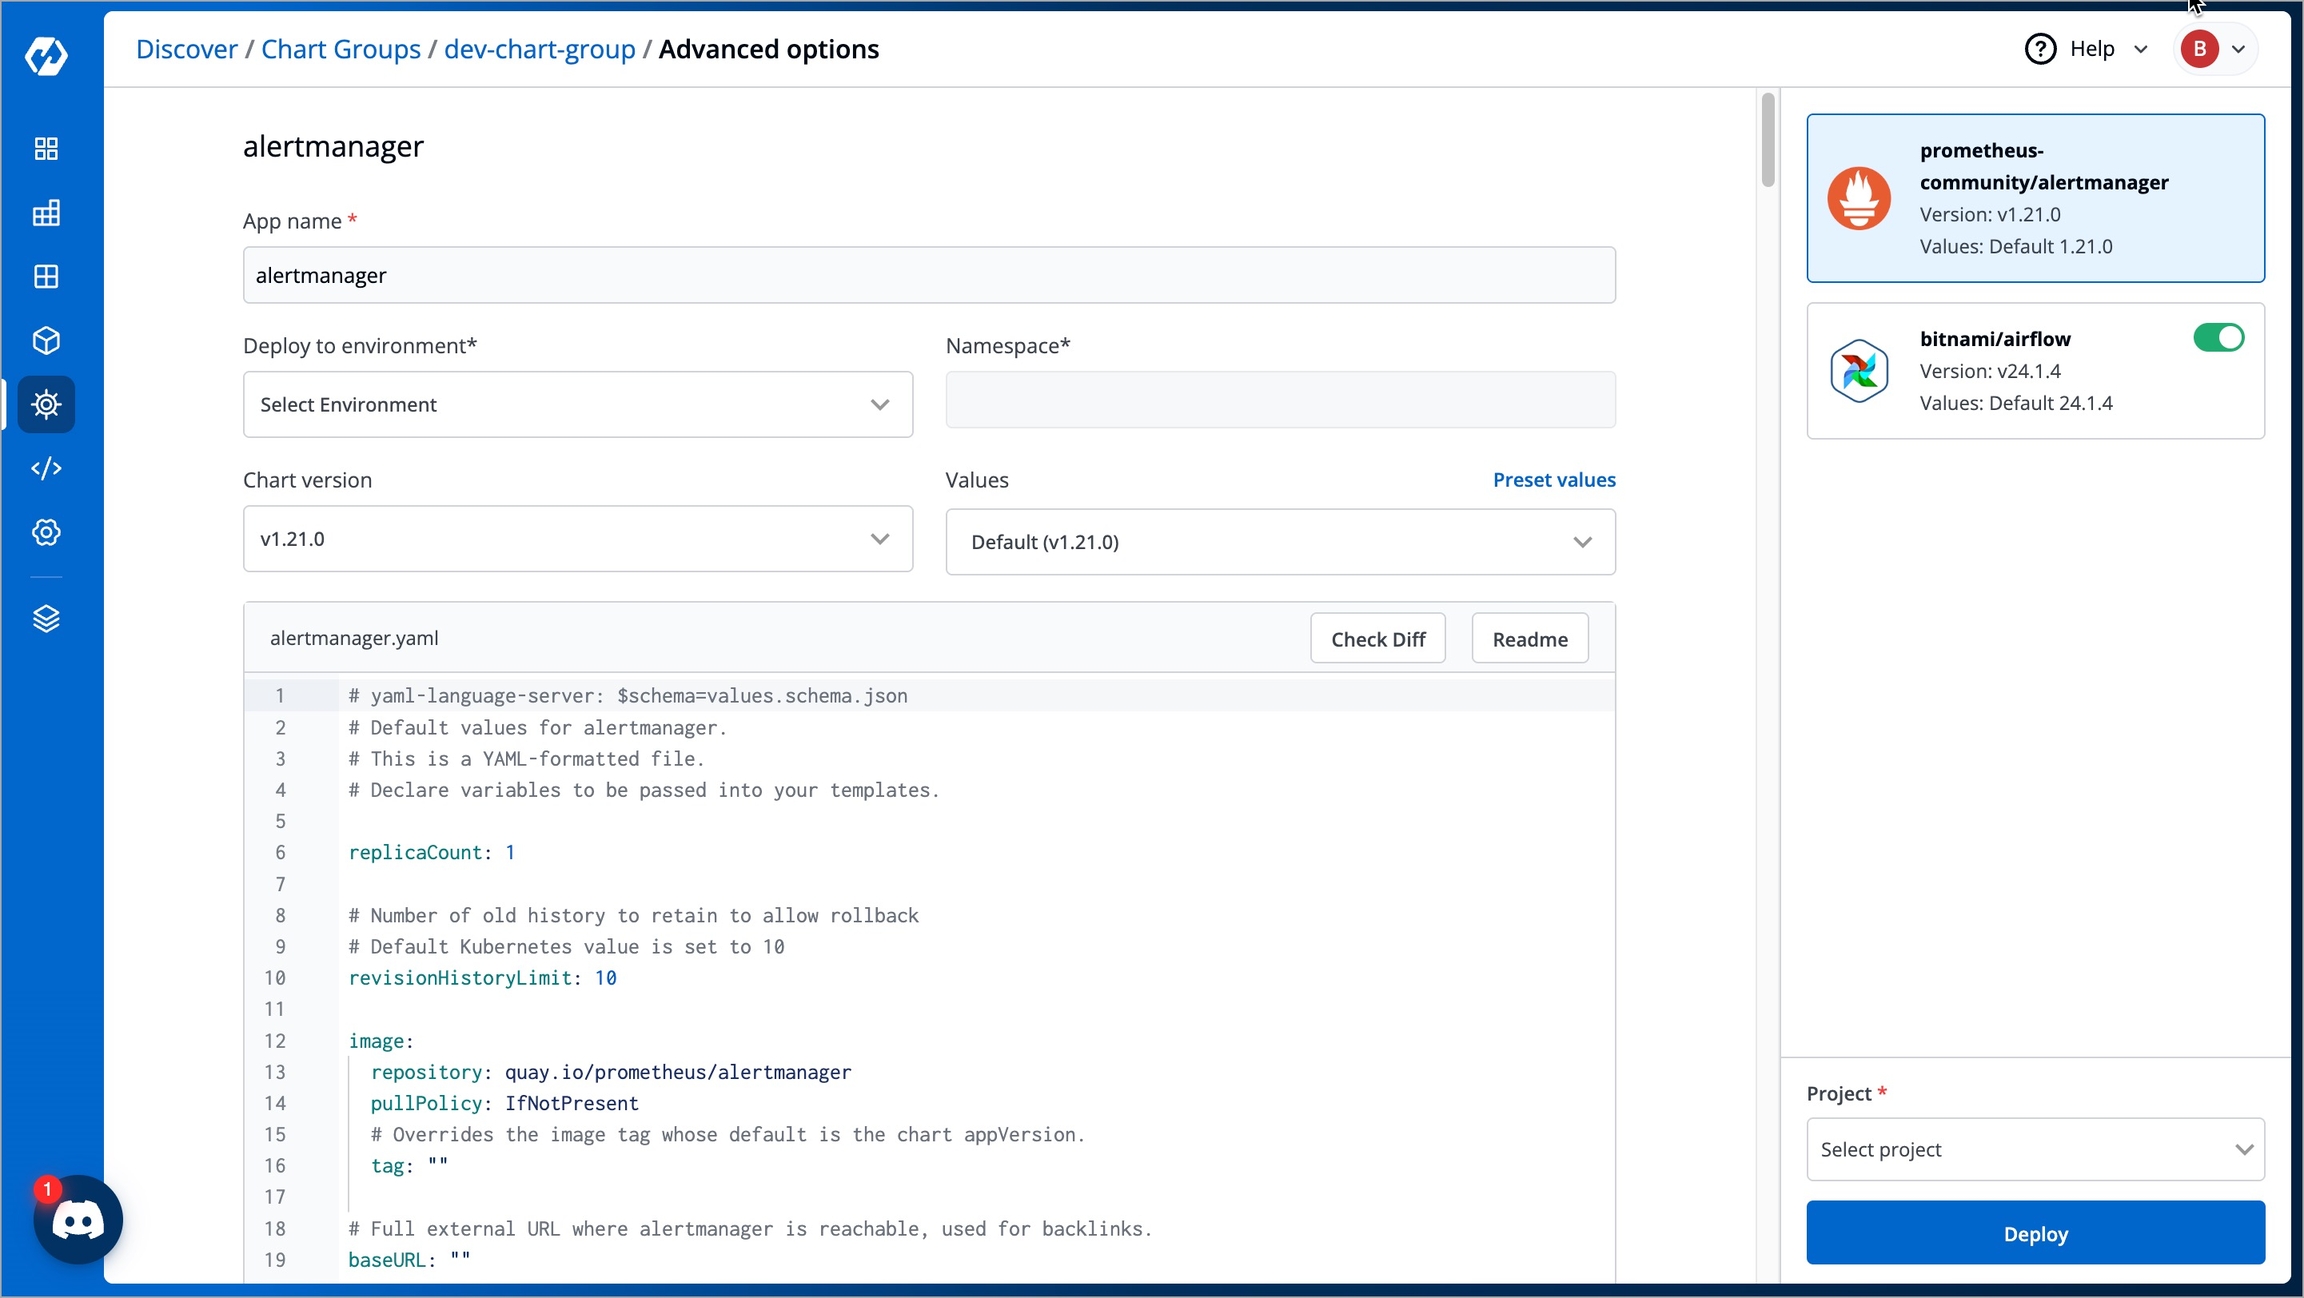
Enter your preferred application name in the App name field.
Select the environment where you want to deploy the charts in the Deploy to Environment drop-down box.
Select the chart version you'd like to use from the Chart version drop-down box.
Select the chart values you'd like to use from the Values drop-down box. If you want to configure a preset value for your chart, or use a previously configured one, select Preset values. Refer to Preset Values for more information.
Select the project in the Project drop-down box.
Click Deploy to deploy the charts. The deployment will be initiated.
Last updated
Was this helpful?