

Application Metrics
Application Metrics are the indicators used to evaluate the performance and efficiency of your application. It can be enabled in the Devtron platform to see your application's metrics.
Types of Metrics available in the Devtron platform:
CPU usage: Overall CPU utilization per pod and aggregated.
Memory Usage: Overall memory utilization per pod and aggregated.
Throughput: Number of requests processed per minute.
Latency: Delay between request and response, measured in percentiles.
Setup Application Metrics
Note
Application metrics can only be enabled if your application is deployed using Devtron Deployment Charts and not Custom Deployment Charts.
Install Grafana Dashboard:
To use the Grafana dashboard, you need to first install the integration from the Devtron Stack Manager.
Install Prometheus:
Go to the Chart Store and search for
prometheus. Use the Prometheus community'skube-prometheus-stackchart to deploy Prometheus.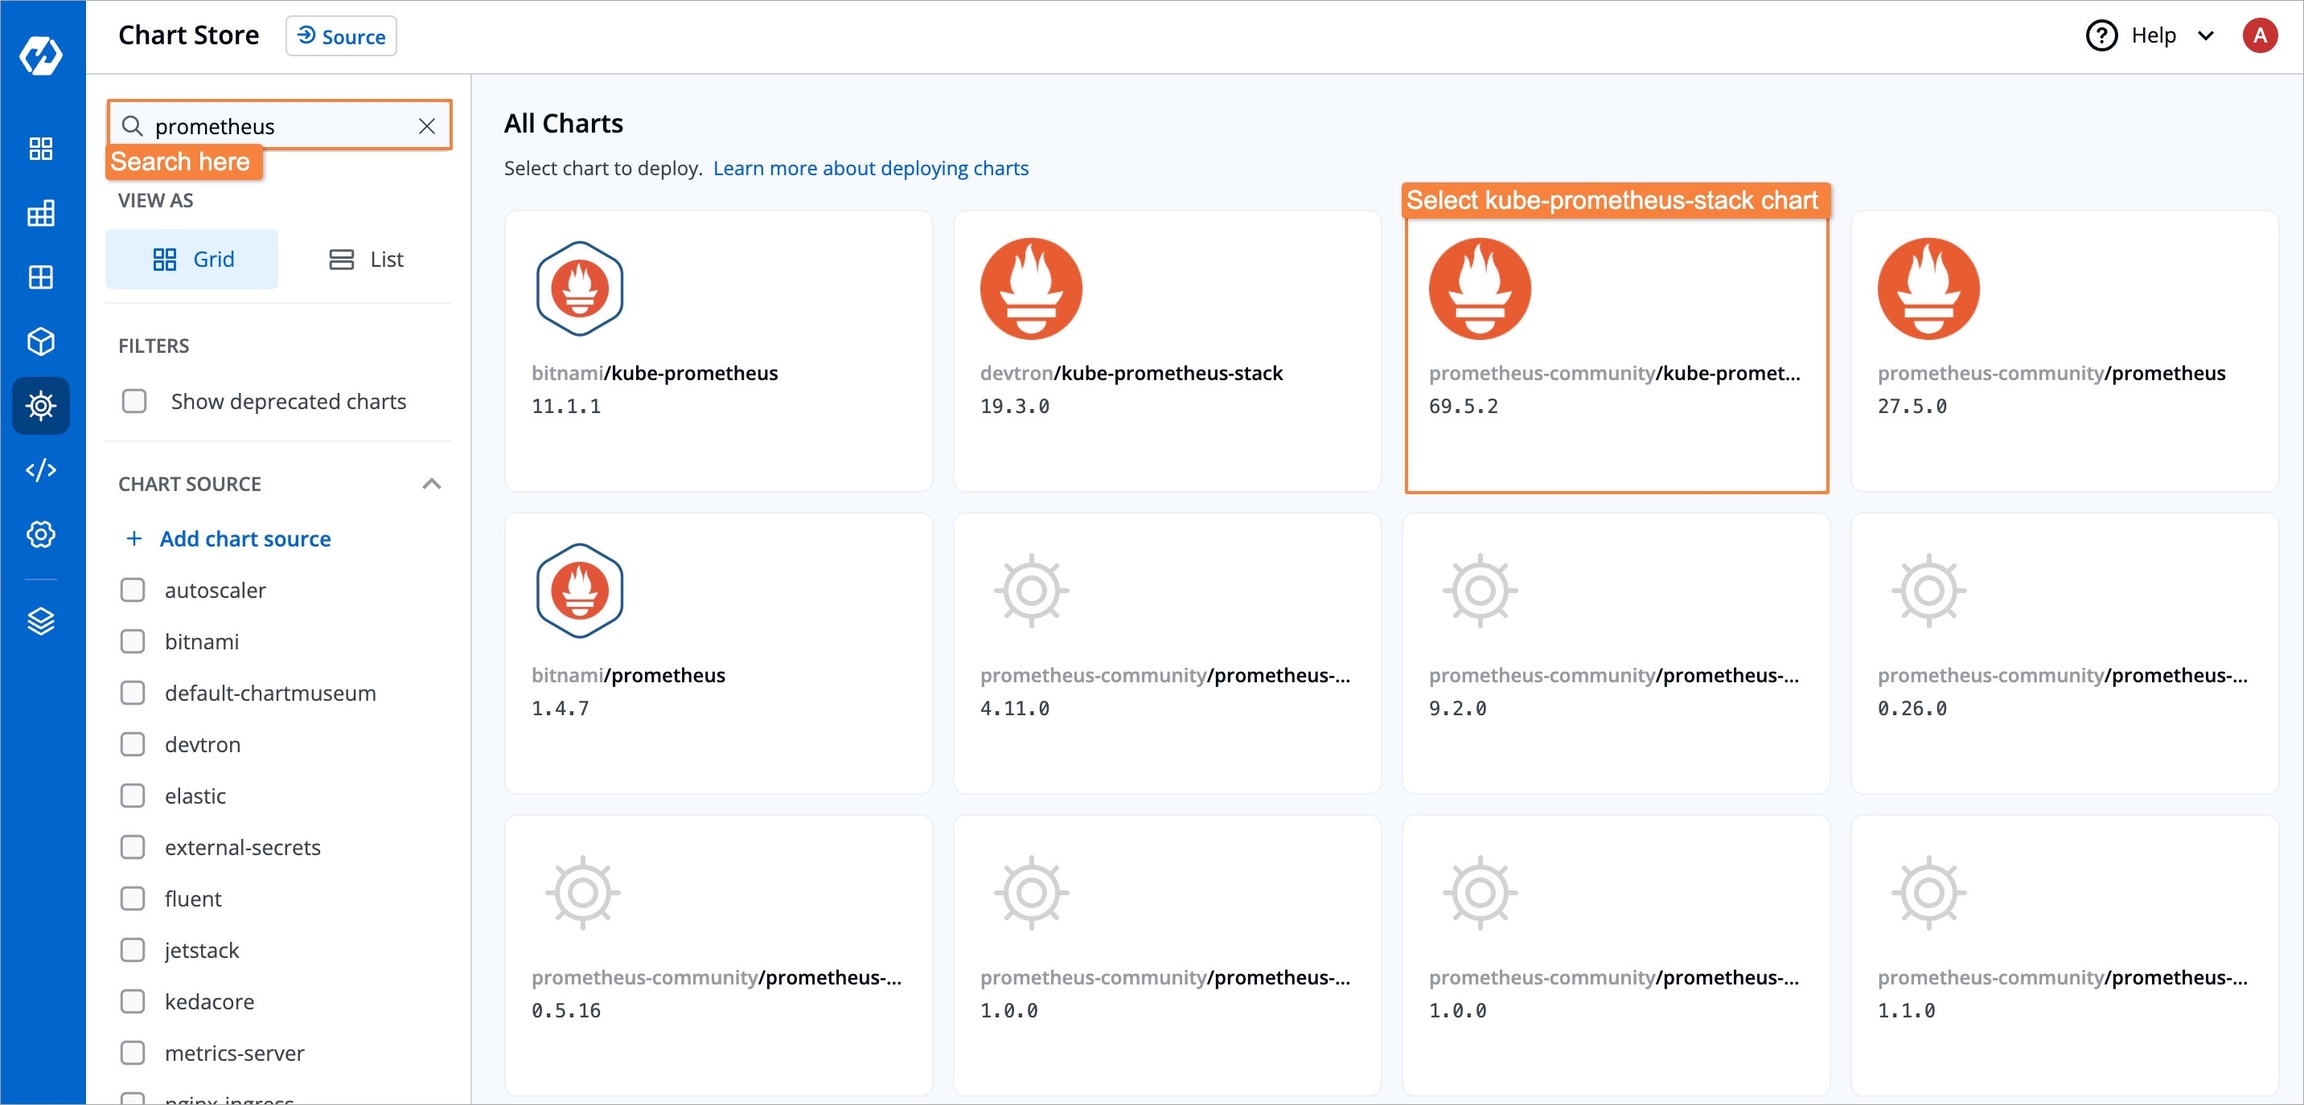
Figure 1: Chart Store After selecting the chart, configure these values as needed before deployment.
kube-state-metrics:
  metricLabelsAllowlist:
  - pods=[*]
Search for the above parameters, and update them as shown (or customize as needed).
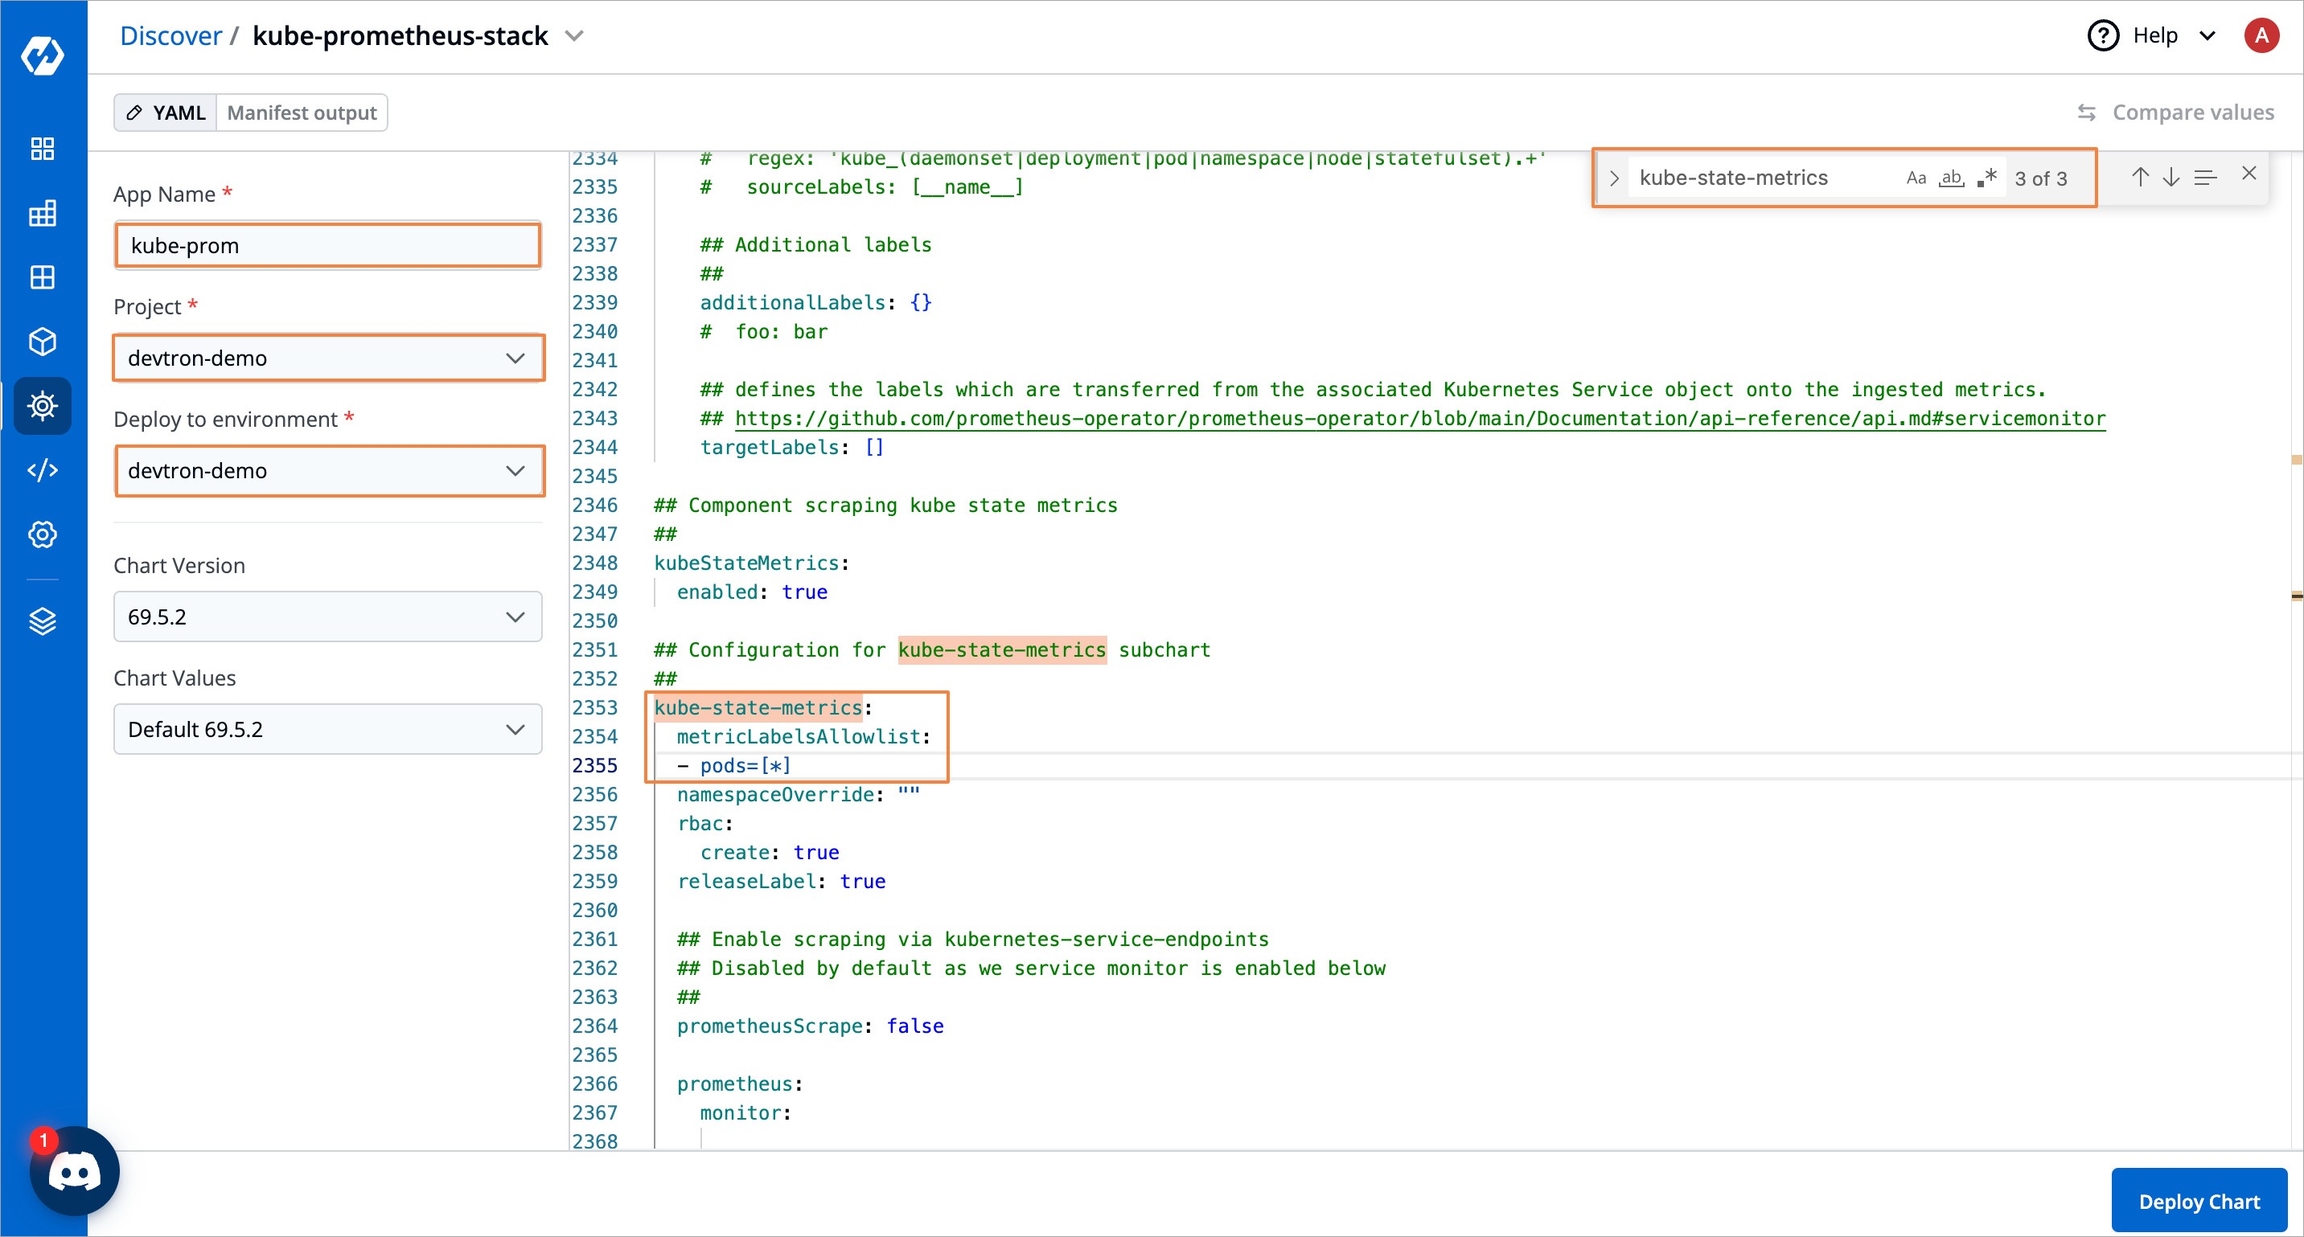
Figure 2: Prometheus Chart Enable
upgradeJobparameter to install CRDs:Since Helm does not automatically apply CRDs, you need to enable the
upgradeJobparameter in the Helm chart to ensure CRDs are applied before deploying Prometheus.In the Prometheus Helm chart settings, locate the
upgradeJobparameter and set it totrueif it isfalse.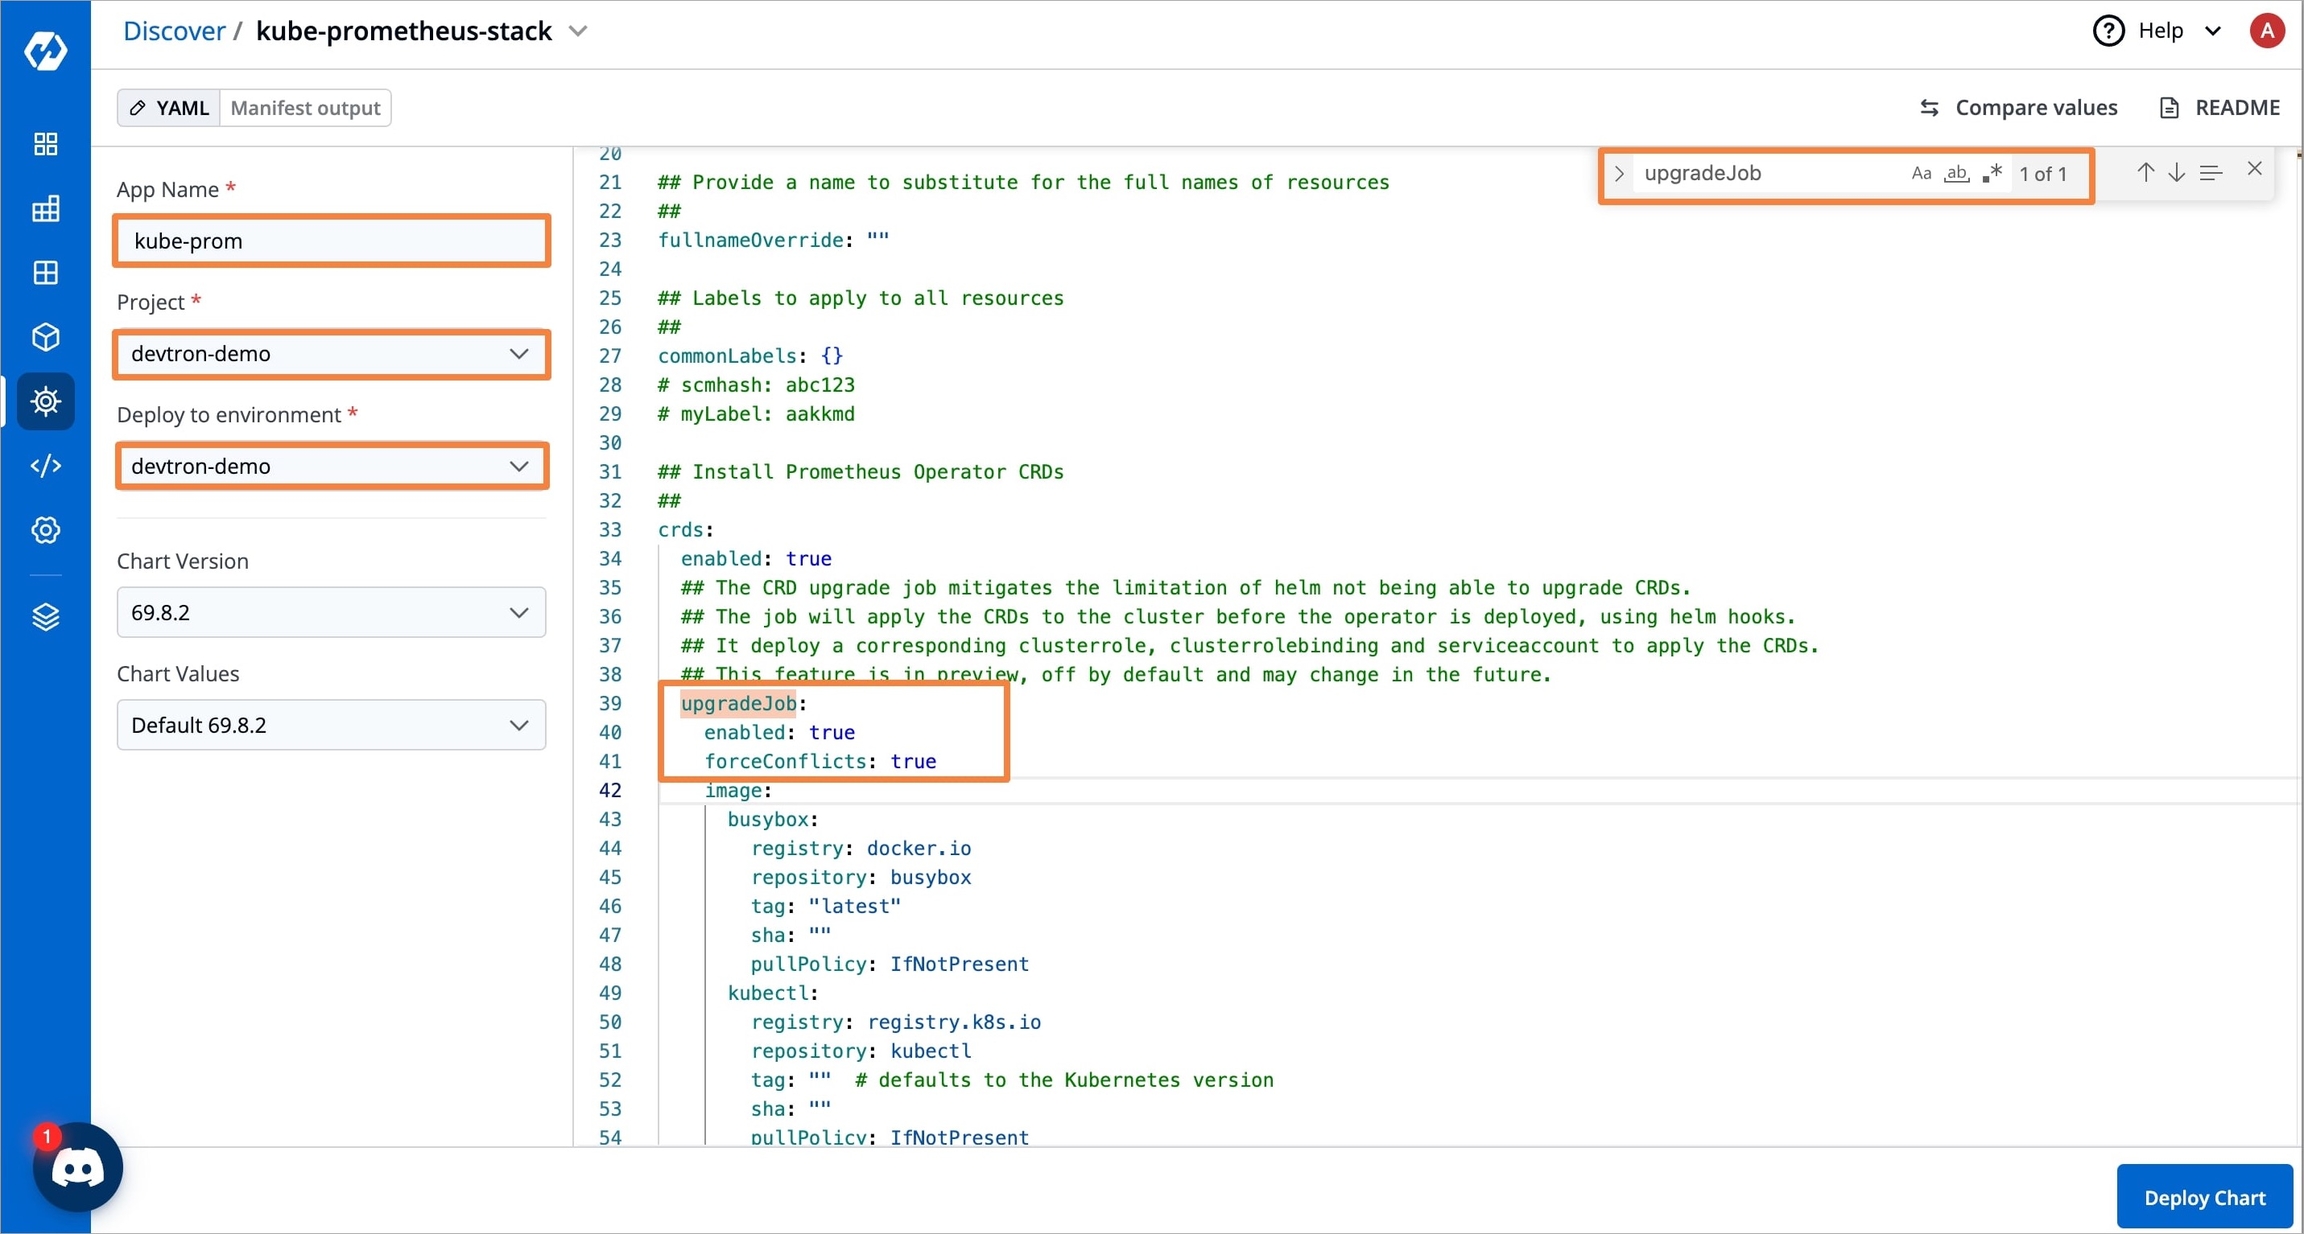
Figure 3: upgradeJob Parameter After enabling the parameter, click
Deploy Chart.
Setup Prometheus Endpoint:
Once Prometheus is installed, go to its App Details and navigate to Networking → Service in the K8s resources. Expand the Prometheus server service to see the endpoints.
Copy the URL of the
kube-prometheusservice as shown in the image below.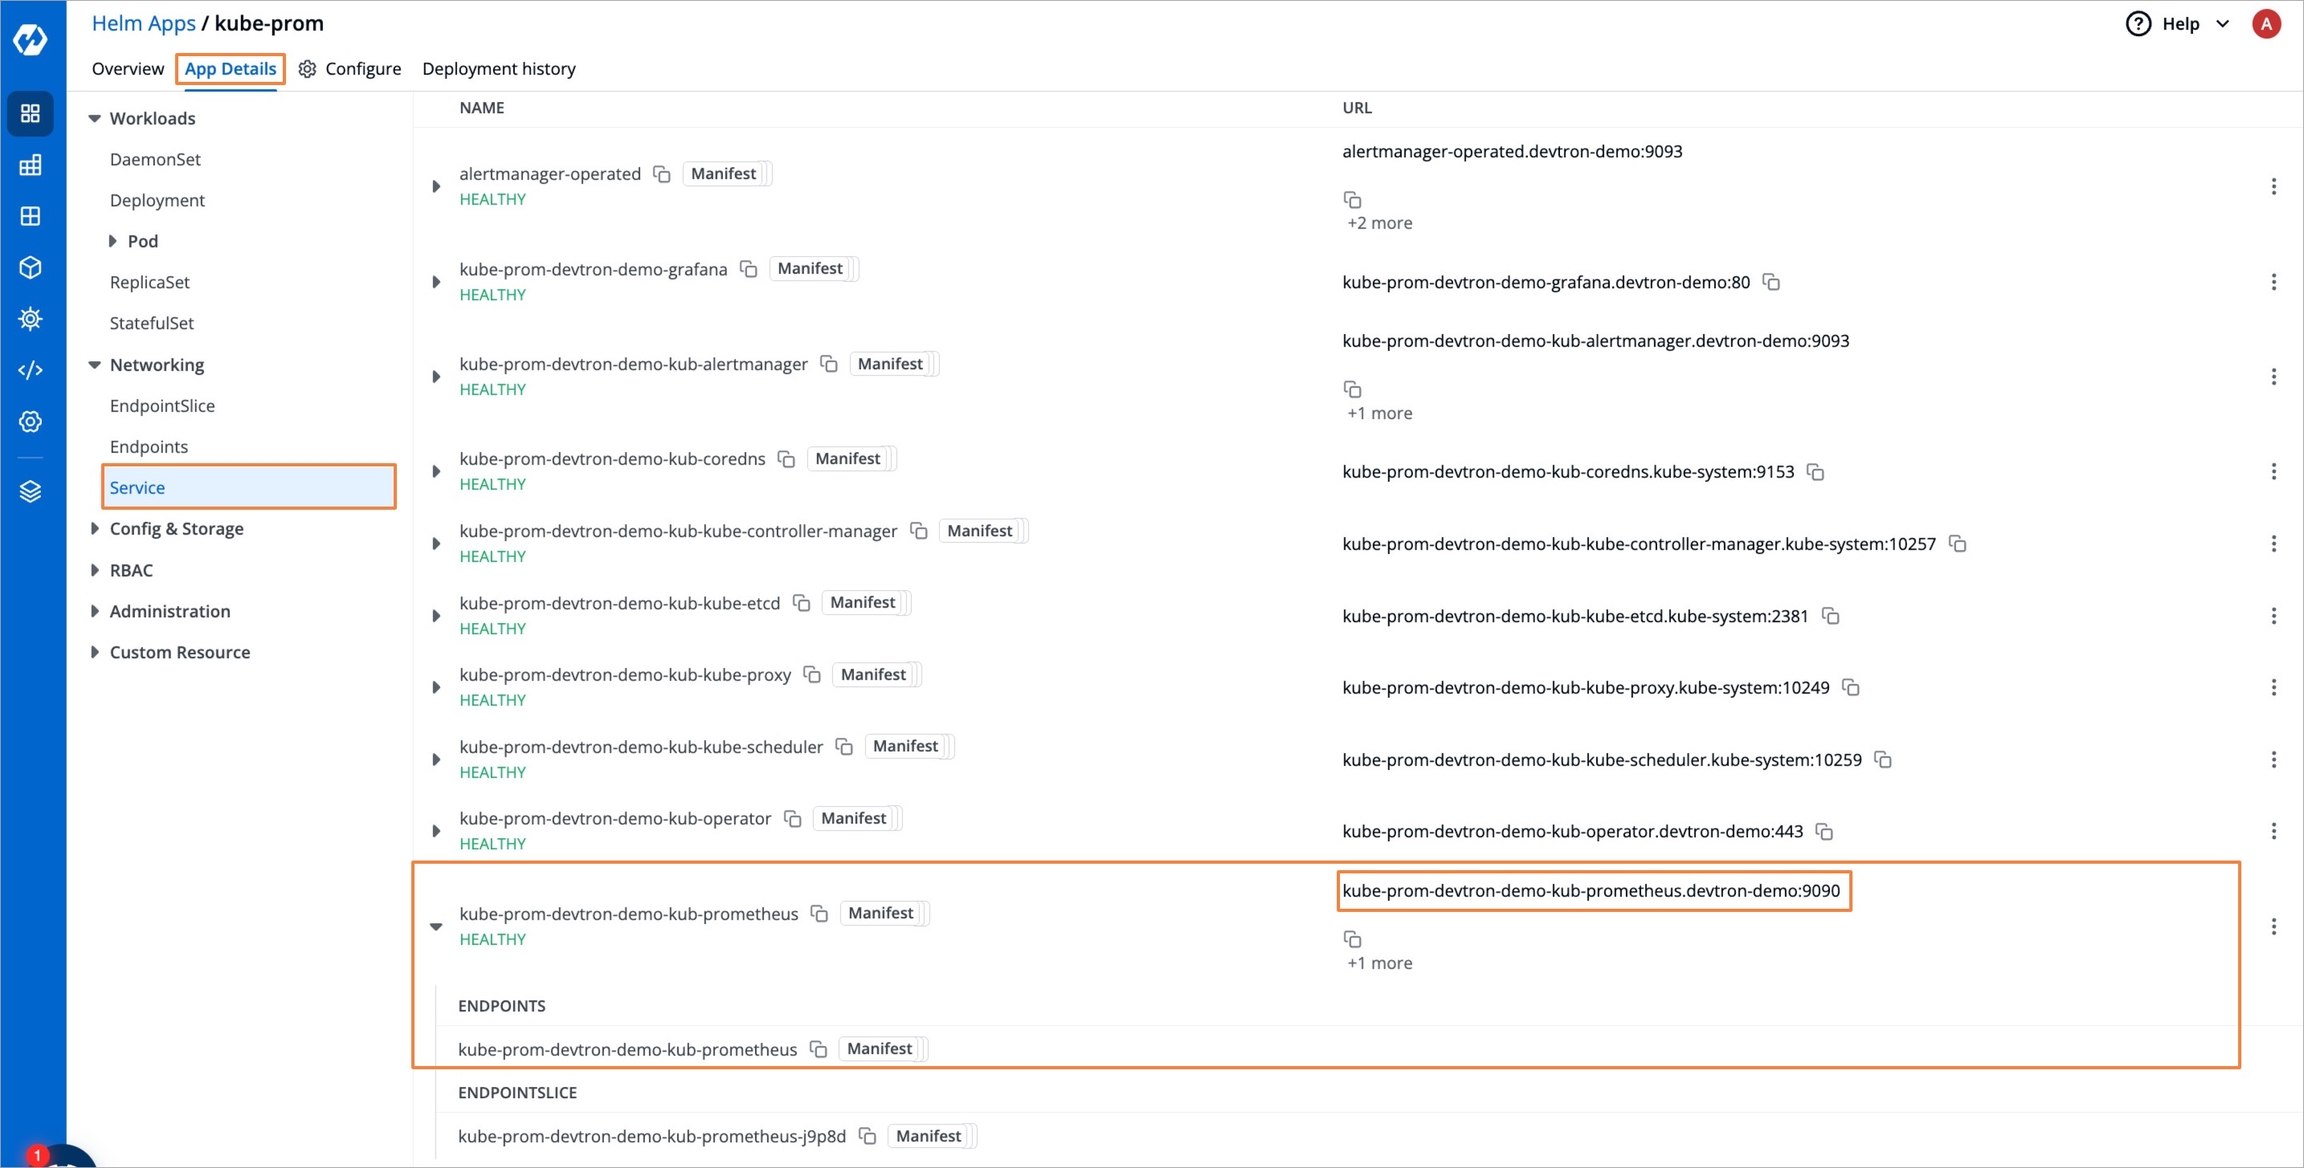
Figure 4: Prometheus Service To set Prometheus as a data source in Grafana, navigate to Global Configurations → Clusters & Environments, select your cluster, and edit its settings.
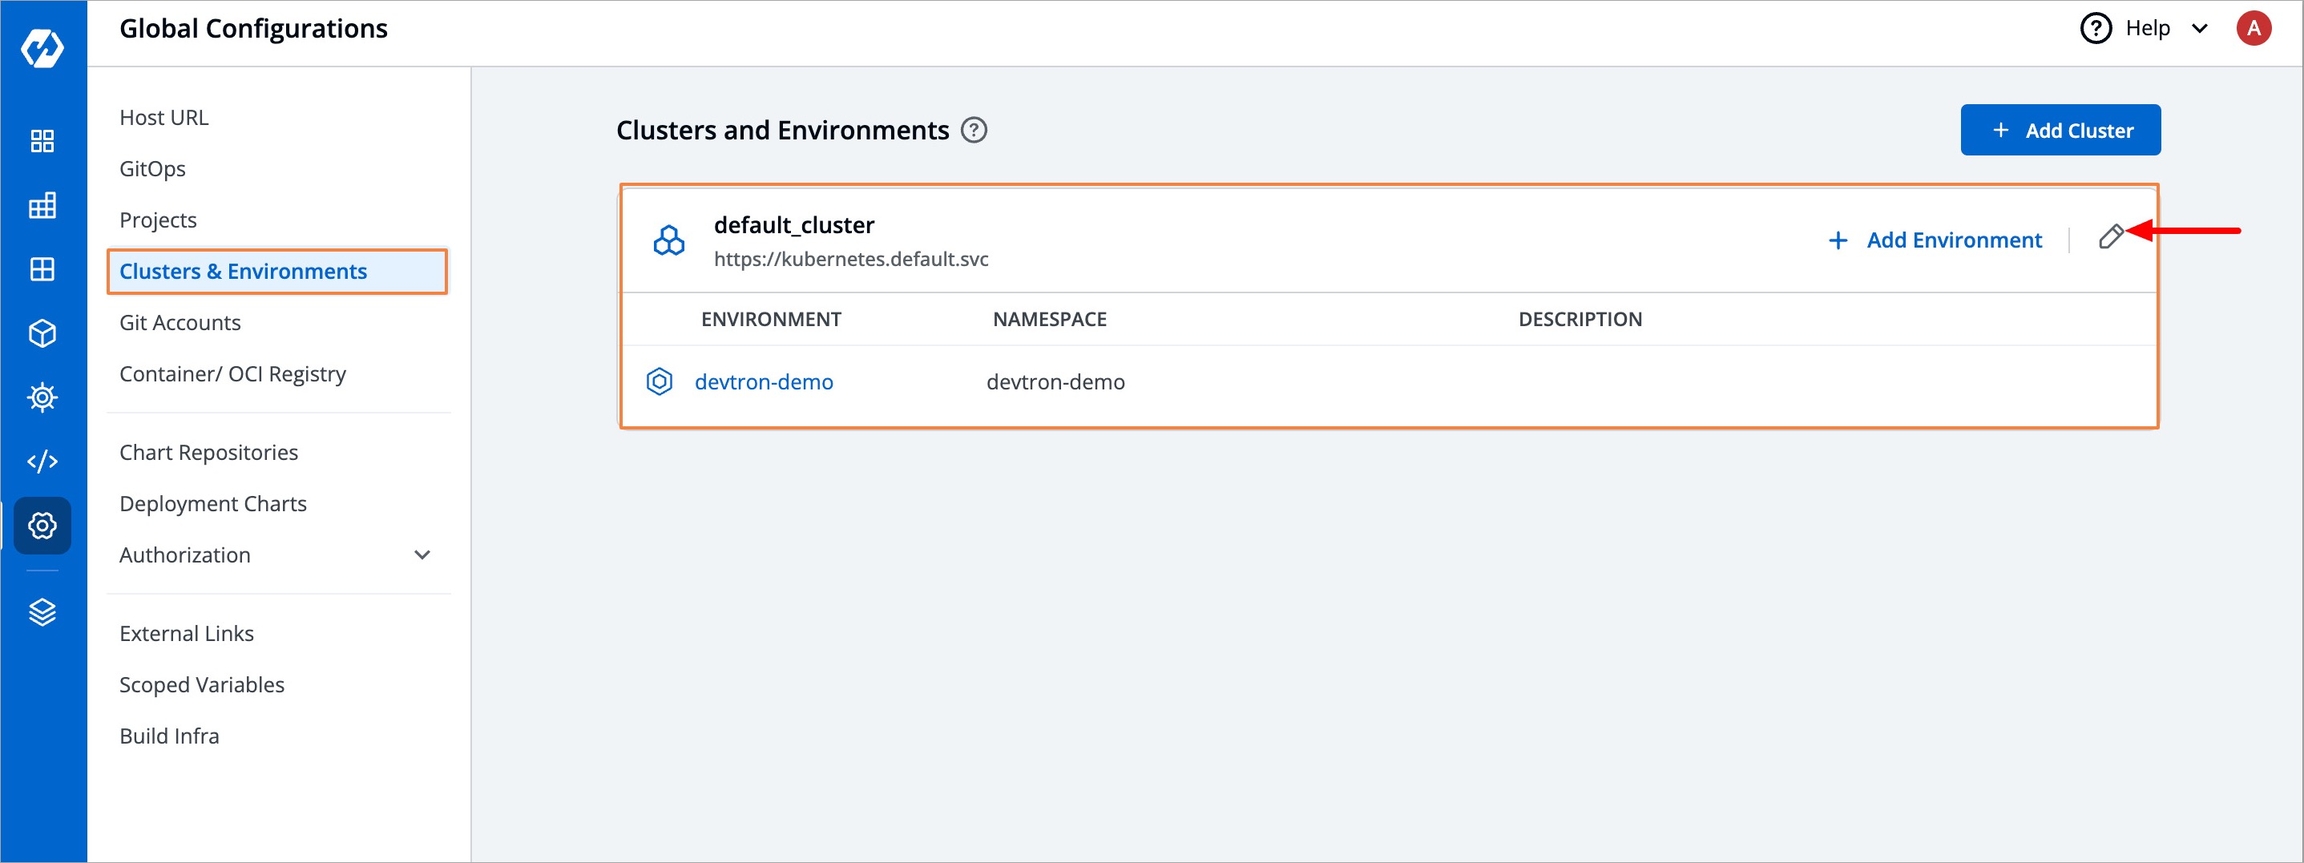
Figure 5: Clusters and Environments Now to set up the Prometheus endpoint:
Enable the
See metrics for applications in this clusteroption, as shown in the image below.Paste the copied URL into the Prometheus endpoint field, ensuring it includes
http://Click Update Cluster to save the changes.
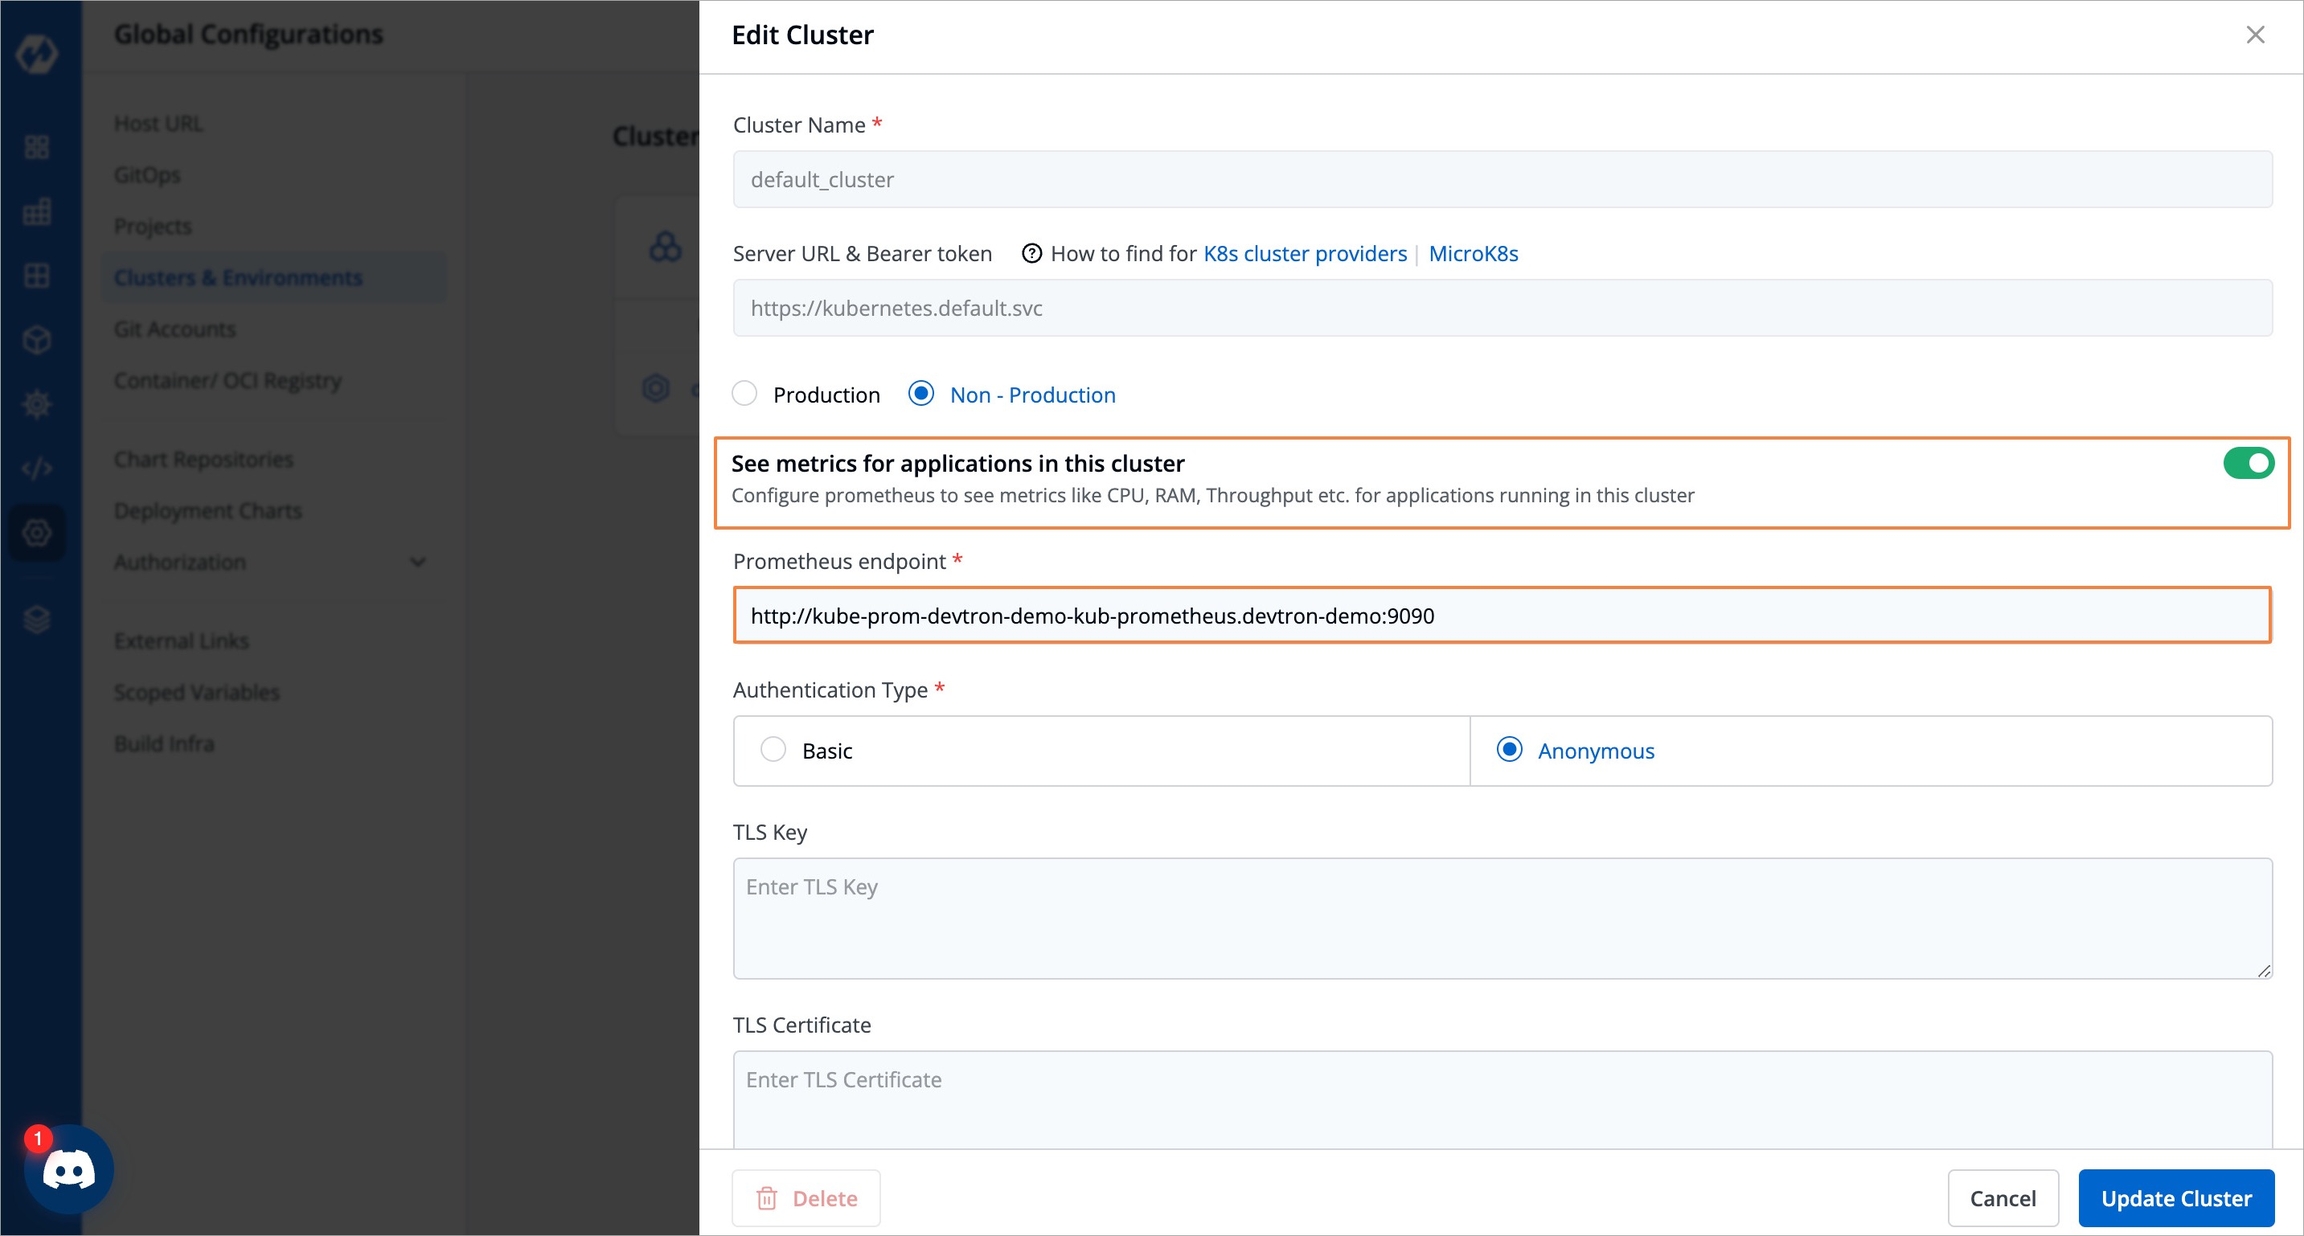
Figure 6: Prometheus Endpoint
After adding the endpoint, application metrics will be visible in the Devtron dashboard for all the Devtron apps in the cluster (it may take a few minutes). This includes CPU usage and Memory usage.
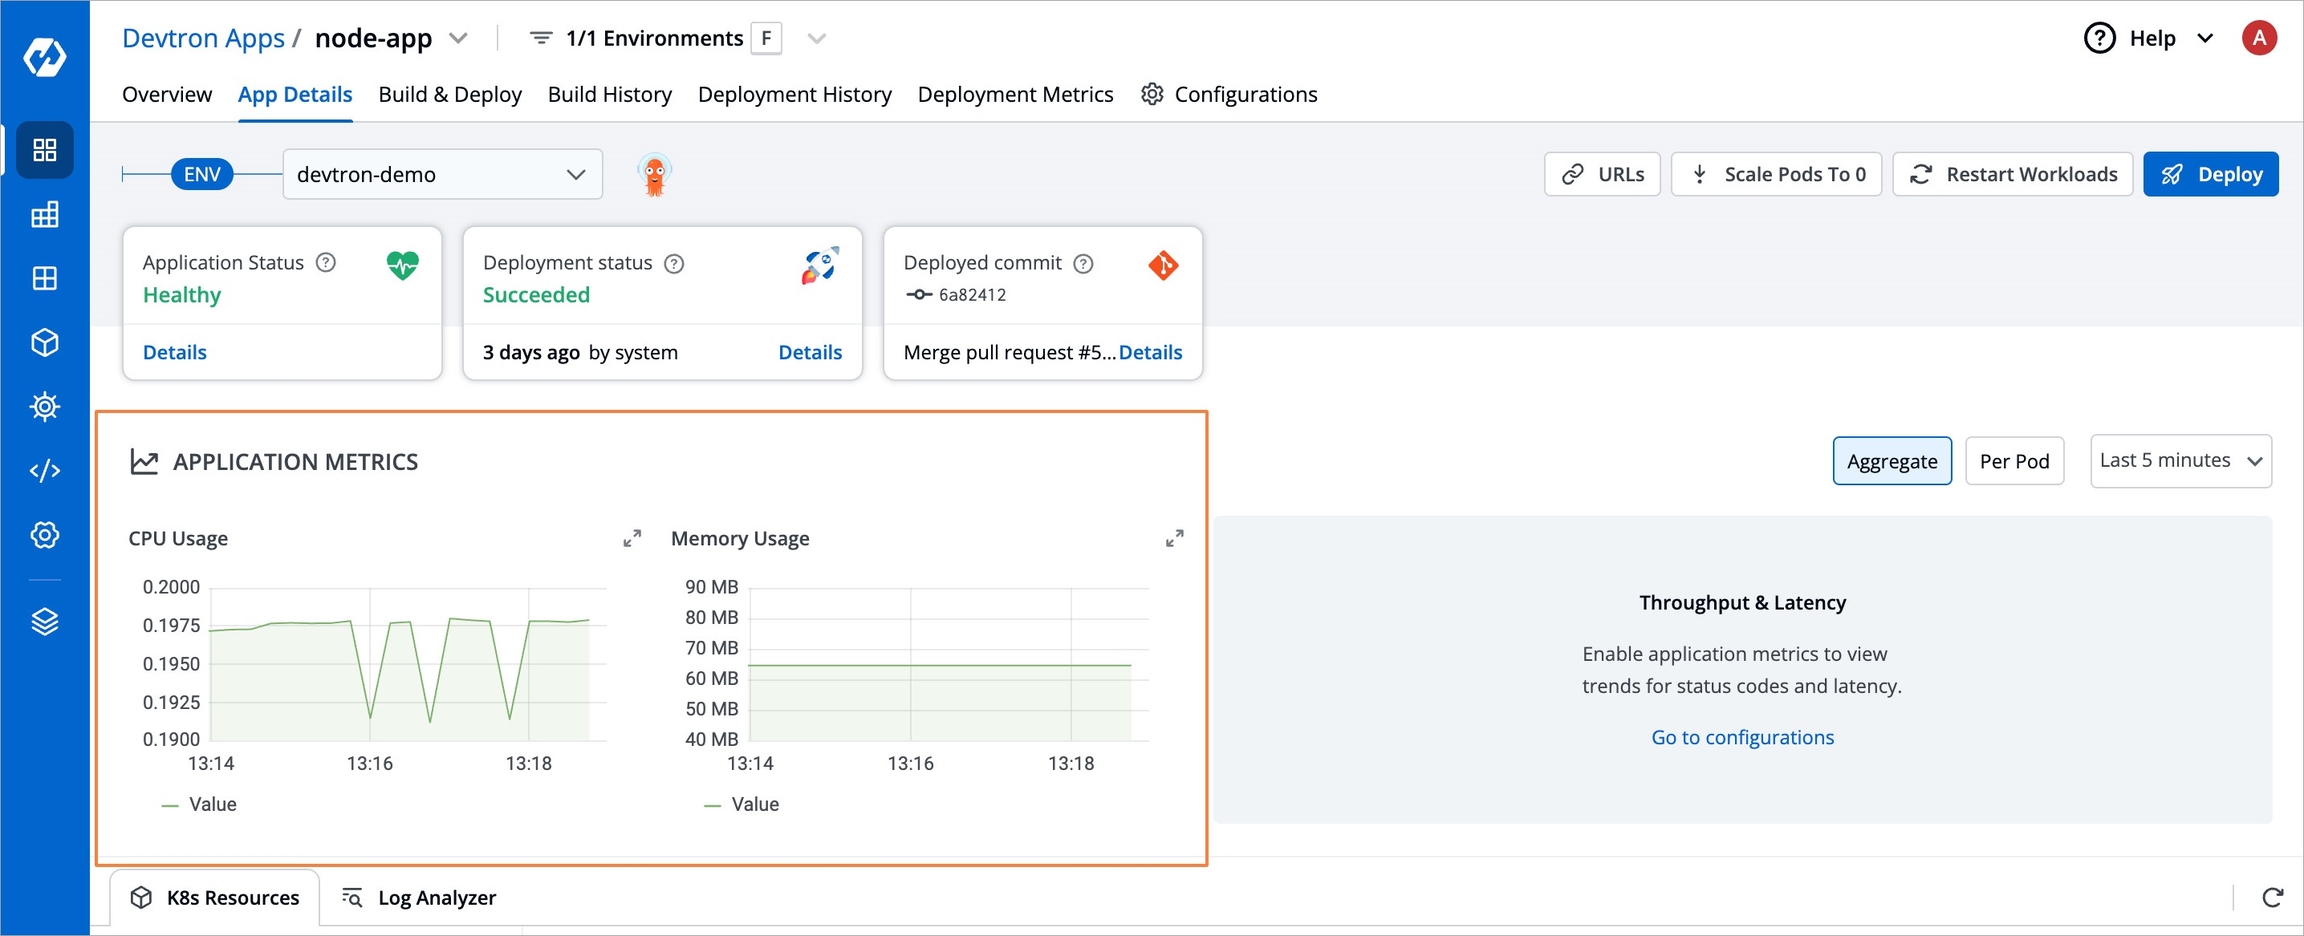
Figure 7: CPU Usage & Memory Usage Enable Application Metrics:
To enable Throughput and Latency metrics in Devtron, follow these steps:
Open your Devtron app.
Go to Configurations → Base Configurations → Deployment Template.
Enable Application Metrics in the Deployment Template as shown below and save the changes.
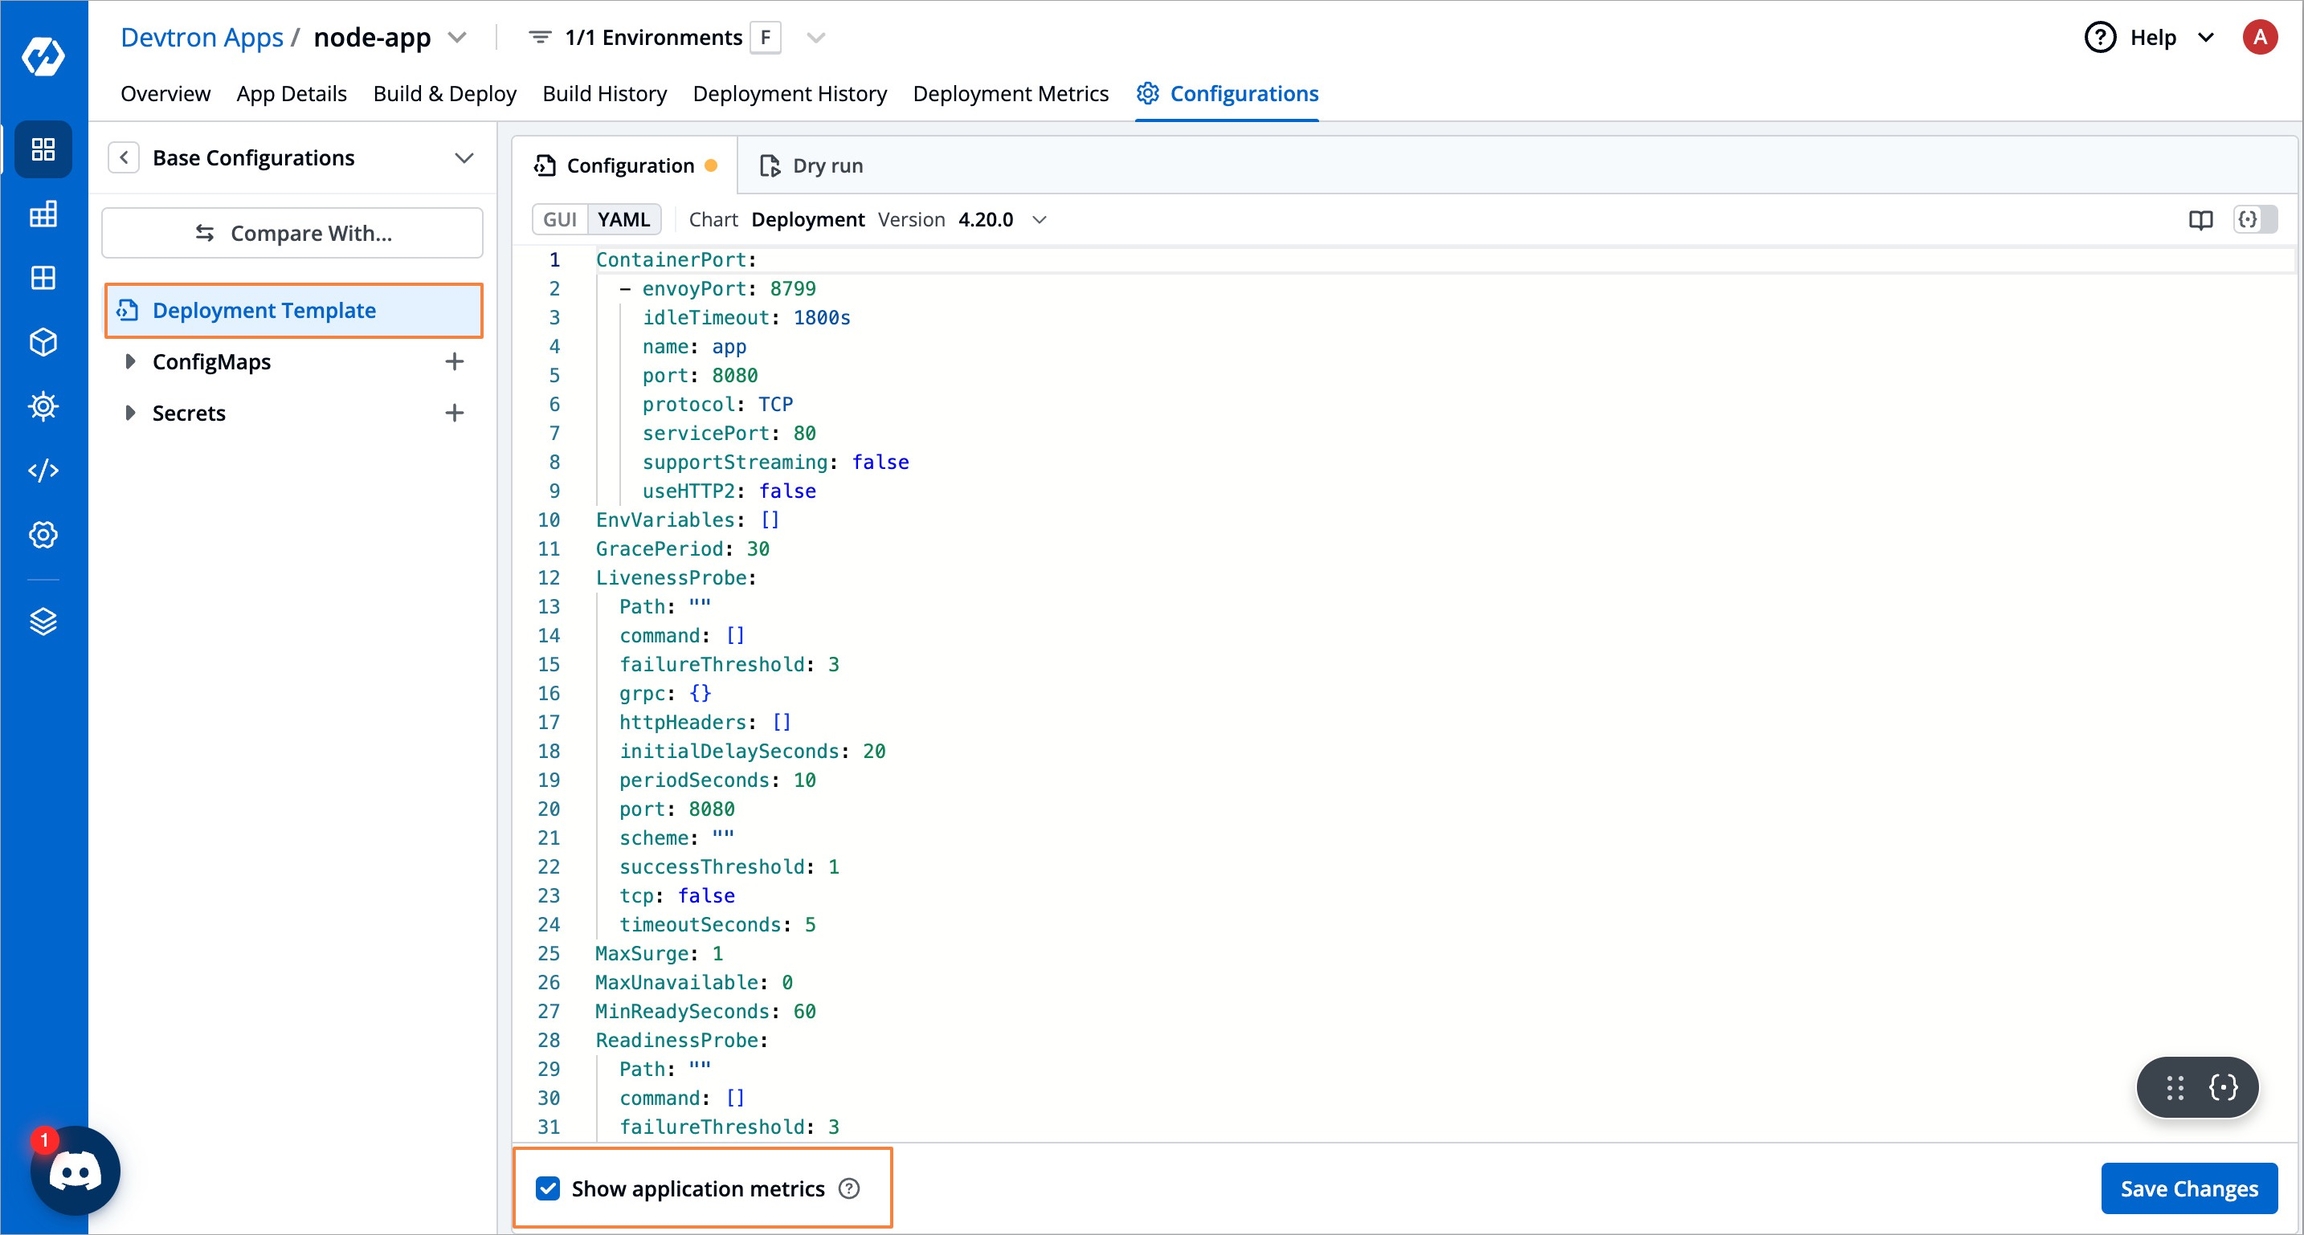
Figure 8: Enable Application Metrics Now, you can track all your application metrics by navigating to Applications and going to the App Details page of your Devtron App as shown below.
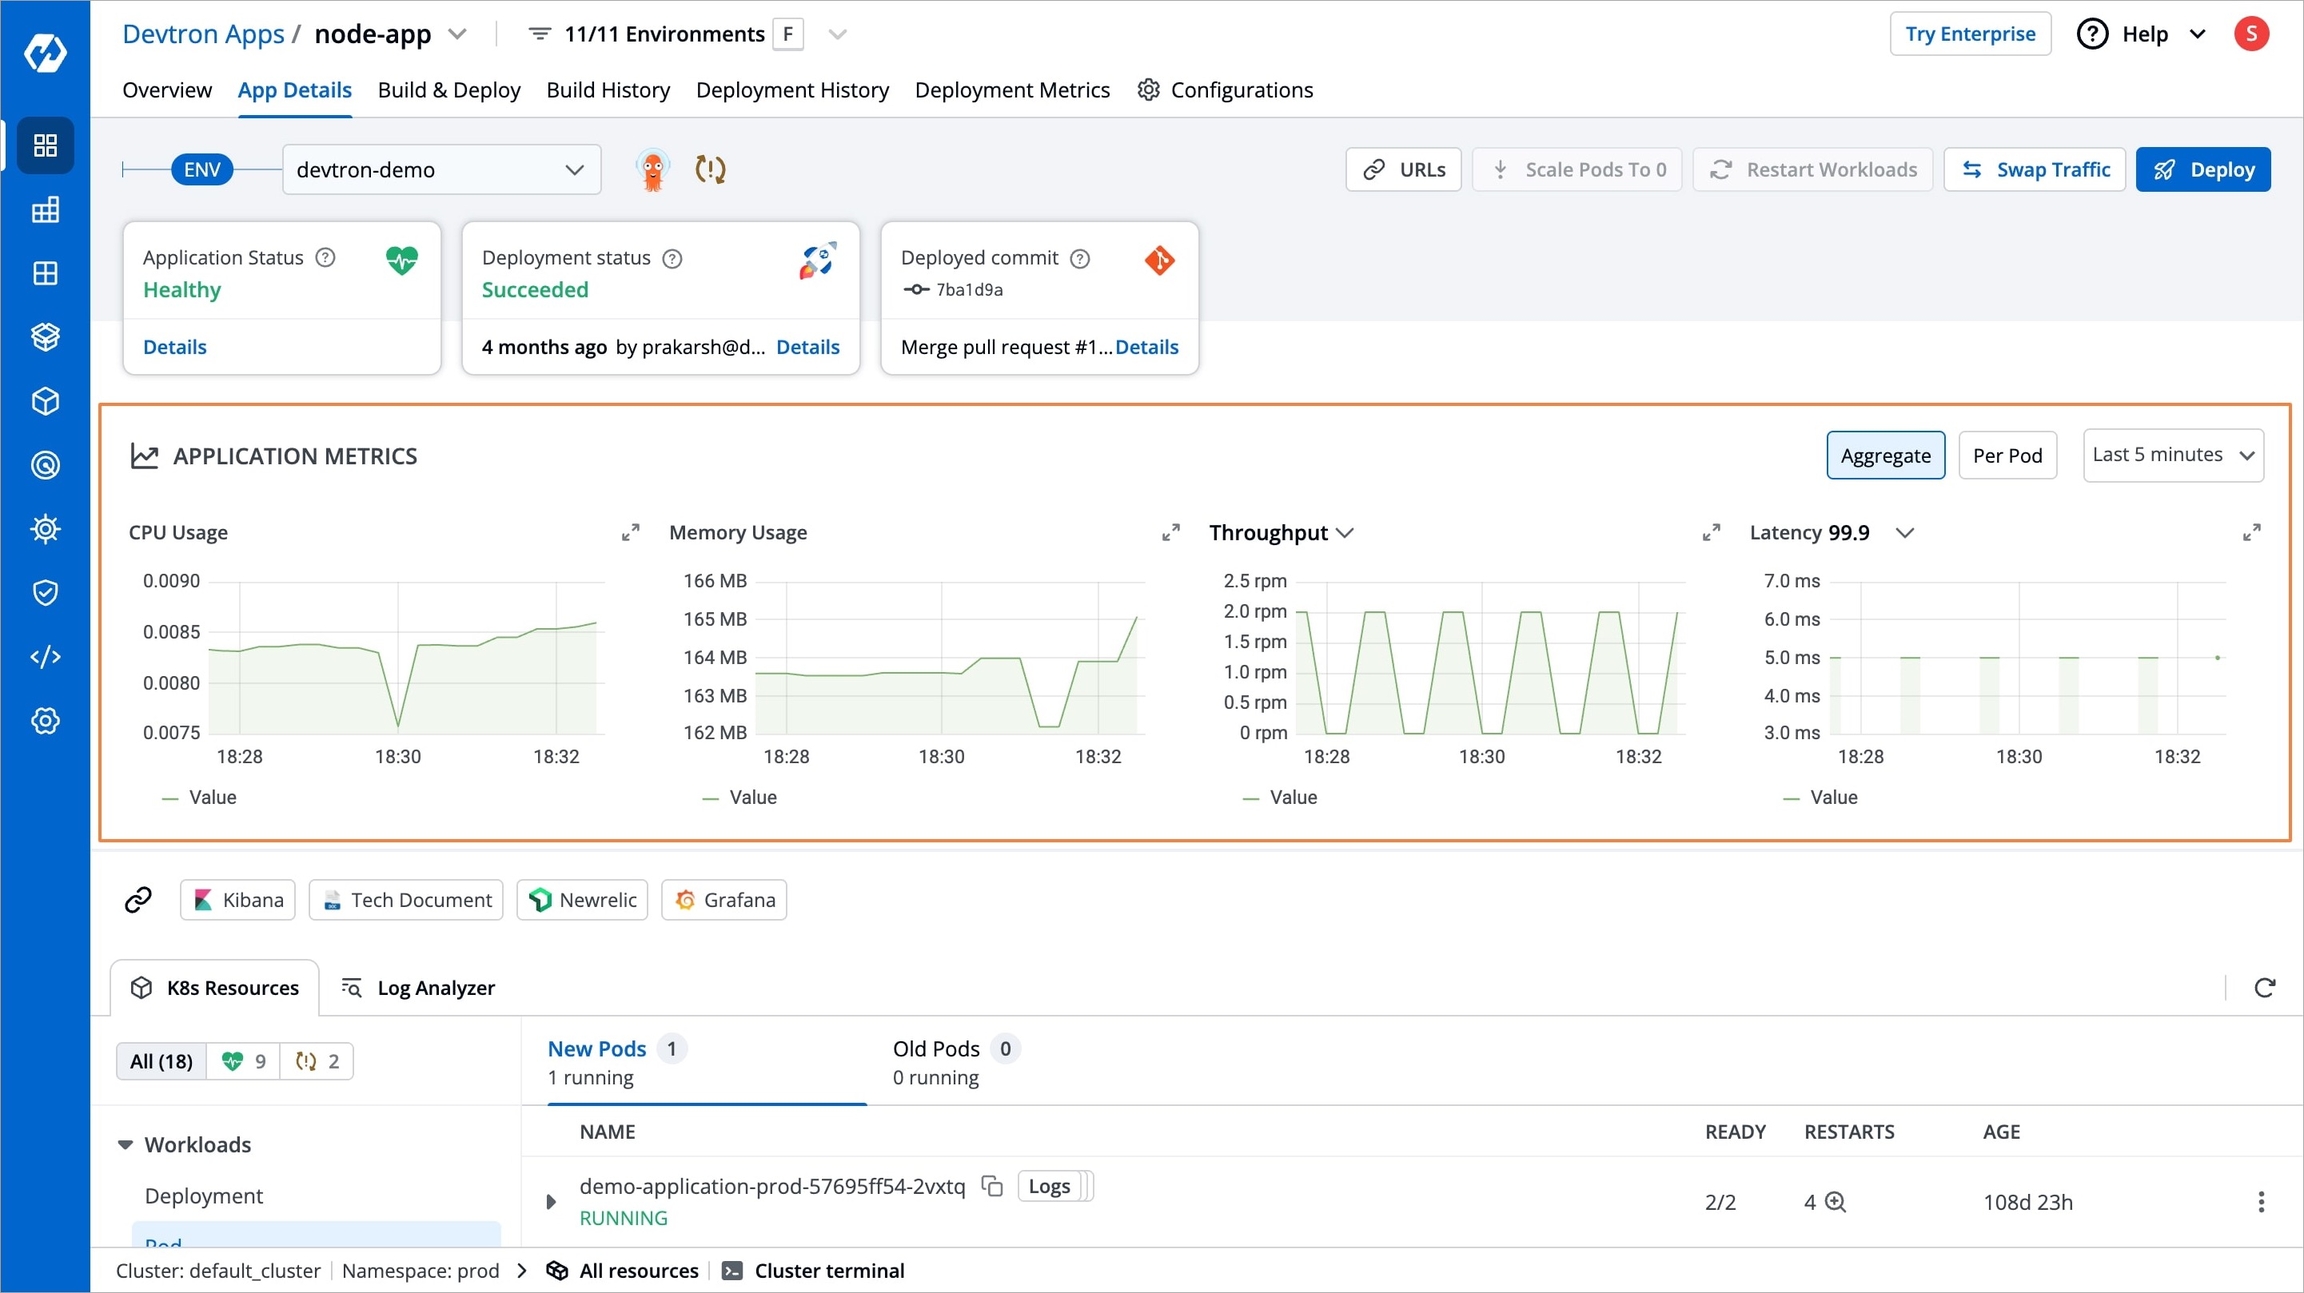
Figure 9: Application Metrics
Note
If your environment is Overridden, you need to enable the Application Metrics at the environment override deployment template instead of the base deployment template.
Last updated
Was this helpful?