Resource Browser
Last updated
Was this helpful?


Last updated
Was this helpful?
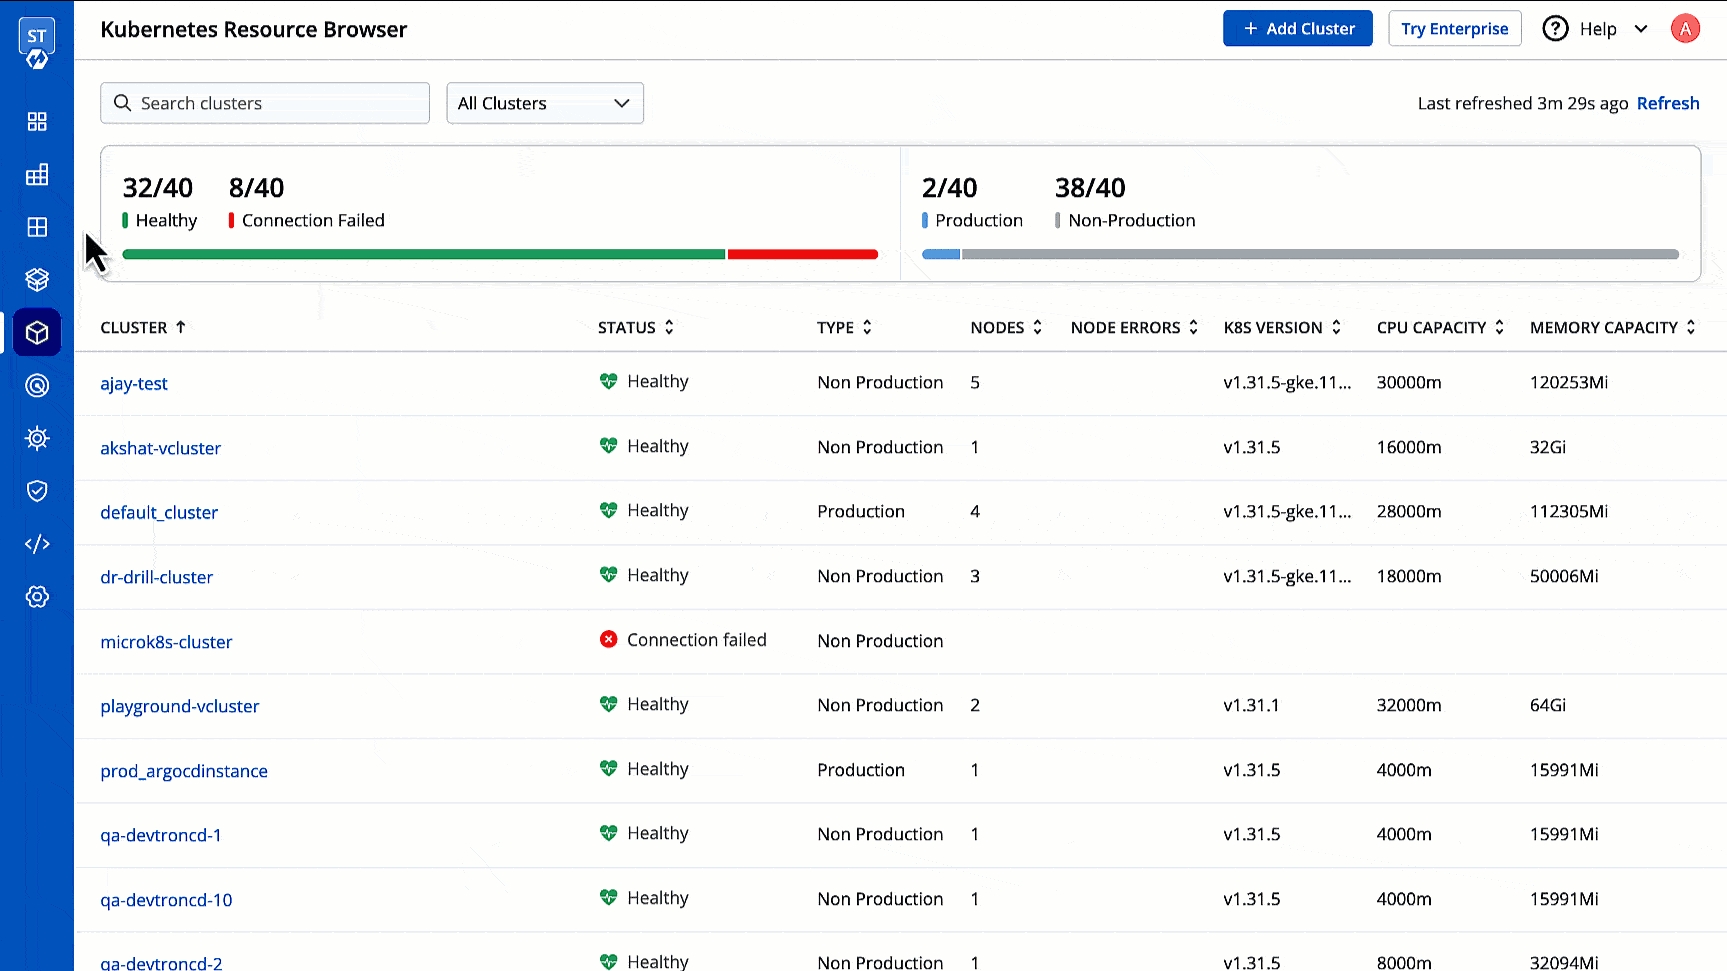
The Devtron Resource Browser provides you a central interface to view and manage all your across clusters. It helps you perform key actions like viewing logs, editing live manifests, and even creating/deleting resources directly from the user interface. This is especially useful for troubleshooting purposes as it supports multi-cluster too.
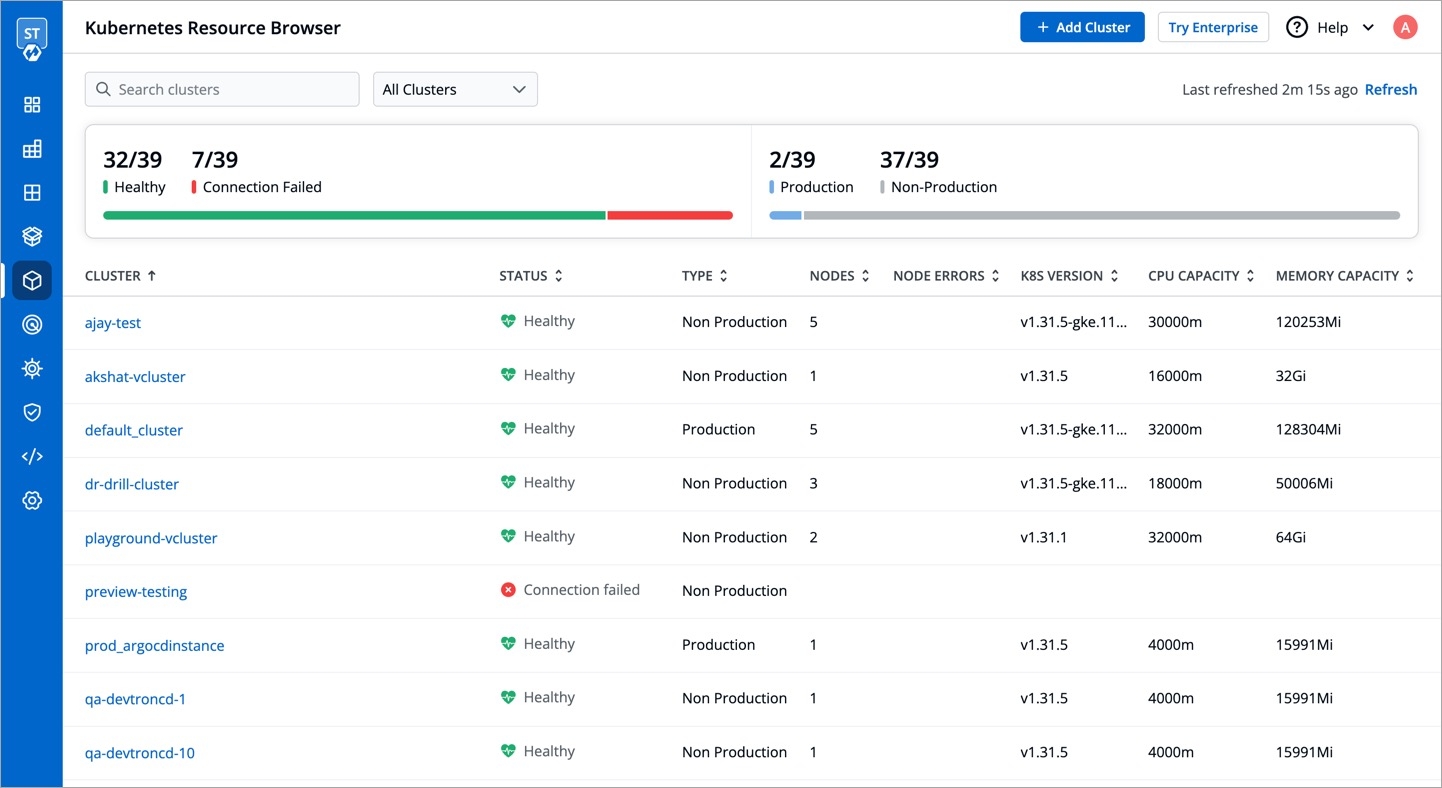
First, the Resource Browser shows you a list of clusters added to your Devtron setup. By default, it displays a cluster named 'default_cluster' after the is successful.
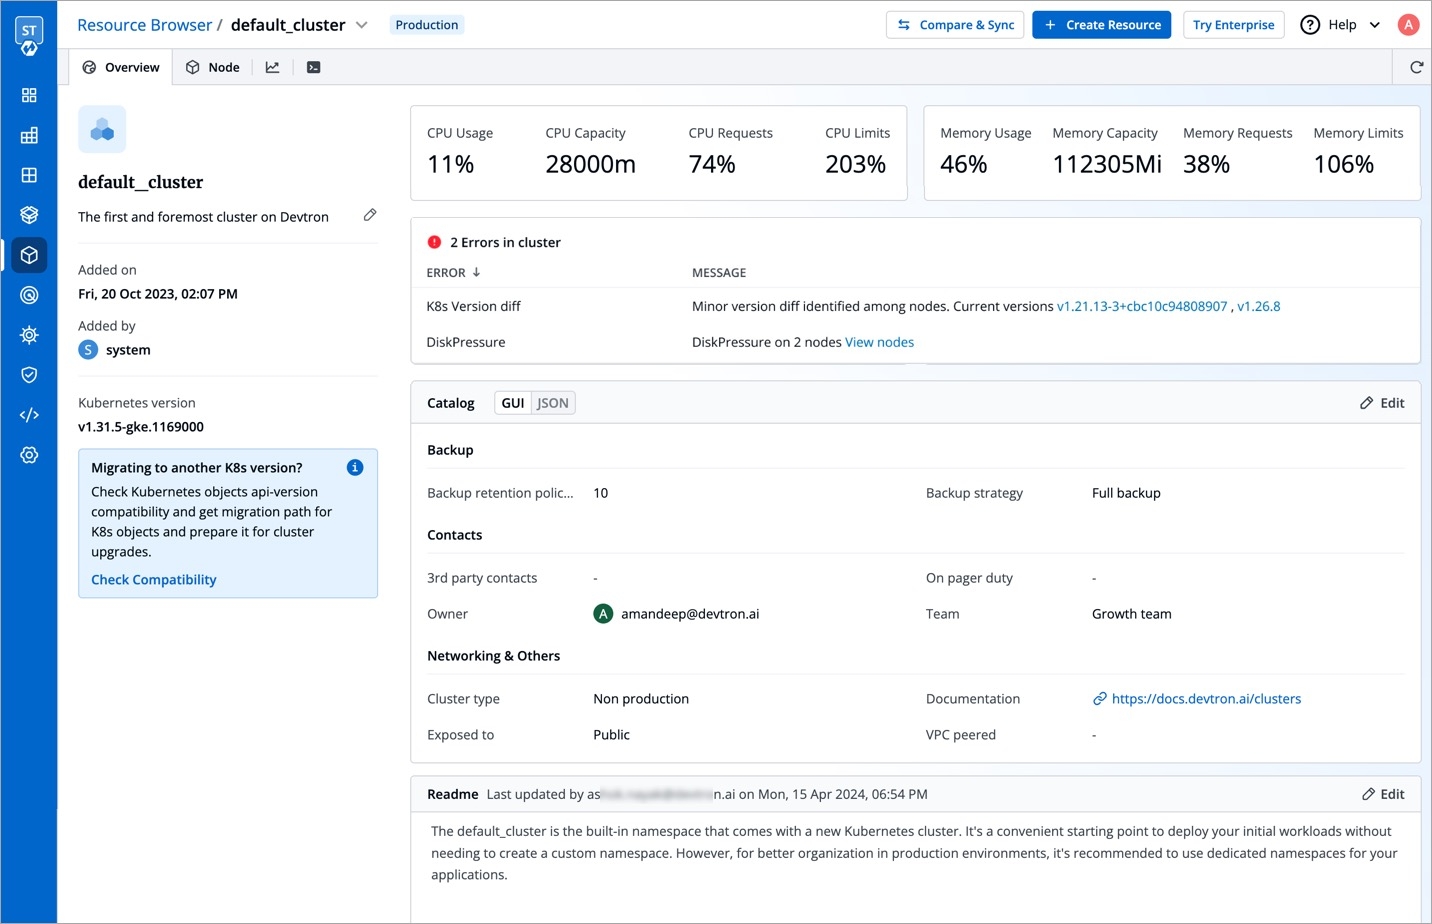
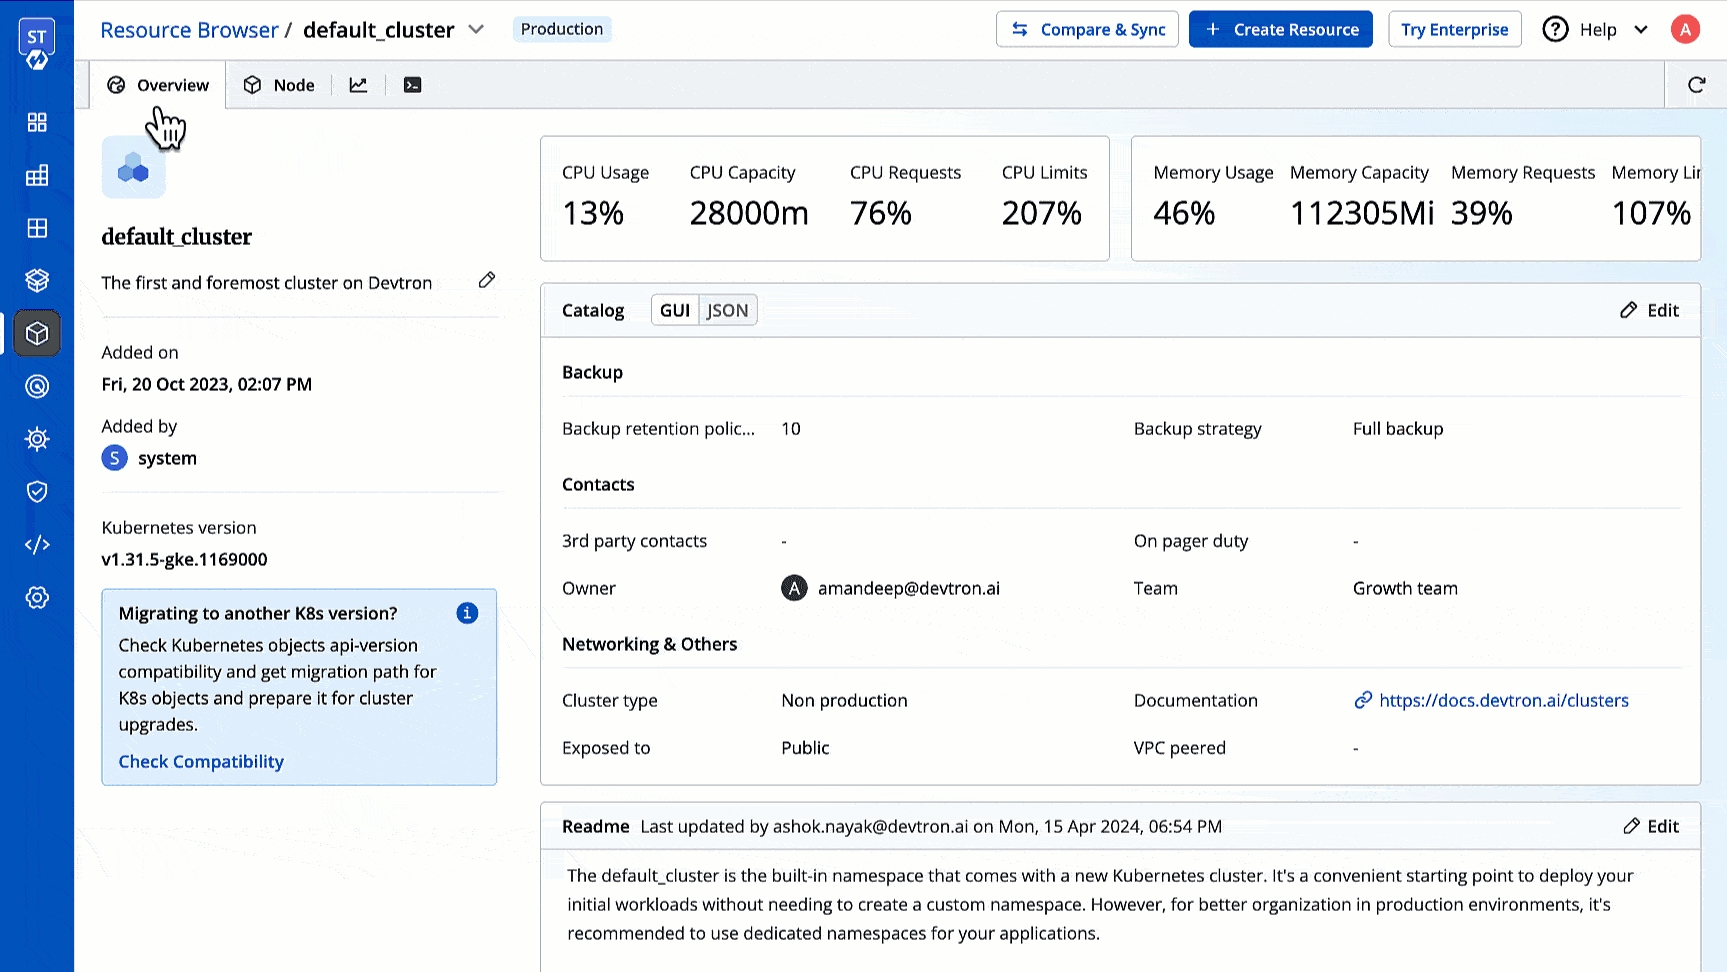
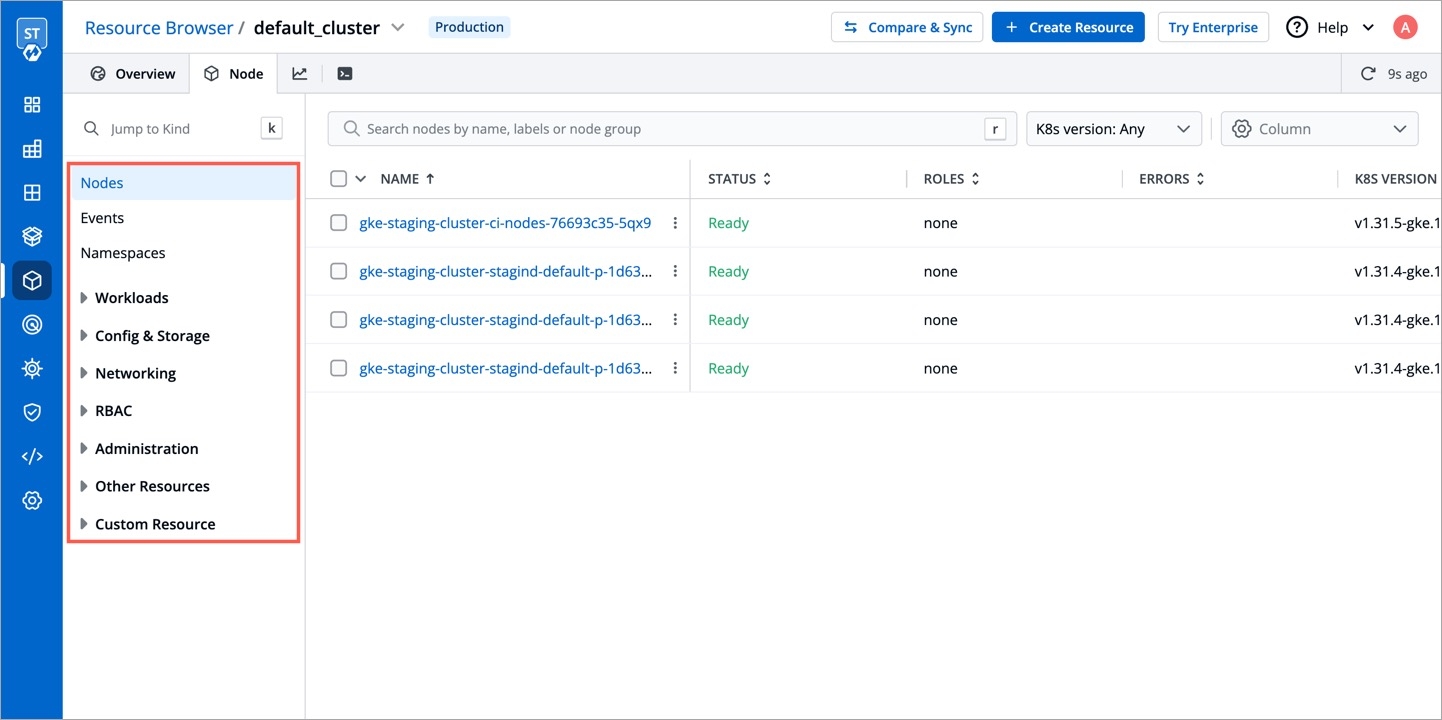
You may click a cluster to view and manage all its resources as shown below.
This shows the combined CPU and memory consumption of all running pods in the cluster.
CPU Usage
Percentage of CPU resources currently being used across all the pods in the cluster.
CPU Capacity
Total amount of CPU resources available across all the nodes in the cluster. Measured in millicores (m).
CPU Requests
Total amount of CPU resources requested by all the pods in the cluster.
CPU Limits
Maximum amount of CPU resources that a total number of pods can use in the cluster.
Memory Usage
Percentage of memory resources currently being used across all the pods in the cluster.
Memory Capacity
Total amount of memory resources available across all the nodes in the cluster. Measured in Megabytes (Mi).
Memory Requests
Total amount of memory resources requested by all the pods in the cluster.
Memory Limits
Maximum amount of memory resources that a total number of pods can use in the cluster.
This shows errors in the cluster. If no error is present in the cluster, Resource Browser will not display this section.
Users need to have super-admin permission to edit the catalog framework.
You can also include additional information about your cluster using the Markdown editor.
You can use the searchbox to browse the resources.
You can delete an unwanted resource if it is orphaned and no longer required by your applications.
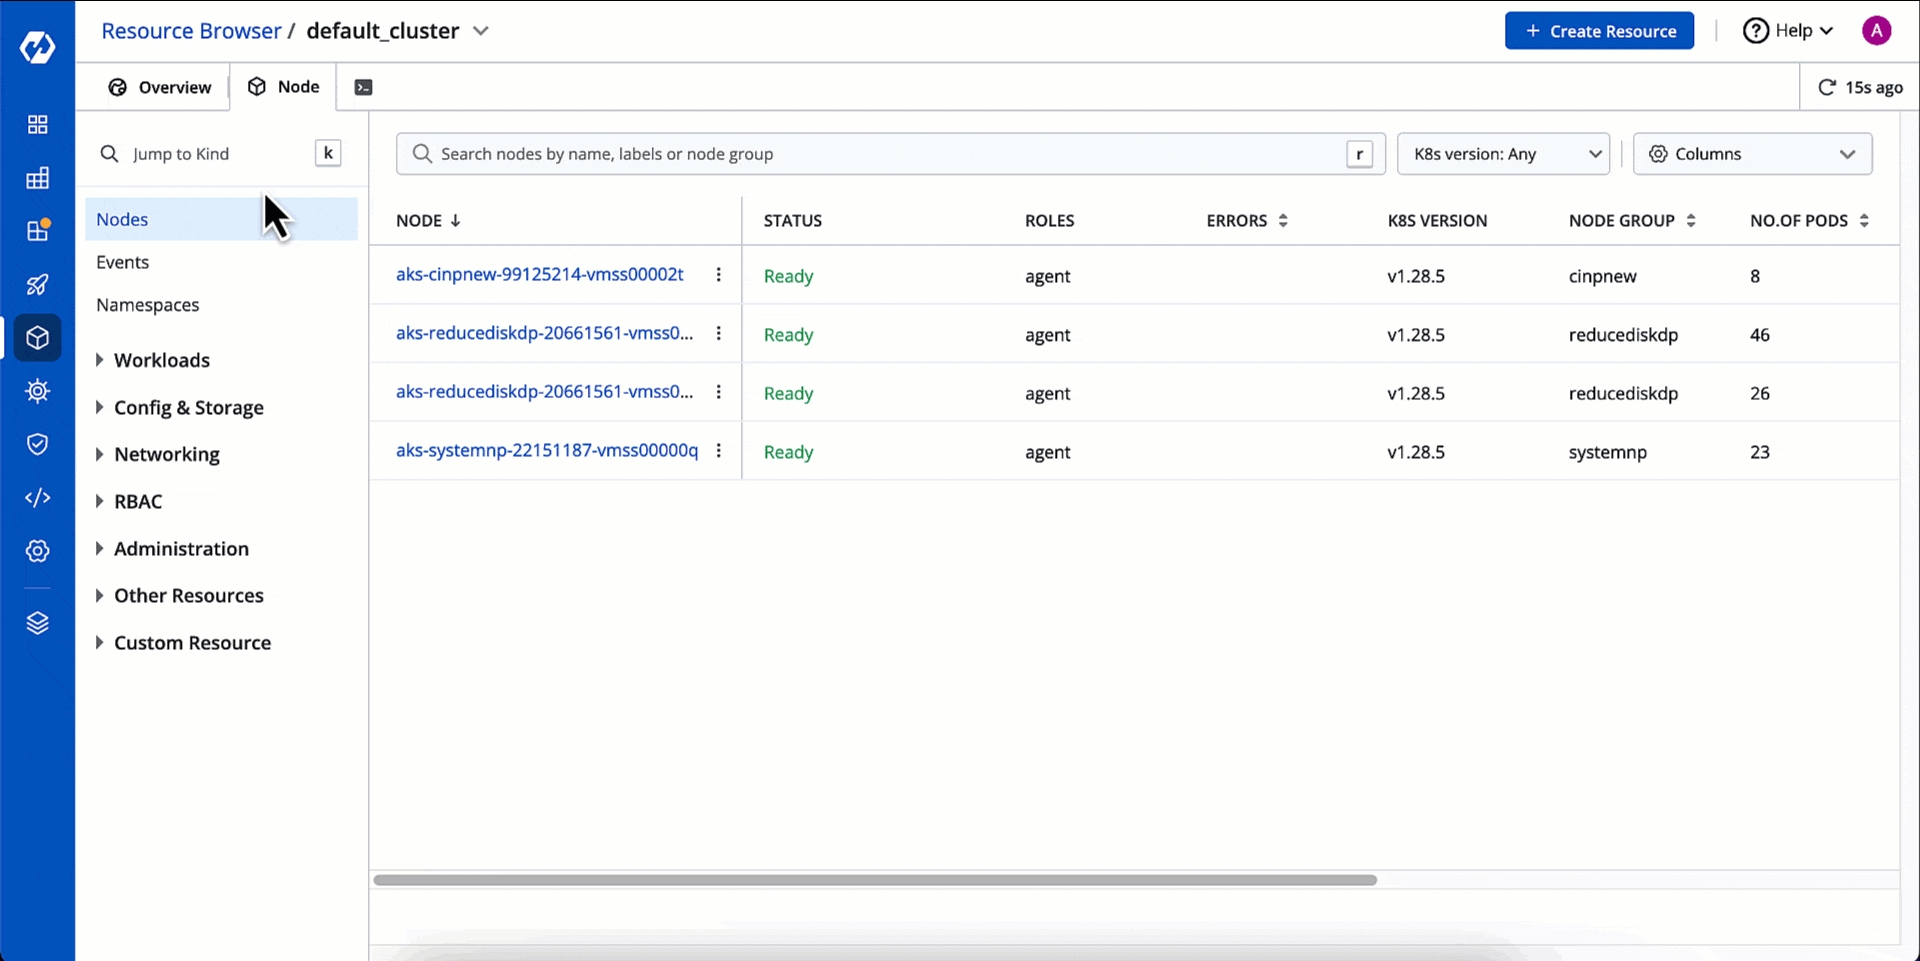
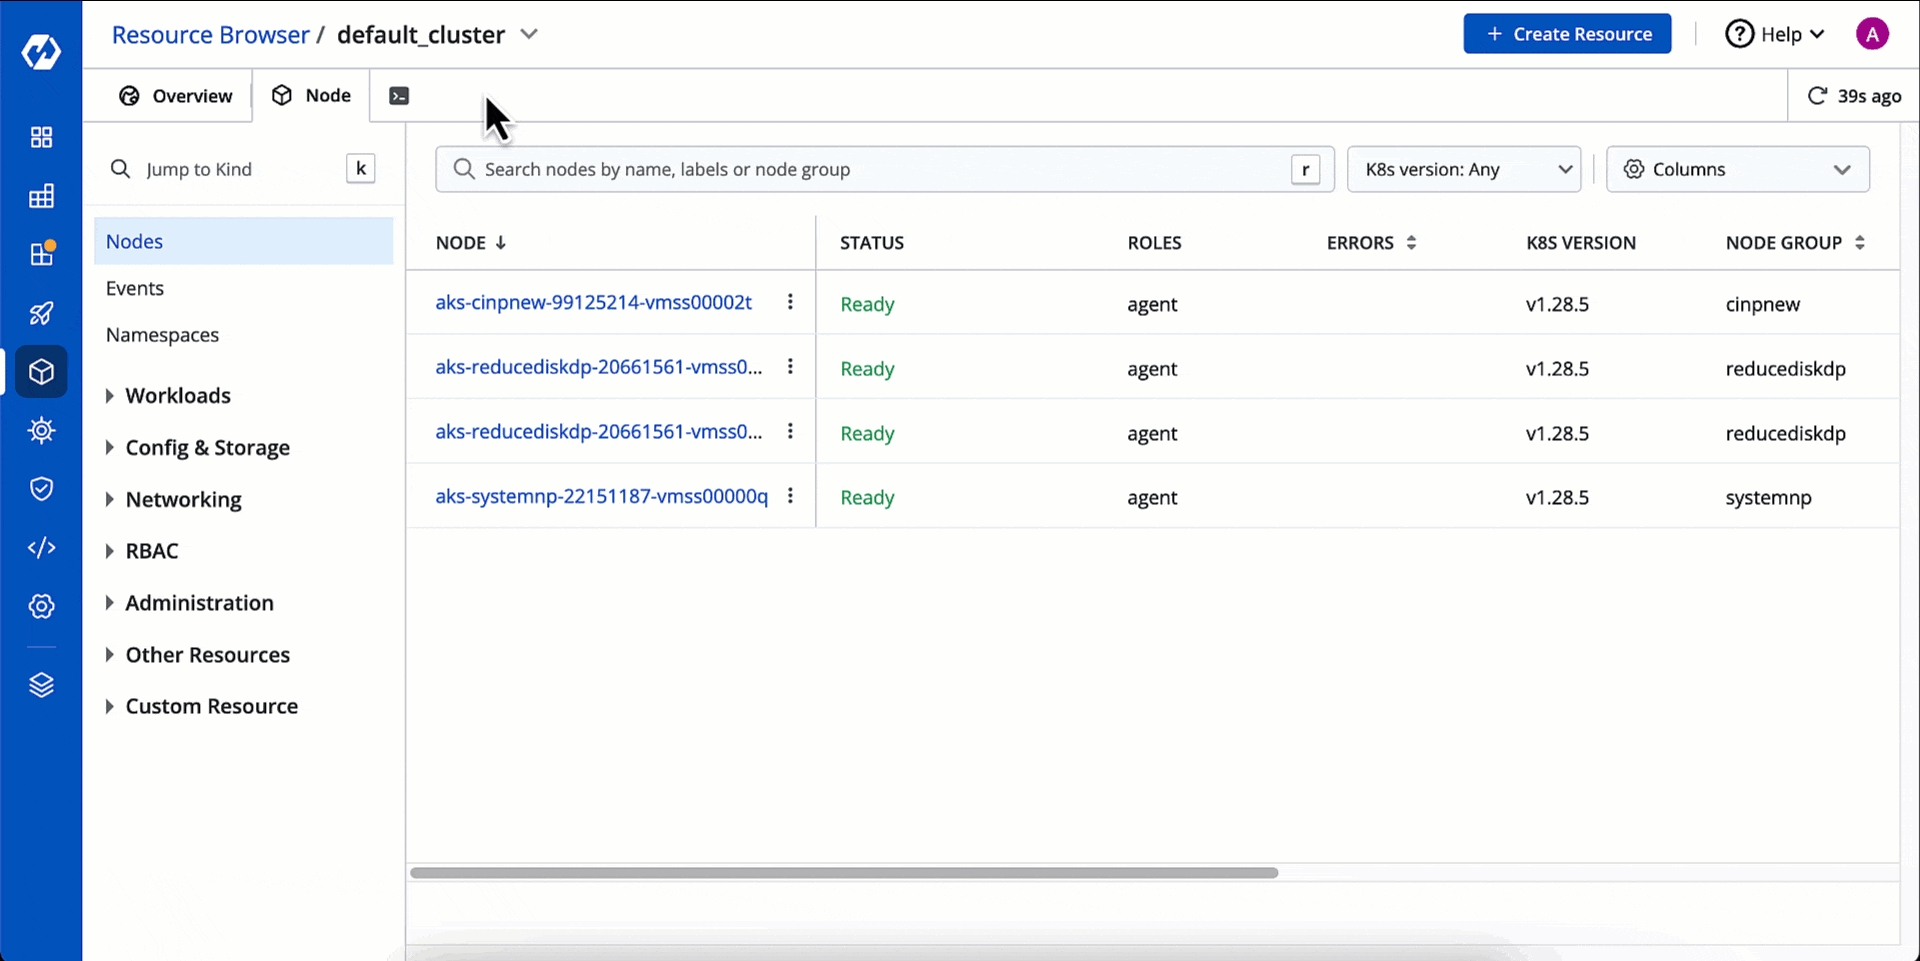
You can see the list of nodes available in your cluster. Typically you have several nodes in a cluster; in a learning or resource-limited environment, you might have only one node.
The components on a typical node include the kubelet, a container runtime, and the kube-proxy.
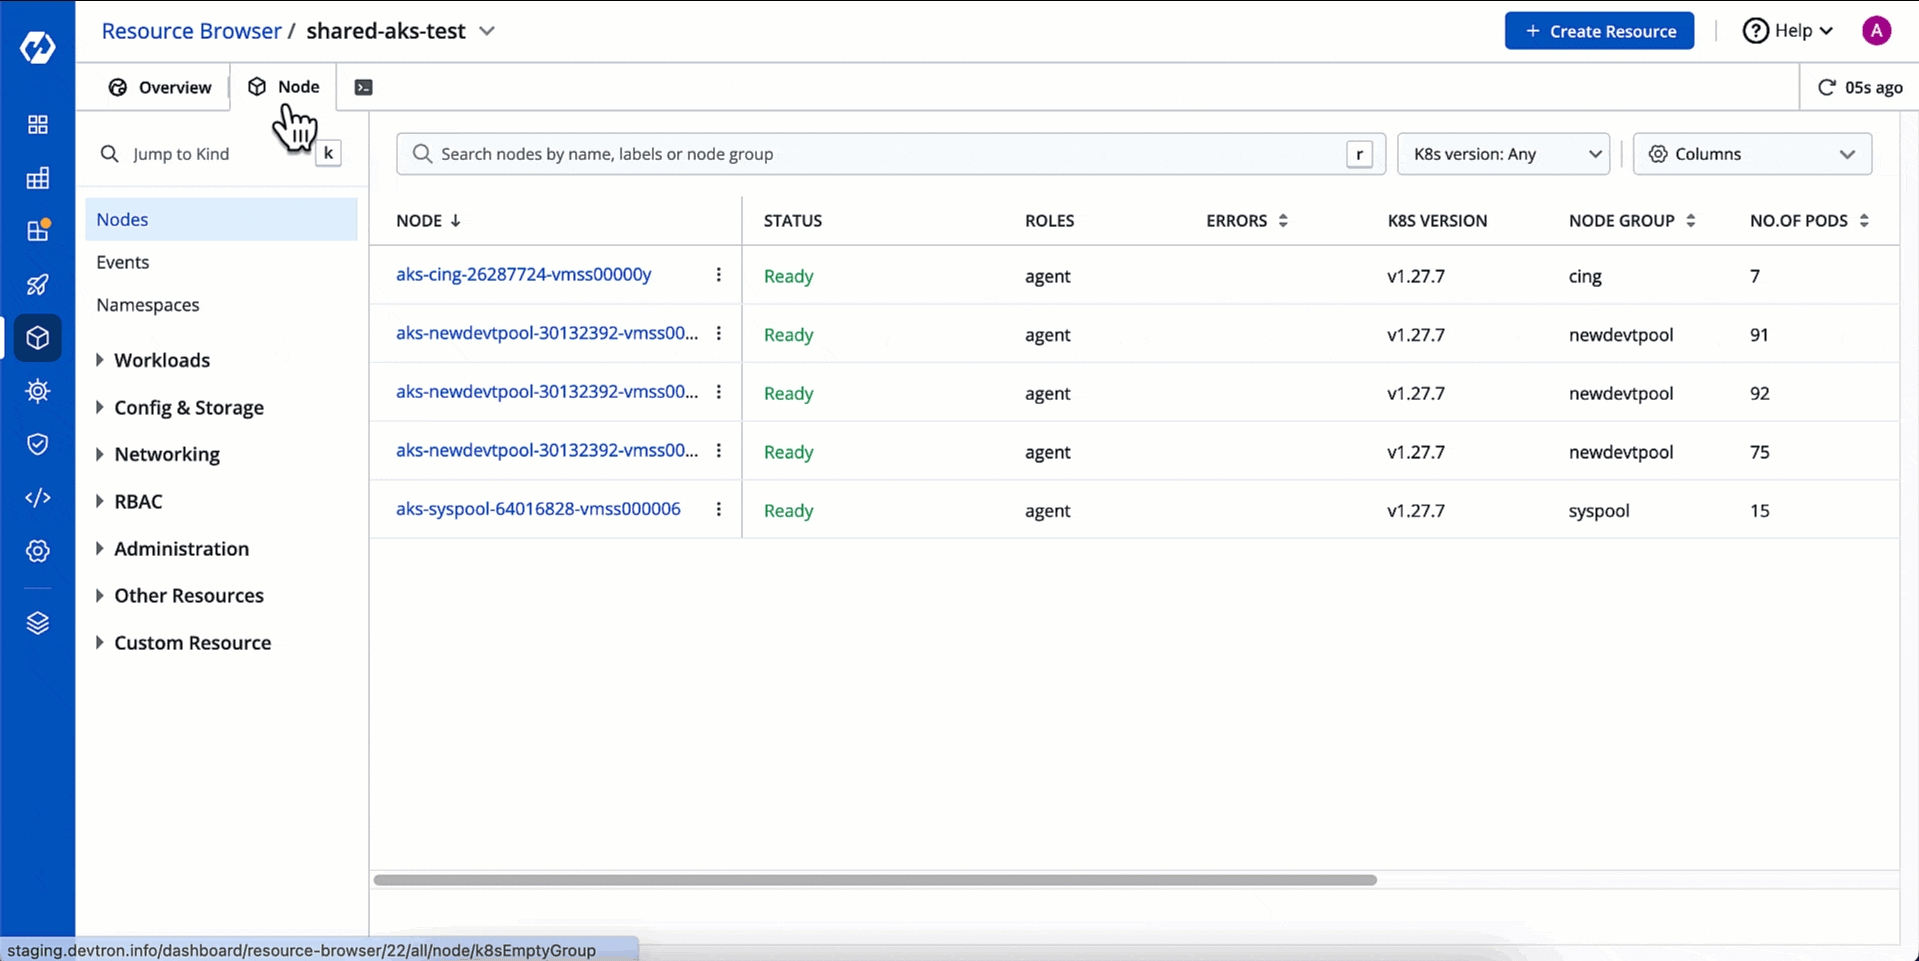
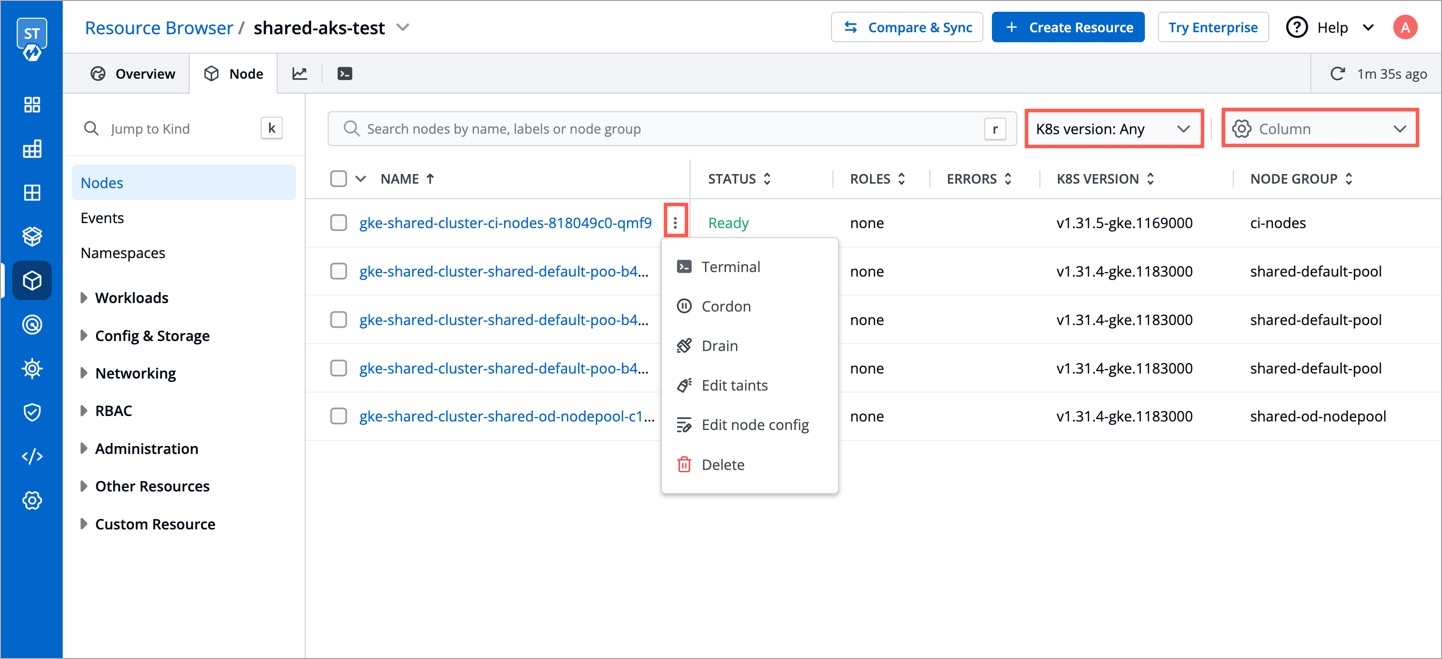
If you have multiple nodes, you can search a node by name or label in the search bar. The search result will display the following information about the node. To display a parameter of a node, use Columns on the right side, select the parameter to display from the drop-down list, and click Apply.
Node
Alphanumeric name of the node
Status
Status of a node. It can be either Ready or Not Ready.
Roles
Shows the roles of a node, e.g., agent
Errors
Shows the number of errors in nodes (if any)
K8s Version
Shows the version of Kubernetes cluster
Node Group
Shows which collection of worker nodes it belongs to
No. of Pods
Shows the total number of pods present in the node
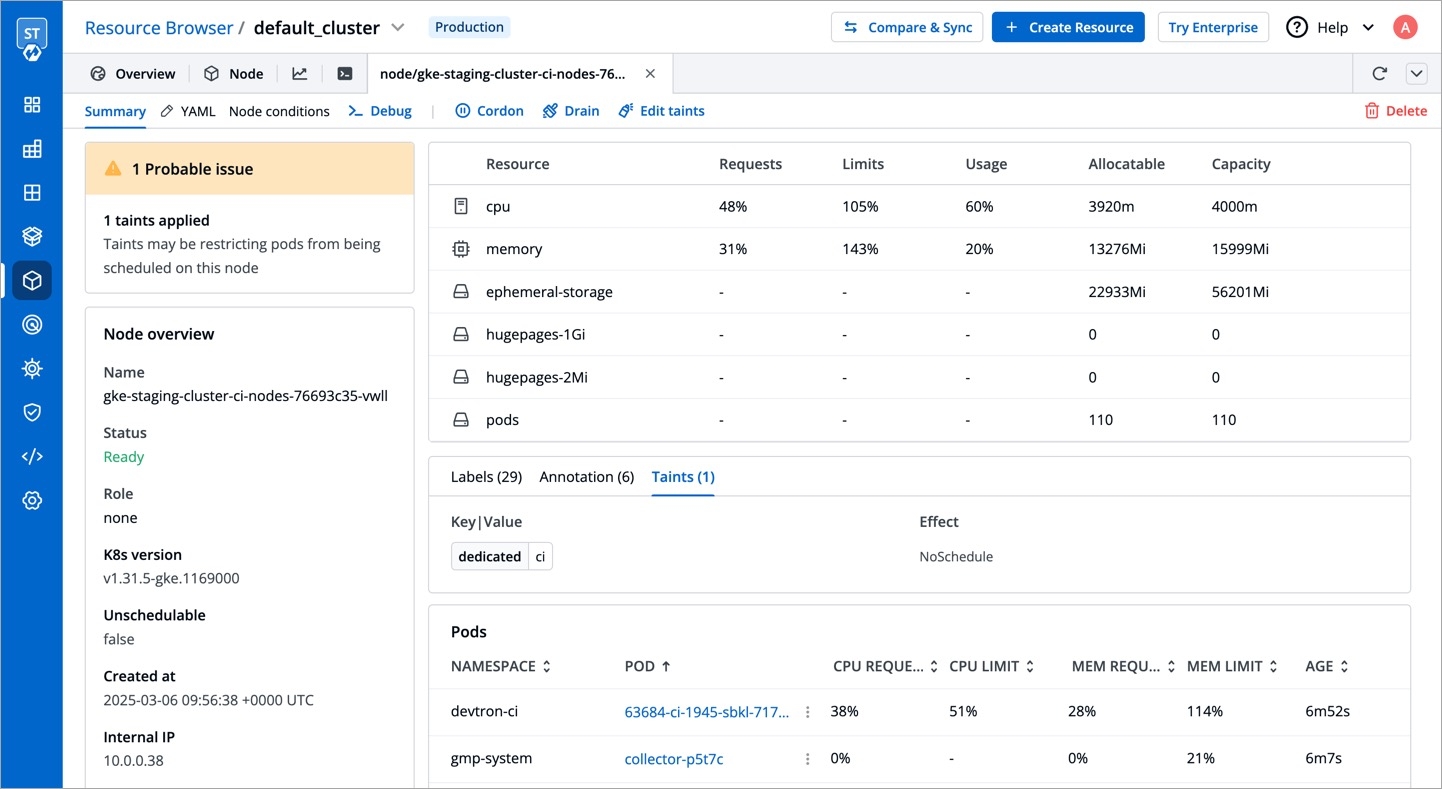
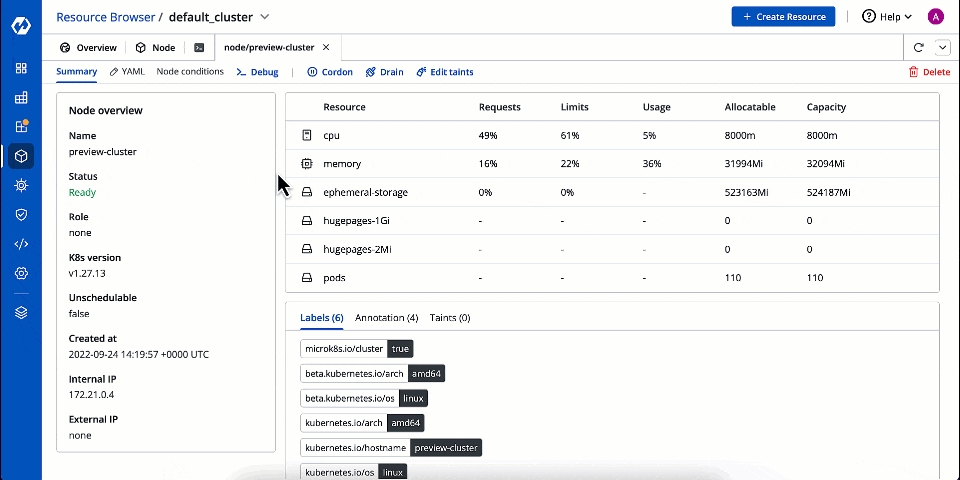
Clicking on a node shows you a number of details such as:
CPU Usage and Memory Usage of Node
CPU Usage and Memory Usage of Each Pod
Number of Pods in the Node
List of Pods
Age of Pods
Labels, Annotations, and Taints
Node IP
Further using the Devtron UI, you will be able to:
Your applications run on pods, and pods run on nodes. But sometimes, Kubernetes scheduler cannot deploy a pod on a node for several reasons, e.g., node is not ready, node is not reachable, network is unavailable, etc. In such cases, node operations help you manage the nodes better.
Click Debug.
Debug a node by selecting the terminal shell, i.e., bash or sh.
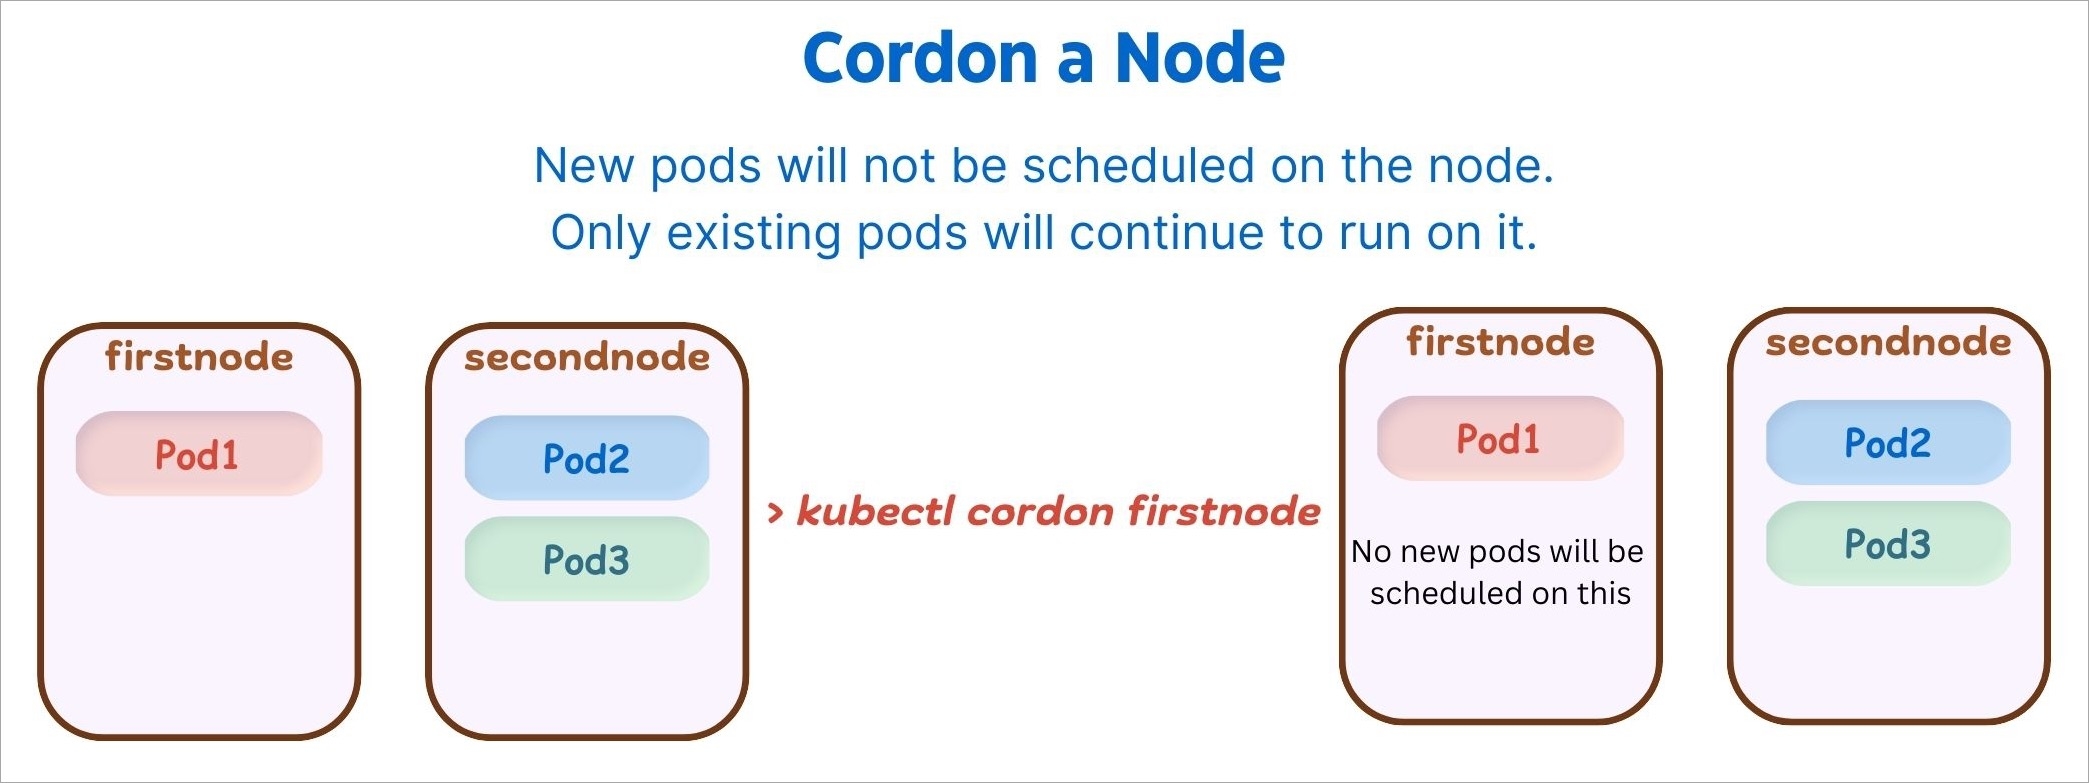
Click Cordon.
A confirmation dialog box will appear, click Cordon Node to proceed.
The status of the node shows SchedulingDisabled with Unschedulable parameter set as true.
Similarly, you can uncordon a node by clicking Uncordon. After a node is uncordoned, new pods can be scheduled on the node.
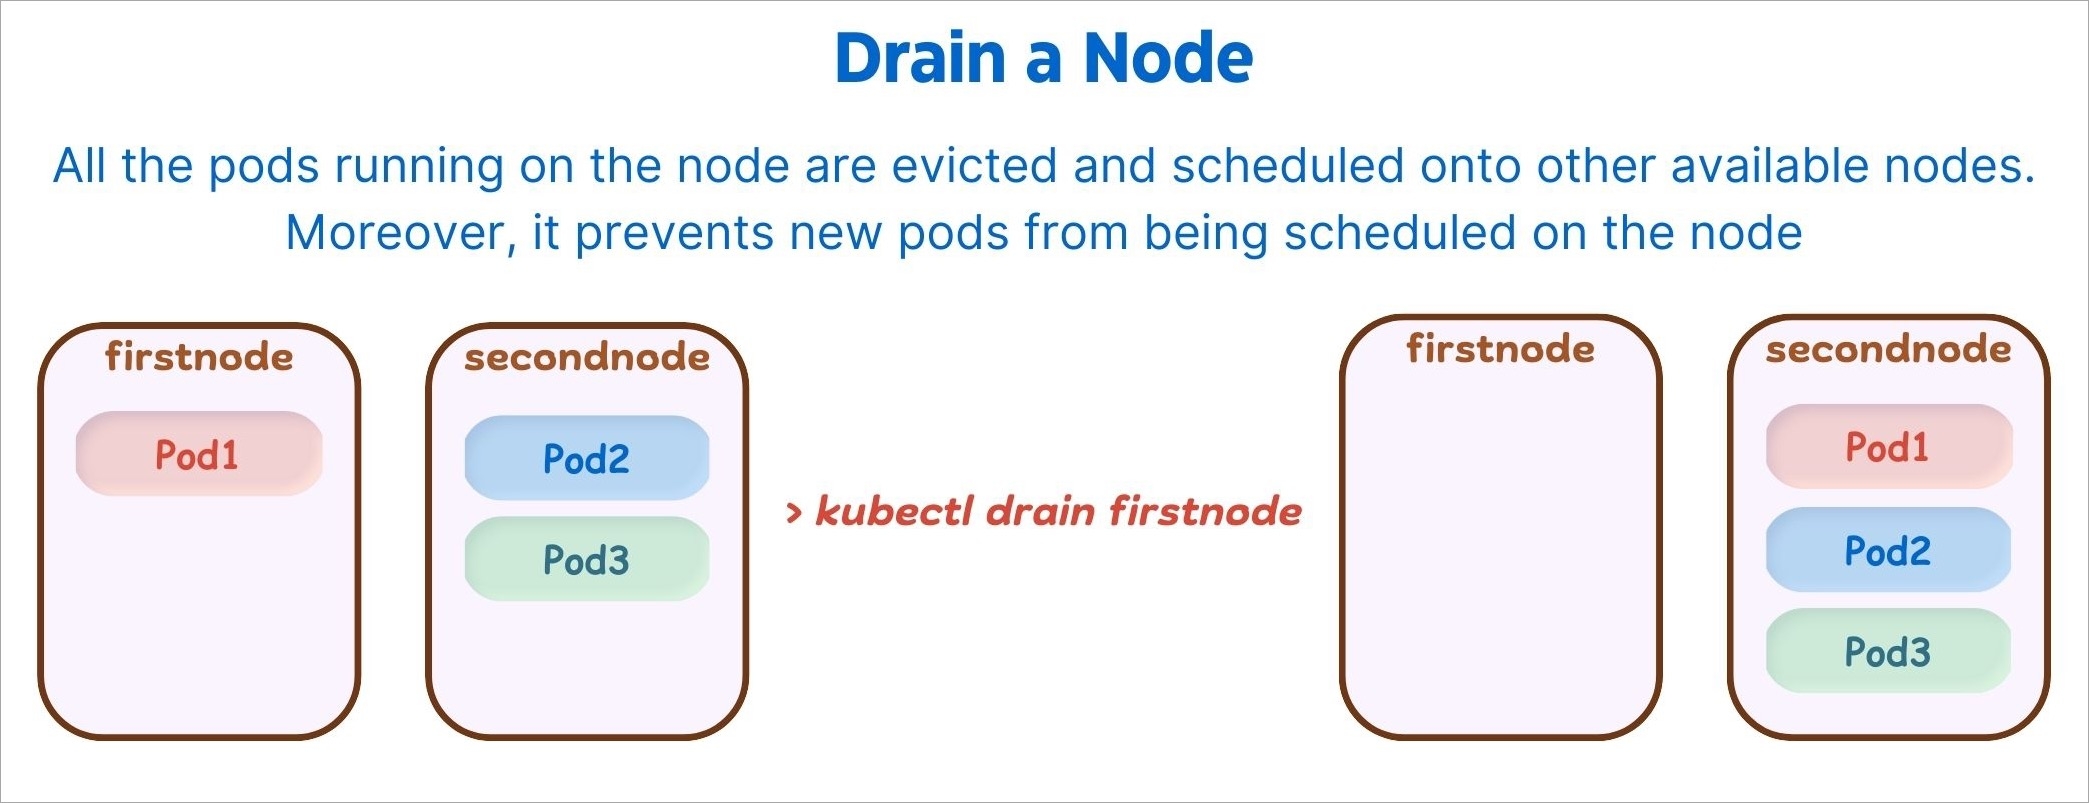
After the node is drained, all pods (including those managed by DaemonSets) in the node will be automatically drained to other nodes in the cluster, and the drained node will be set to cordoned status.
Click Drain.
A confirmation dialog box will appear, click Drain Node to proceed.
You can also select from the following conditions before draining a node:
Grace Period
Period of time in seconds given to each pod to terminate gracefully. If negative, the default value specified in the pod will be used.
Delete empty directory data
Enabling this field will delete the pods using empty directory data when the node is drained.
Disable eviction (use with caution)
Enabling this field will force drain to use delete, even if eviction is supported. This will bypass checking PodDisruptionBudgets.
Note: Make sure to use with caution.
Force drain
Enabling this field will force drain a node even if there are pods that do not declare a controller.
Ignore DaemonSets
Enabling this field will ignore DaemonSet-managed pods.
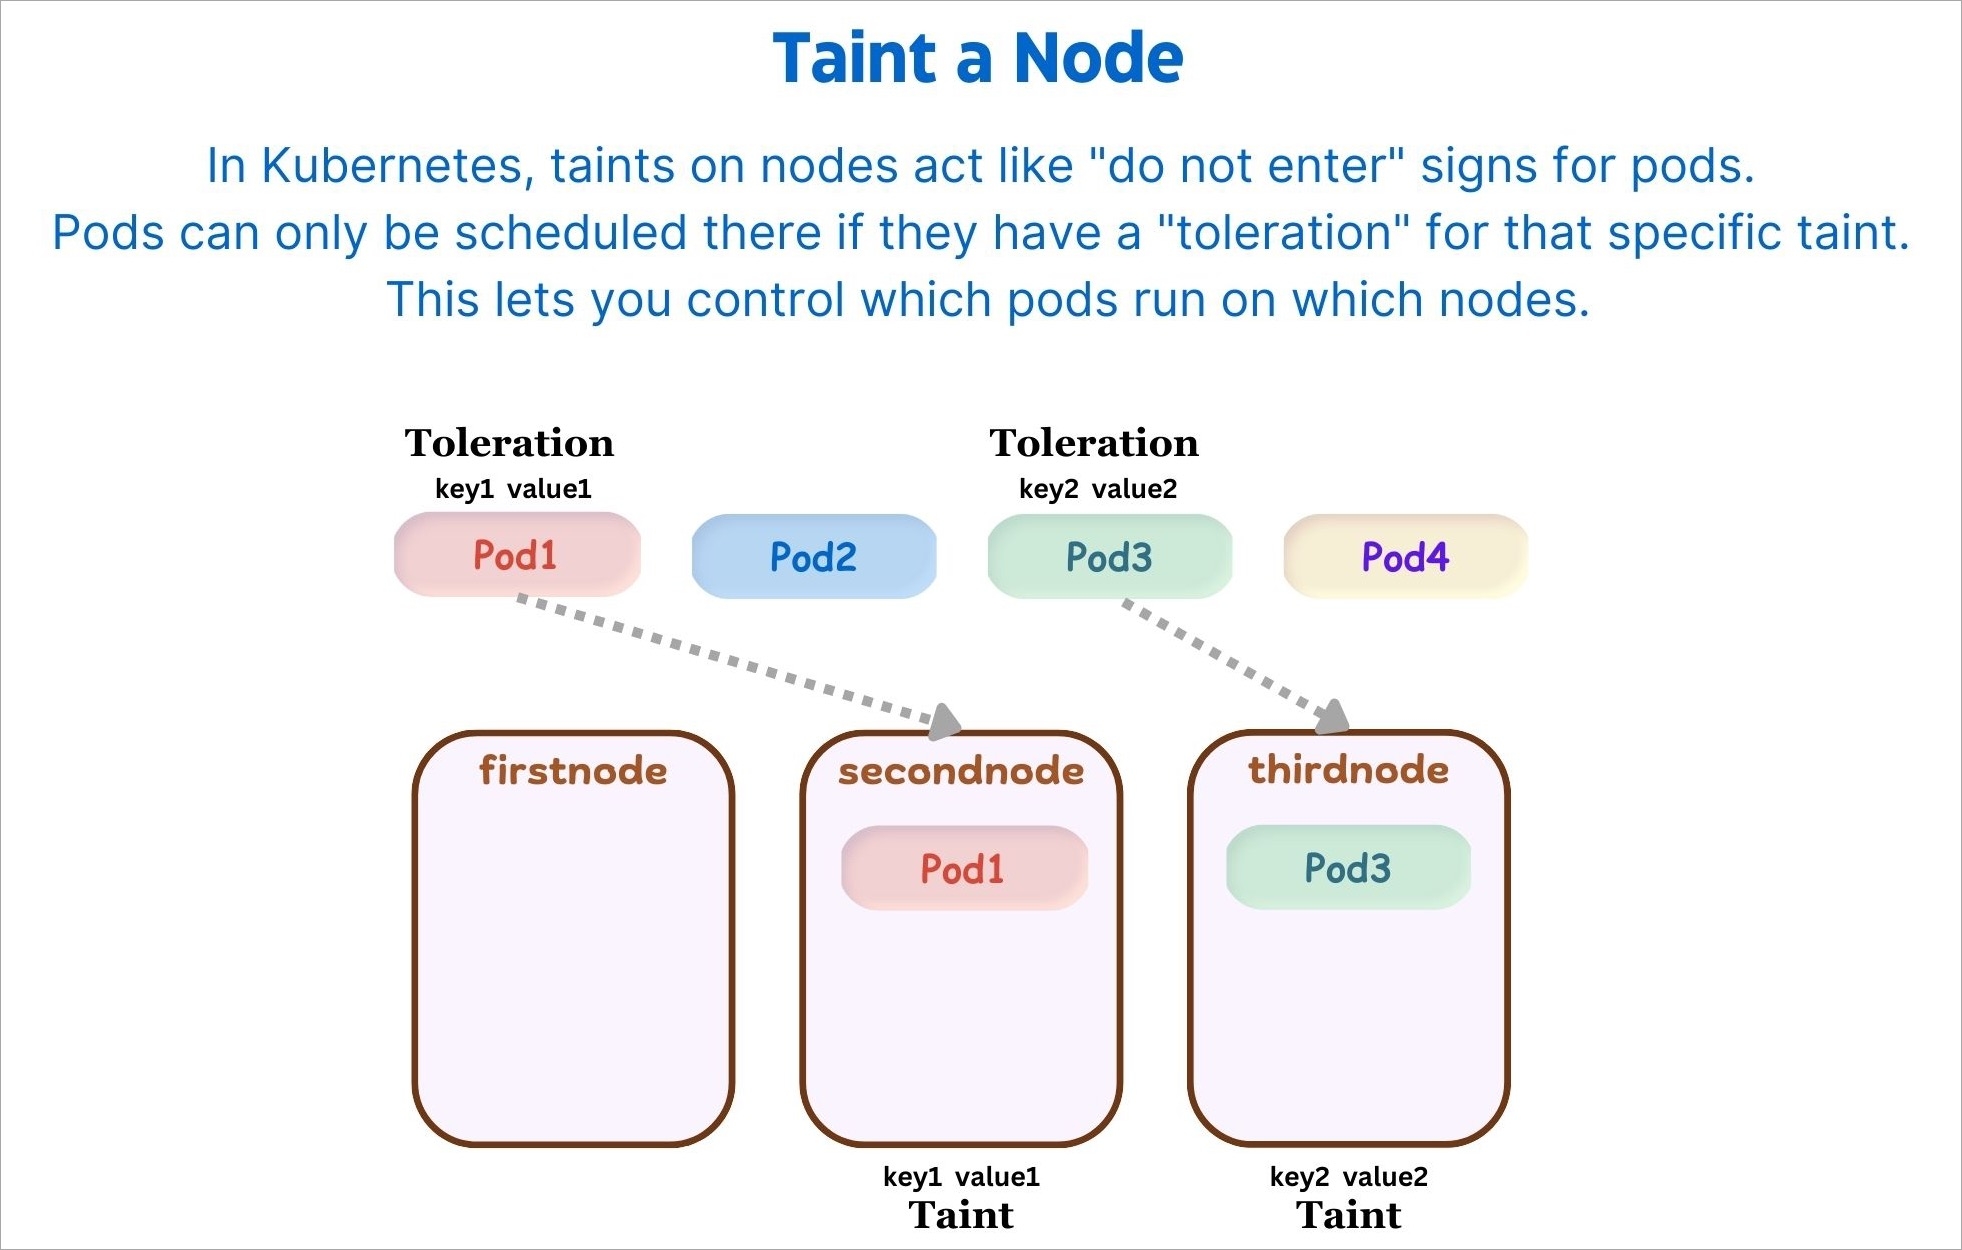
Taints are key:value pairs associated with effect. After you add taints to nodes, you can set tolerations on a pod to allow the pod to be scheduled to nodes with certain taints. When you taint a node, it will repel all the pods except those that have a toleration for that taint. A node can have one or many taints associated with it.
Note: Make sure to check taint validations before you add a taint.
Click Edit taints.
Click Save.
You can also add more taints using + Add taint button, or delete the existing taint by using the delete icon.
This allows you to directly edit any node. It will open the editor which contains all the configuration settings in which the default format is YAML. You can edit multiple objects, although changes are applied one at a time.
Go to the YAML tab and click Edit YAML.
Make the changes using the editor.
Click Review & Save changes to compare the changes in the YAML file.
Click Apply changes to confirm.
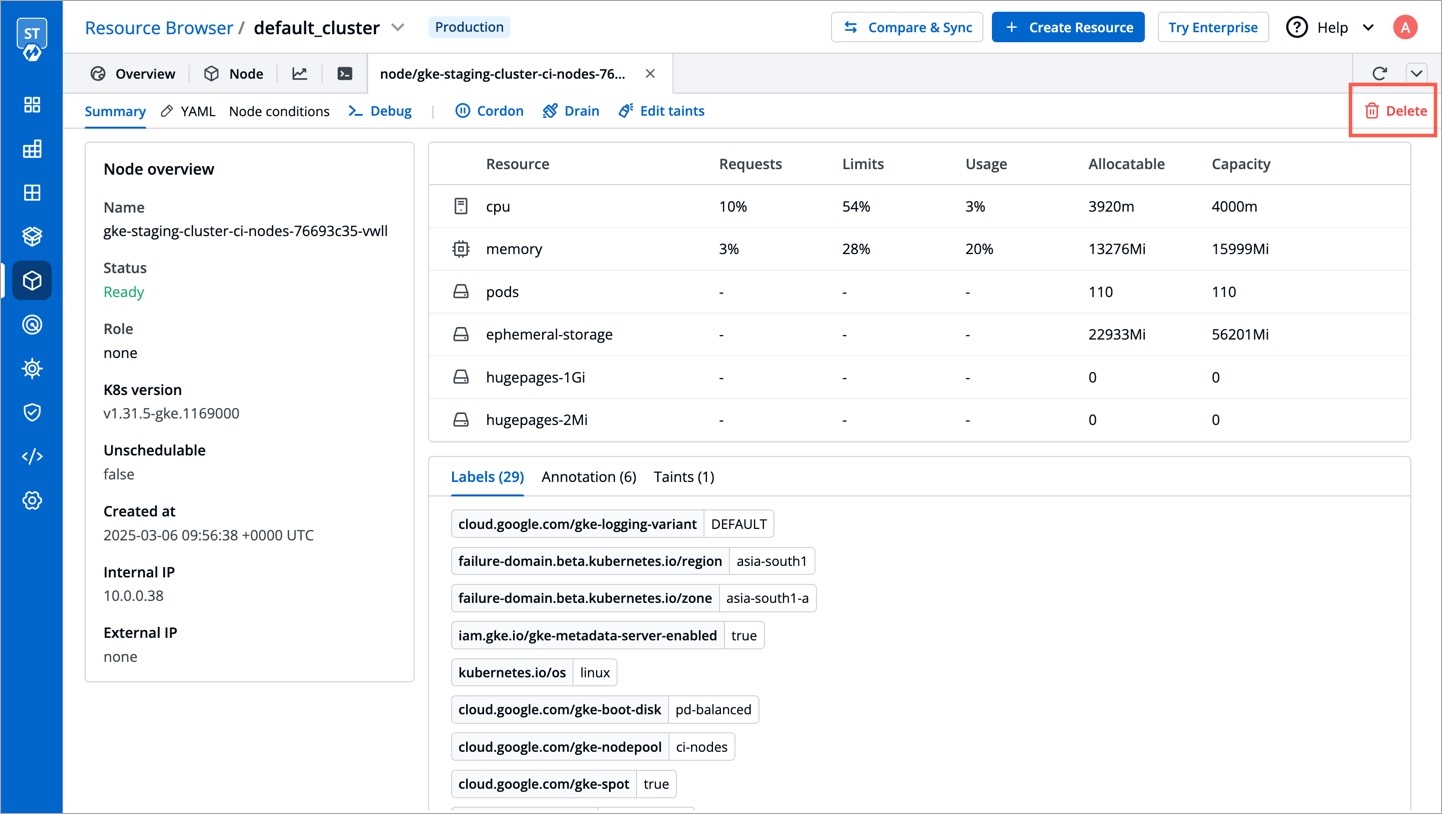
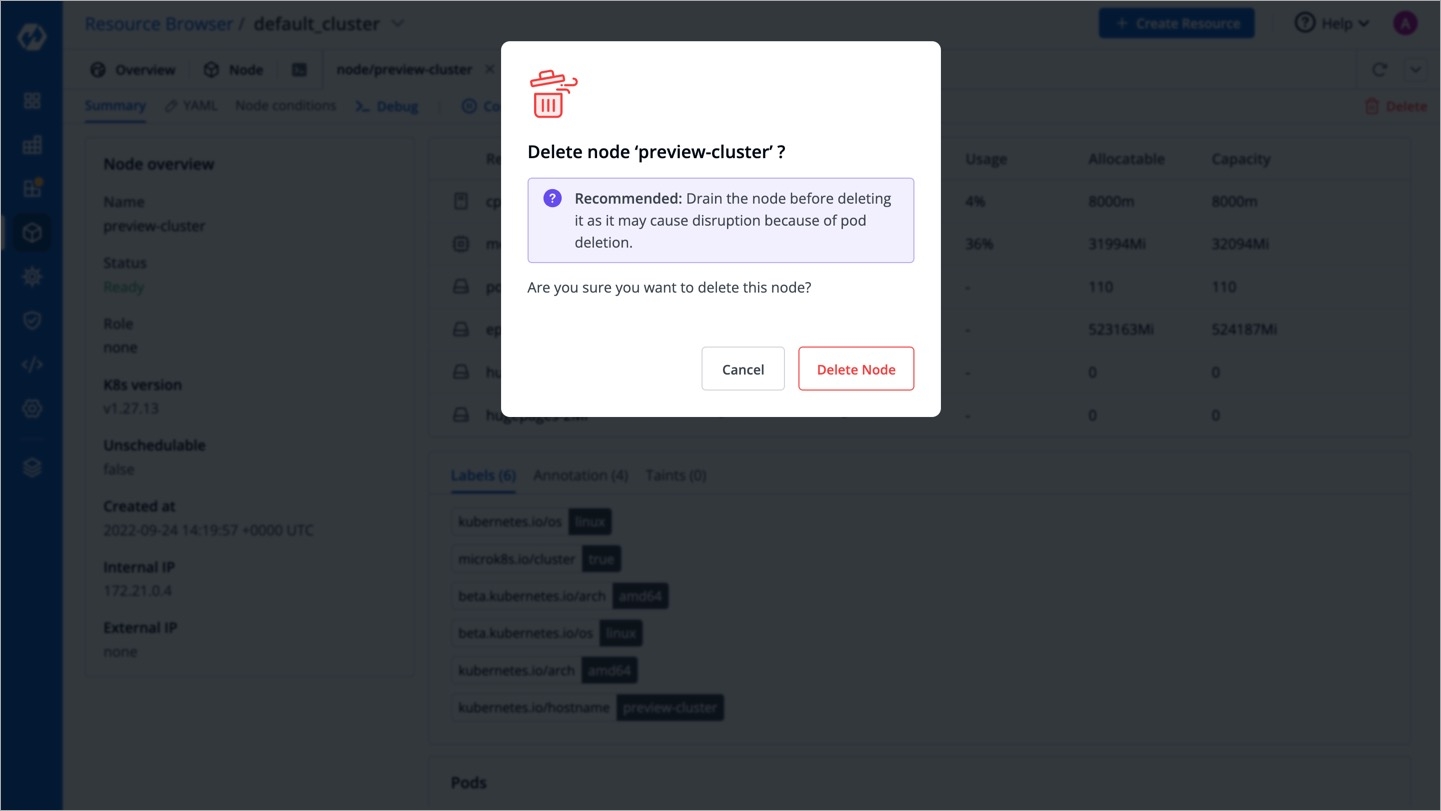
You can also delete a node by clicking the Delete button present on the right-hand side.
The node will be deleted from the cluster.
Examining your cluster's pods helps you understand the health of your application. By inspecting pod logs, you can check the performance and identify if there are any failures. This is especially useful for debugging any issues effectively.
Moreover, you can download the pod logs for ease of sharing and troubleshooting as shown in the below video.
Frequent pod restarts can impact your application as it might lead to unexpected downtimes. In such cases, it is important to determine the root cause and take actions (both preventive and corrective) if needed.
In case any of your pod restarts, you can view its details from the pod listing screen:
Last pod restart event, along with the timestamp and message
Reason behind restart
Container log before restart
Node status and events
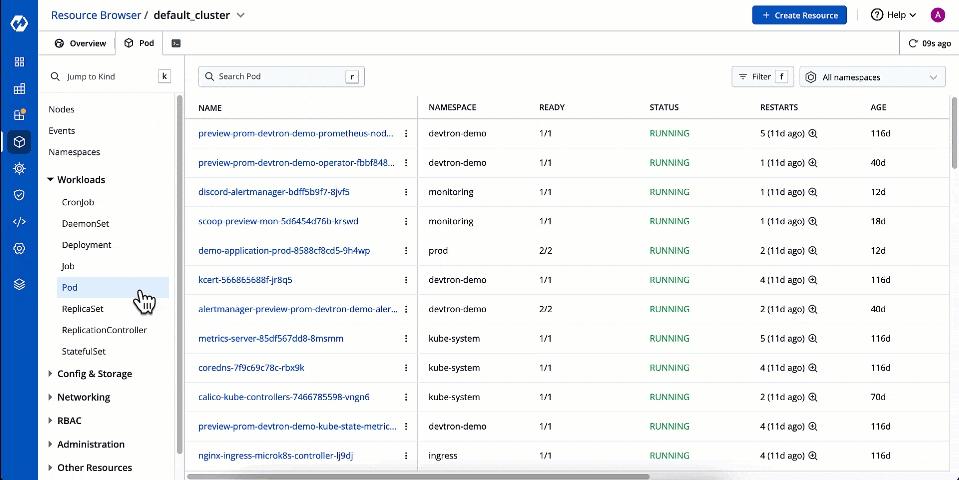
In the Resource Browser, select Pod within Workloads.
Use the searchbar to find and locate the pod you wish to debug. Click the pod.
Go to the Terminal tab
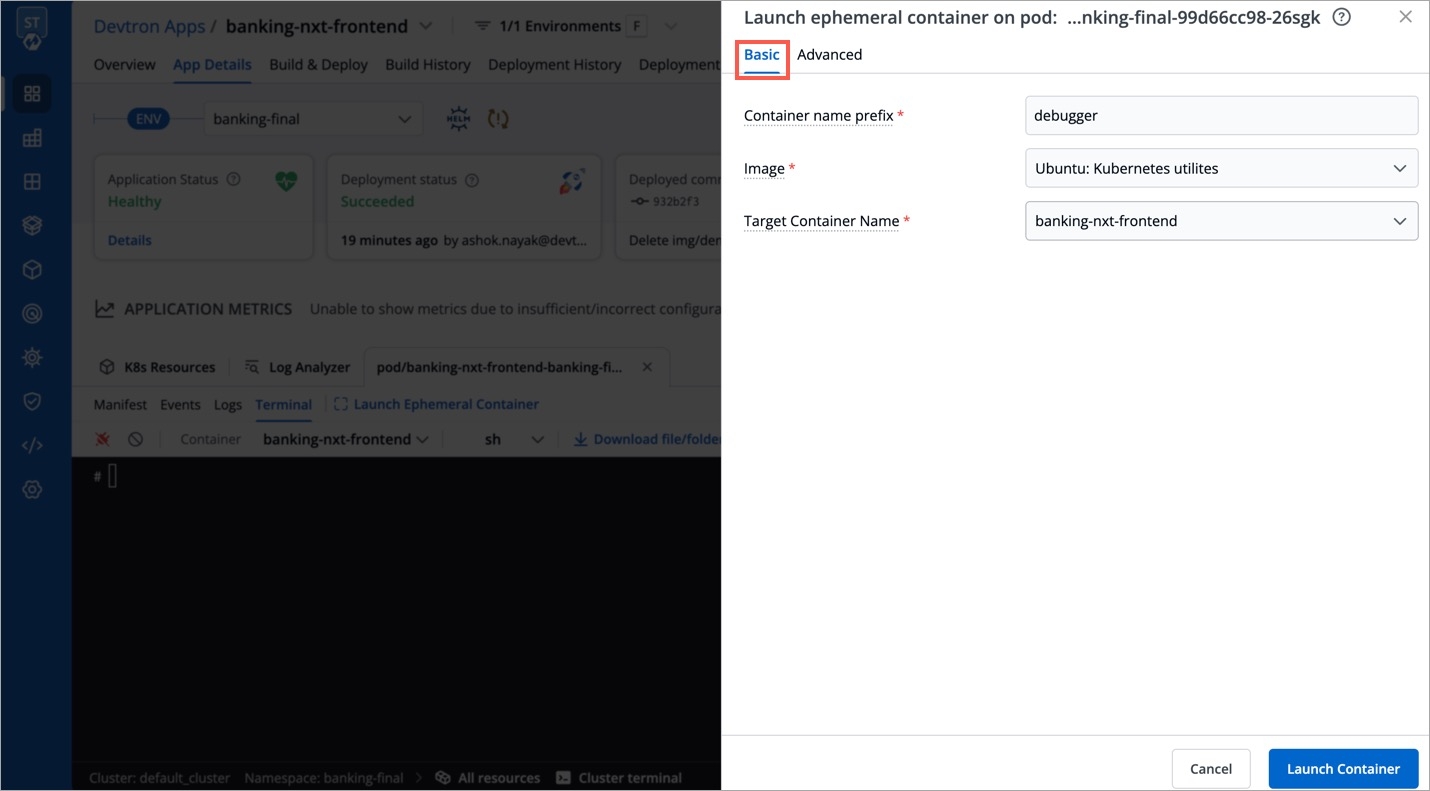
Click Launch Ephemeral Container as shown below.
You get 2 tabs:
Basic - It provides the bare minimum configurations required to launch an ephemeral container.
It contains 3 mandatory fields:
Container name prefix - Type a prefix to give to your ephemeral container, for e.g., debug. Your container name would look like debug-jndvs.
Image - Choose an image to run from the dropdown. Ephemeral containers need an image to run and provide the capability to debug, such as curl. You can use a custom image too.
Target Container name - Since a pod can have one or more containers, choose a target container you wish to debug, from the dropdown.
Other resources in the cluster are grouped under the following categories:
Namespace
Workloads
Config & Storage
Networking
RBAC
Administration
Other Resources
Custom Resource
To troubleshoot a cluster or a specific node in a cluster, click the terminal icon on the right side.
You will see the user-defined name for the cluster in Devtron. E.g. default-cluster.
Select the node you wish to troubleshoot from the Node drop-down. E.g. demo-new.
Select the image from the drop-down list which includes all CLI utilities or you can use a custom image, which is publicly available.
Select the terminal shell from the drop-down list (e.g. sh, bash) to troubleshoot a node.
You can also create a pod for debugging which will connect to the pod terminal. To find out why a particular pod is not running, you can check Pod Events and Pod Manifest for details.
The Auto select option automatically selects a node from a list of nodes and then creates a pod. Alternatively, you can choose a node of your choice from the same dropdown for debugging.
The Debug Mode is helpful in scenarios where you can't access your node by using an SSH connection. Enabling this feature opens an interactive shell directly on the node. This shell provides unrestricted access to the node, giving you enhanced debugging capabilities.
Check the current state of the pod and recent events with the following command:
To know more information about each of these pods and to debug a pod depending on the state of the pods, run the following command:
Once you select a cluster in Resource Browser, click + Create Resource, and add the resource definition.
In the below example, we have created a simple pod named nginx:
Here's one more example that shows the required fields and object specifications for a Kubernetes Deployment:
But first, you would need access to that cluster. Traditionally, the kubeconfig file (./kube/config) helps you connect with the cluster.
Kubeconfig becomes painstakingly difficult to maintain especially when it comes to:
Granting or revoking access to the cluster for multiple people
Changing the permissions and subsequently the access token
Adding/Updating/Deleting the entries of cluster URLs and tokens
Keeping a record of multiple kubeconfig files
Devtron helps in reducing the challenges and simplifying the maintenance of kubeconfig file through:
Devtron's Proxy URL for Cluster - A standardized URL that you can use in place of your Kubernetes cluster URL.
If you are not a super-admin and can't generate a token yourself, you can find the session token (argocd.token) using the Developer Tools available in your web browser as shown below.
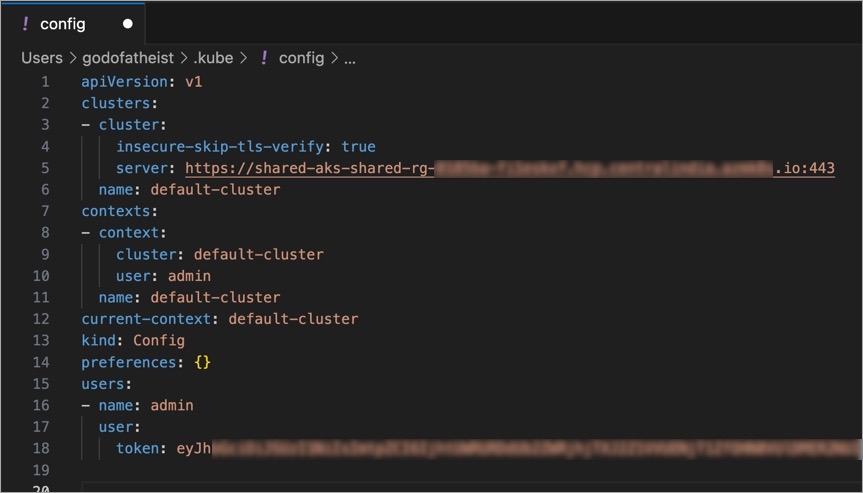
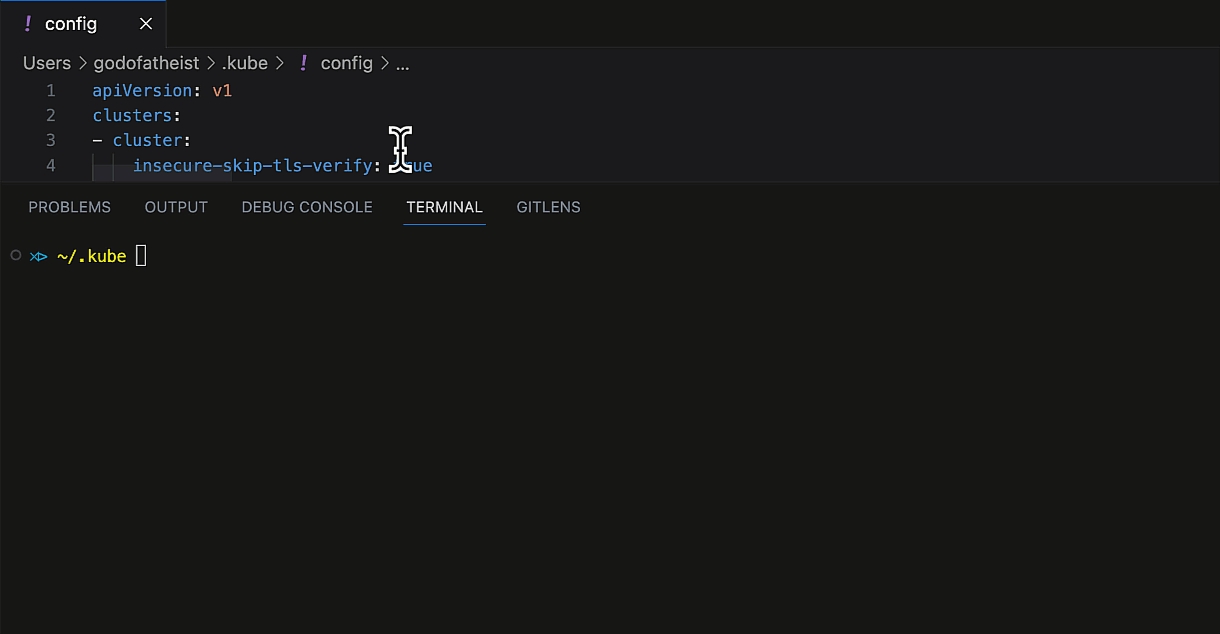
Go to ~/.kube folder on your local machine and open the config file. Or you may create one with the following content:
Edit the following placeholders in the server field and the token field:
<devtron_host_name>
Hostname of the Devtron server
demo.devtron.ai
<cluster_name>
Name of the cluster (or cluster ID)
devtron-cluster
<devtron_token>
API token or session token
-
Test the connection to the cluster by running any kubectl command, e.g., kubectl get ns or kubectl get po -A
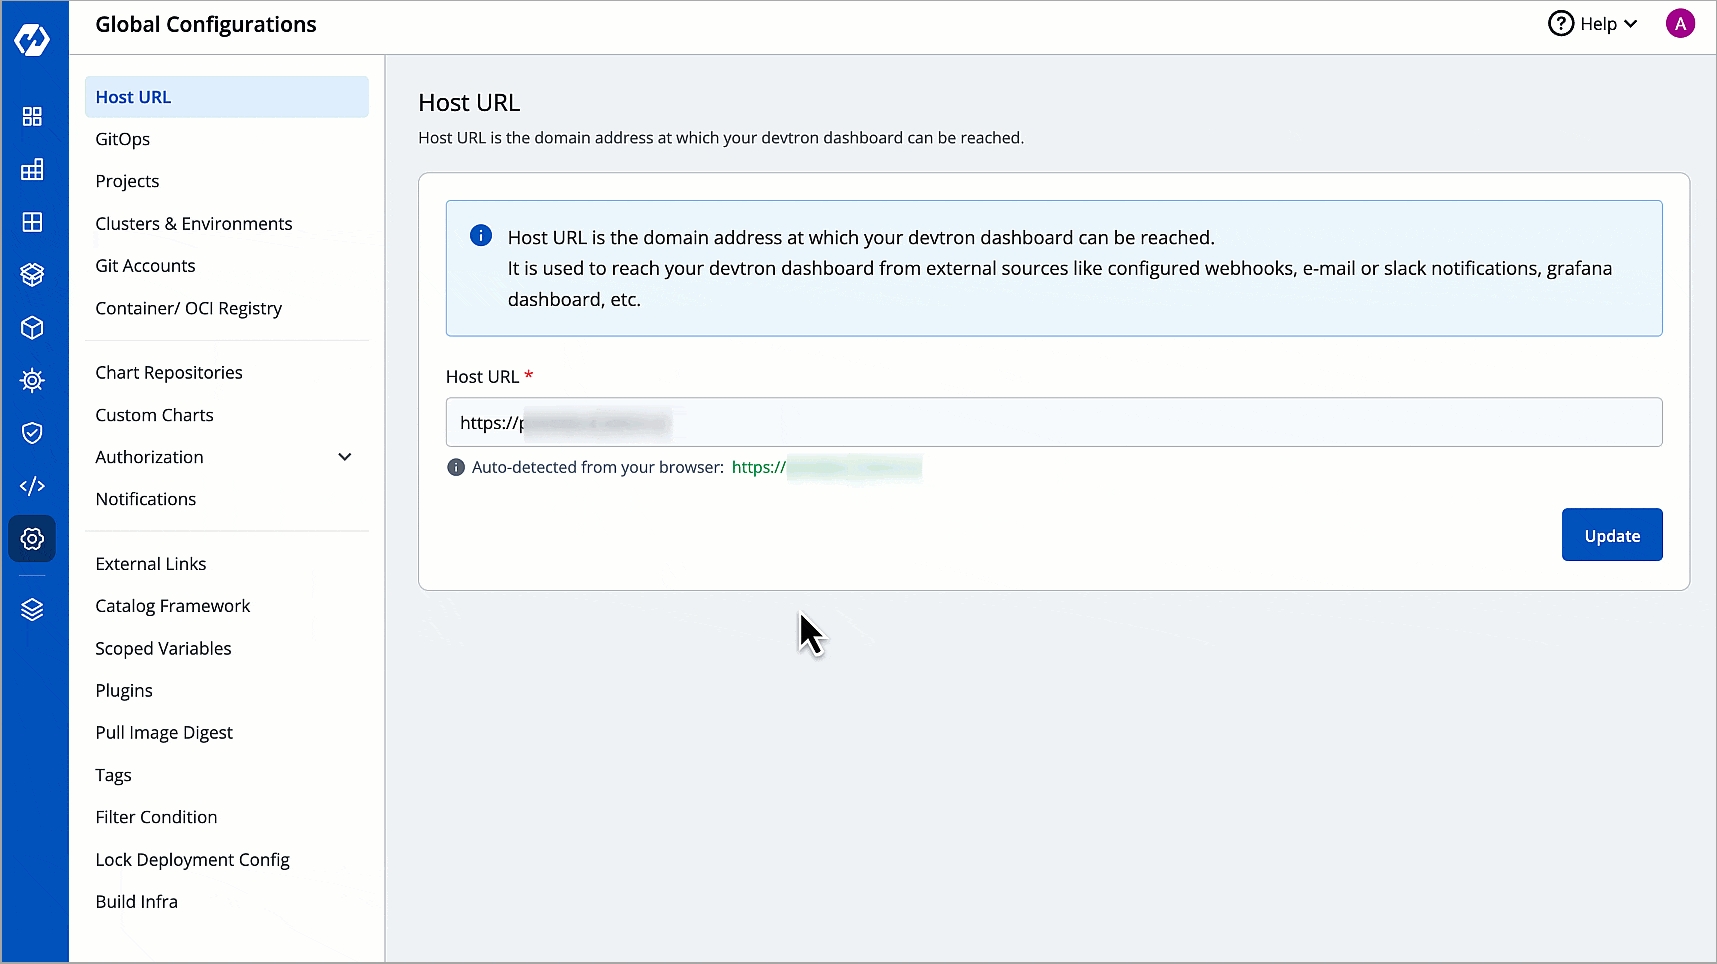
You can easily connect more clusters by clicking the Add Cluster button located at the top of the browser. This will take you to the configuration within .
Based on the schema provided in the catalog framework, you can add relevant details for each cluster. Refer for more details.
Users need to have to discover resources.
Moreover, you can use filters that allow you to quickly filter your workload as per labels, field selectors, or as shown below.
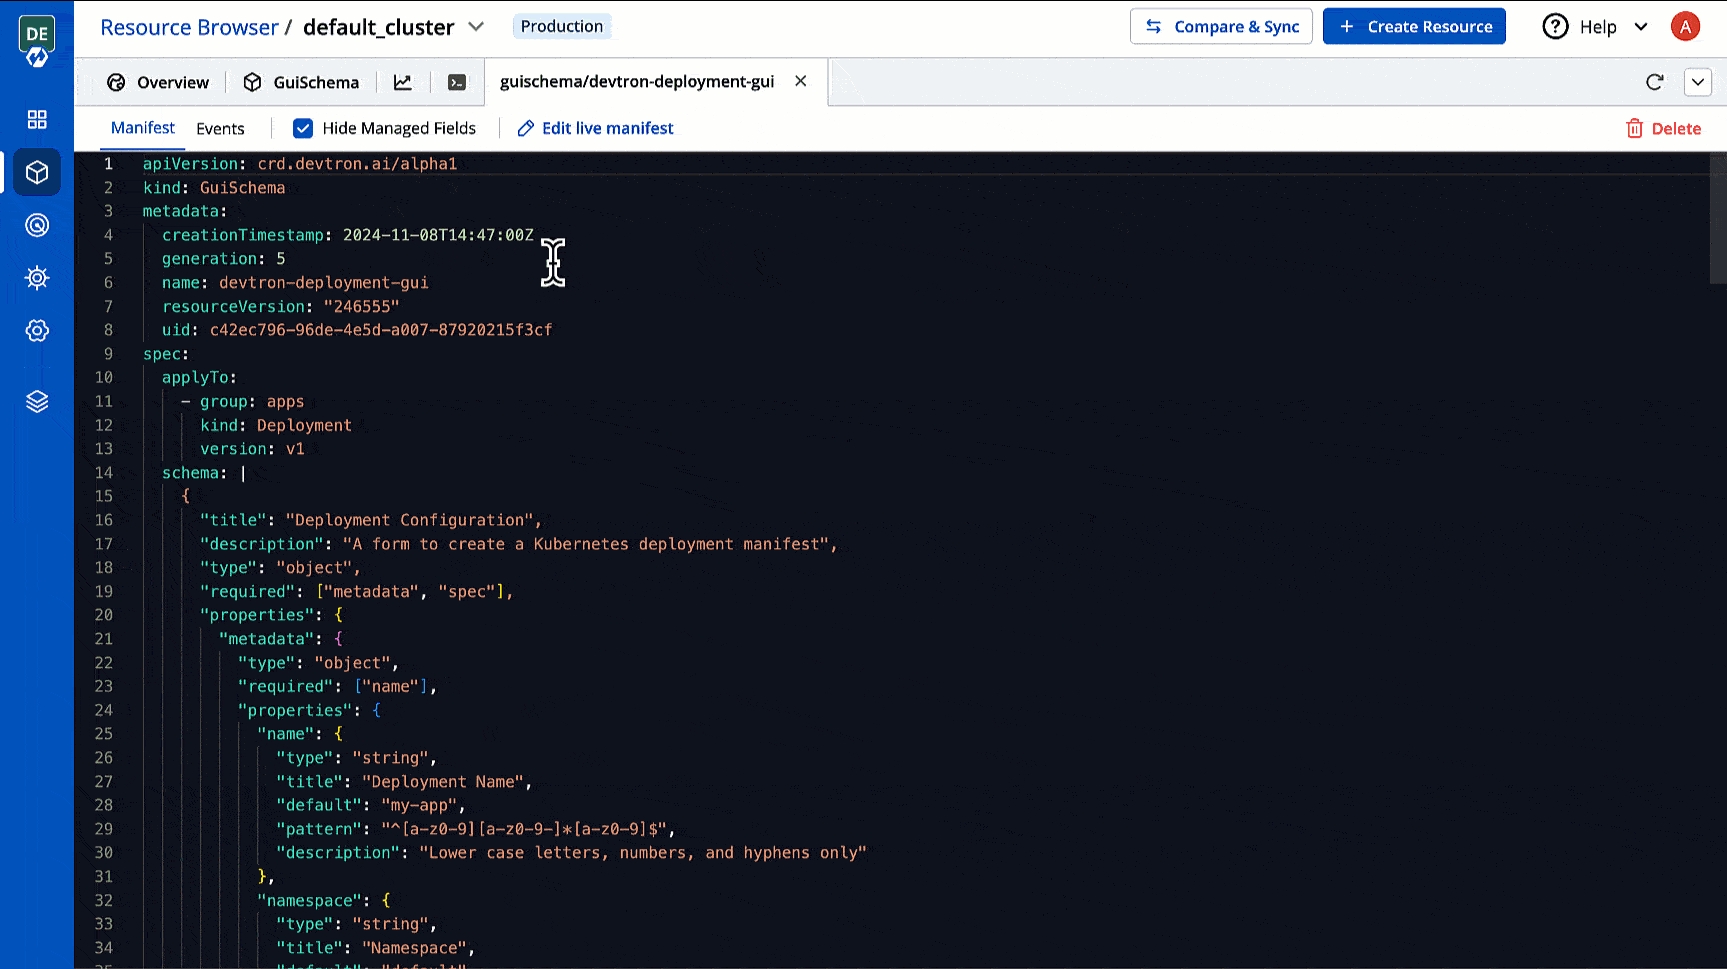
User needs to be an to edit its manifest.
You can edit the of a Kubernetes object. This can be for fixing errors, scaling resources, or changing configuration.
You can monitor activities like creation, deletion, updation, scaling, or errors in the resources involved. Refer to learn more.
User needs to be an to delete it.
You can debug a node via by selecting your namespace and image from the list that has all CLI utilities like kubectl, helm, netshoot etc. or can use a custom image, which is publicly available.
Cordoning a node means making the node unschedulable. After , new pods cannot be scheduled on this node.
Before performing maintenance on a node, evicts all of your pods safely from a node. Safe evictions allow the pod’s containers to gracefully terminate and honour the PodDisruptionBudgets you have specified (if relevant).
Enter the key:value pairs and select the from the drop-down list.
to read about taint effects.
You can also access from your node.
Users need to have to view its pods and its data.
Shows you the of the selected pod and allows you to edit it. Refer to learn more.
Shows you all the activities (create/update/delete) of the selected pod. Refer to know more.
User needs to be an to access pod terminal.
You can access the terminal within a running container of a pod to view its logs, troubleshoot issues, or execute commands directly. This is different from the you get at node level.
This is a part of . It is especially useful when kubectl exec is insufficient because a container has crashed or a container image doesn't include debugging utilities.
Advanced - It is particularly useful for advanced users that wish to use labels or annotations since it provides additional key-value options. Refer to view the supported options.
User with access can now troubleshoot cluster issues by accessing the cluster terminal from Devtron. You can select an image from the list that has all CLI utilities like kubectl, helm, netshoot etc. or can use a custom image, which is publicly available.
Select the namespace from the drop-down list which you have added in the section.
Here, you can see configuration information about the container(s) and pod (labels, resource requirements, etc.), as well as status information about the container(s) and pod (state, readiness, restart count, events, etc.). to know more about pod lifecycle.
User needs to be an to create resources.
You can create one or more in your cluster using YAML. In case you wish to create multiple objects, separate each resource definition by three dashes (---).
Assume your applications are running in a Kubernetes cluster on cloud. Now, if you wish to test or debug them on your local machine, you can perform . It creates a tunnel between a port on your machine and a port on a resource within your cluster. Therefore, you can access applications running inside the cluster as though they are running locally on your machine.
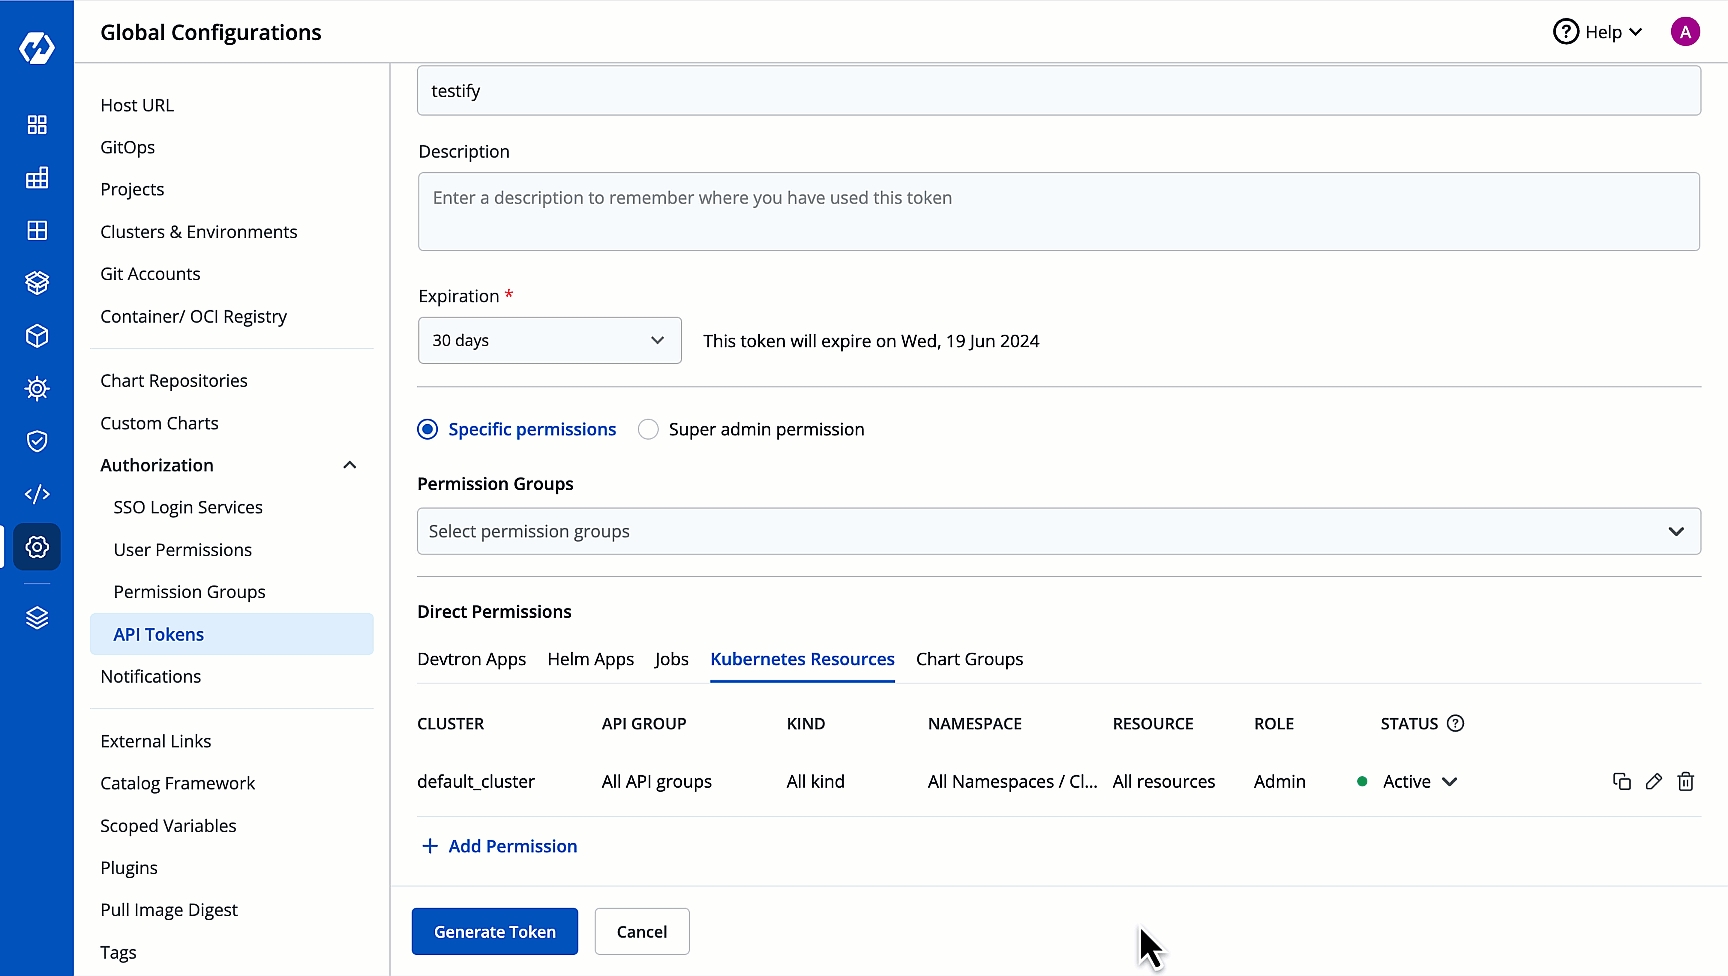
Devtron's Access Token - A kubectl-compatible token which can be generated and centrally maintained from .
Prerequisite: An for the user(s) to access the cluster.
Once you have successfully connected to the cluster, you may run the port-forward command. Refer to see a few examples.