

Troubleshooting
We always try to make your experience of using Devtron as smooth as possible but still if you face any issues, follow the troubleshooting guide given below or join our discord channel if you couldn't find the solution for the issue you are facing.
1. How to resolve unauthorized errors, while trying to save global configurations like hostname, GitOps etc. after successful devtron installation
This occurs most of the time because any one or multiple jobs get failed during installation. To resolve this, you'll need to first check which jobs have failed. Follow these steps:
Run the following command and check which are the jobs with 0/1 completions:
kubectl get jobs -n devtroncdNote down or remember the names of jobs with 0/1 completions and check if their pods are in running state still or not by running the command:
kubectl get pods -n devtroncdIf they are in running condition, please wait for the jobs to be completed as it may be due to internet issue. And if not in running condition, then delete those incomplete jobs using command:
kubectl delete jobs <job1-name> <job2-name> -n devtroncdNow download
migrator.yamlfile from our github repository using the command:
wget https://raw.githubusercontent.com/devtron-labs/devtron/main/manifests/yamls/migrator.yamlNow edit the file you downloaded in step 3 and remove the postgresql-migrator secret resource creation and then apply the yaml file using the command:
kubectl apply -f migrator.yaml -n devtroncdIt will re-create the failed jobs and you’ll see their pods created again. Just wait for a few minutes until the jobs gets completed then you are good to go. You should be able to save your global configurations now.
2. Not able to see deployment metrics on production environment or Not able to enable application-metrics or Not able to deploy the app after creating a configmap or secret with data-volume option enabled
Update the rollout CRDs to latest version, run the following command:
kubectl apply -f https://raw.githubusercontent.com/devtron-labs/devtron/main/manifests/yamls/rollout.yaml -n devtroncd3. SSO Login not working even after entering correct SSO Credentials
error: user/UserAuthHandler.go:236","msg":"service err, AuthVerification","err":"no token provided
Or
error: Failed to query provider "api/dex": Get "api/dex/.well-known/openid-configuration": unsupported protocol scheme
Delete devtron pod once to reload the configurations using:
kubectl delete pod -n devtroncd -l app=devtron4. Logs are not Visible on UI while running the build and not even able to abort the same
Check if the pods are being created when you start a new build, run the command and look if a new pod is created when you started the build:
kubectl get pods -n devtron-ciIf yes, delete kubewatch and devtron pod so that kubewatch can restart and start sharing the logs again:
kubectl delete pod -n devtroncd -l app=devtron; kubectl delete pod -n devtroncd -l app=kubewatchWait for 5 minutes and then trigger a new build again, if still not resolved then run the following commands one by one
kubectl delete pod -n devtroncd devtron-nats-0
kubectl delete pod -n devtroncd devtron-stan-0
kubectl delete pod -n devtroncd -l app=devtron
kubectl delete pod -n devtroncd -l app=kubewatch
Again wait for 5 minutes and your issue should be resolved
5. Grafana dashboards not visible in App Details page even after adding prometheus endpoint or Graphs showing error panel with id 2 not found
If the graphs are not visible check if prometheus is configured properly. Then go to Global Configurations > Clusters & Environments > Click on any environment for the cluster where you added prometheus endpoint and simply click Update.
If the charts are still not visible, try visiting the url: /grafana?orgId=2
If you see Not Found on this page, then follow all the given steps or if the page is accessible and you are getting panel with id 2 not found then follow from step 6:
Get grafana password using
kubectl -n devtroncd get secret devtron-secret -o jsonpath='{.data.GRAFANA_PASSWORD}' | base64 -dkubectl run --rm -it --image quay.io/devtron/k8s-utils:tutum-curl curlRun this command and it will create a pod for usingcurlCopy the following and change
grafana-passwordwith your password of grafana and change the value ofprometheusUrlwith your prometheus endpoint
cat << EOF
grafanaUrl="http://admin:[email protected]/grafana"
prometheusUrl="http://prometheus.example.com"

ORG_ID=$( curl -d '{"name":"devtron-metrics-view"}' -H "Content-Type: application/json" -X POST "${grafanaUrl}/api/orgs" )

echo $ORG_ID

curl -X POST "${grafanaUrl}/api/user/using/2";

curl -X PUT -H "Content-Type: application/json" -d '{"homeDashboardId":0,"theme":"light","timezone":"browser"}' "${grafanaUrl}/api/org/preferences";

curl "${grafanaUrl}/api/datasources" -H 'content-type: application/json' -H 'x-grafana-org-id: 2' --data '{"name":"Prometheus-devtron-demo","type":"prometheus","access":"proxy","isDefault":true}'

curl "${grafanaUrl}/api/datasources/2" -X PUT \
    -H 'content-type: application/json' \
    -H 'x-grafana-org-id: 2' \
    --data '{"id": 2 ,
    "orgId": 2,
    "name":"Prometheus-devtron-demo","type":"prometheus","access":"proxy",
    "url":${prometheusUrl},
    "basicAuth":false,"jsonData":{},"version":1}'
EOF
and run in the pod that we created above in step 2. 4. Now visit /grafana?orgId=2 again and you'll see grafana login page. Login using username admin and password from step 1 and check if prometheus url is updated in datasources. If not, update it in the default datasource. 5. Now from devtron UI, update any of the environment again and it's datasource will be created automatically. 6. In Grafana UI you need to be logged in and Go to Dashboards > Manage then click Import and Import the given dashboards one by one.
https://grafana.com/api/dashboards/13322/revisions/4/download
https://grafana.com/api/dashboards/13320/revisions/4/download
https://grafana.com/api/dashboards/13325/revisions/4/download
https://grafana.com/api/dashboards/13321/revisions/6/download
After that, your issue should be resolved and you should be able to see all the graphs on UI.
6. Unable to Login Devtron dashboard even if the password is correct
If you are not able to login into Devtron dashboard even after giving the correct password, it is possible that the argocd token of previous session has been stored in the cookies and is not able to override the new token that is generated for the new session. If you are facing this issue, follow the steps below -
If using Firefox -
Goto login page of Devtron and open inspect.
Navigate to storage tab in inspect.
Click on url where Devtron has been installed under
Cookiestab and you could see an argocd token with its value, something similar to below image.
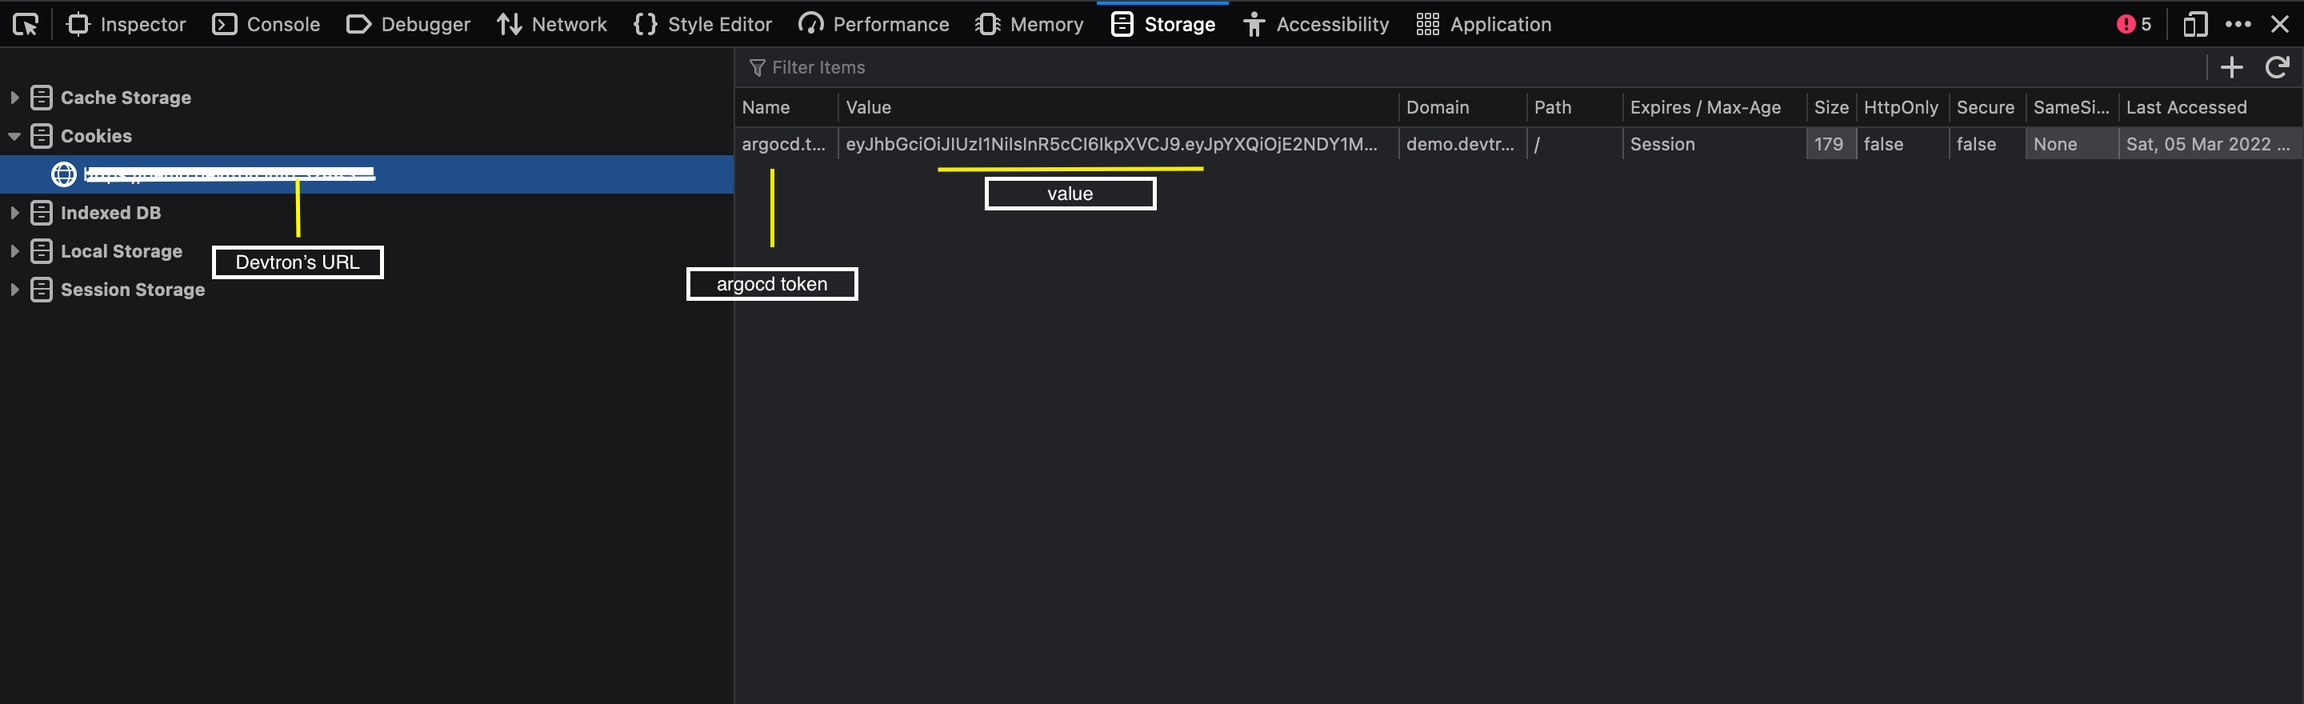
Now right click on token, and click on
Delete All Session Cookiesoption.
If using Chrome -
Goto login page of Devtron and open inspect.
Navigate to Application tab, and under
Storagetab click onCookies.Click on url under
Cookieand you would be able tto see an argocd token with its value, as shown in the image below.
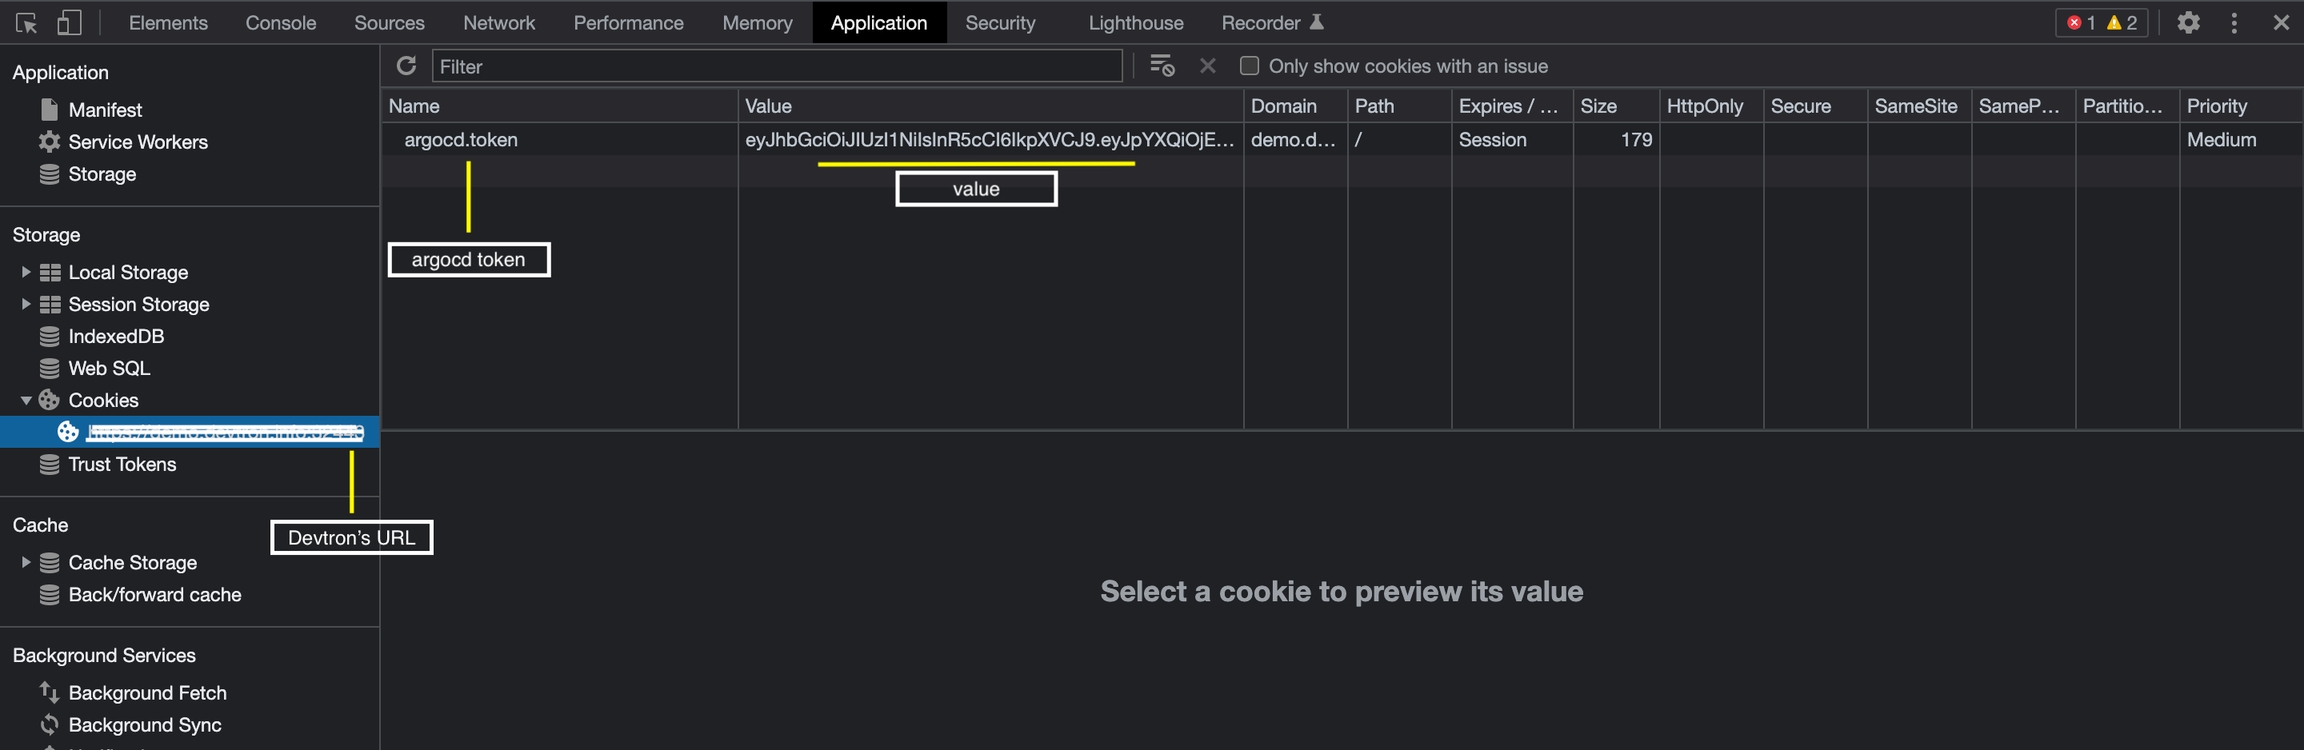
Now right click on token and click on
deleteoption.
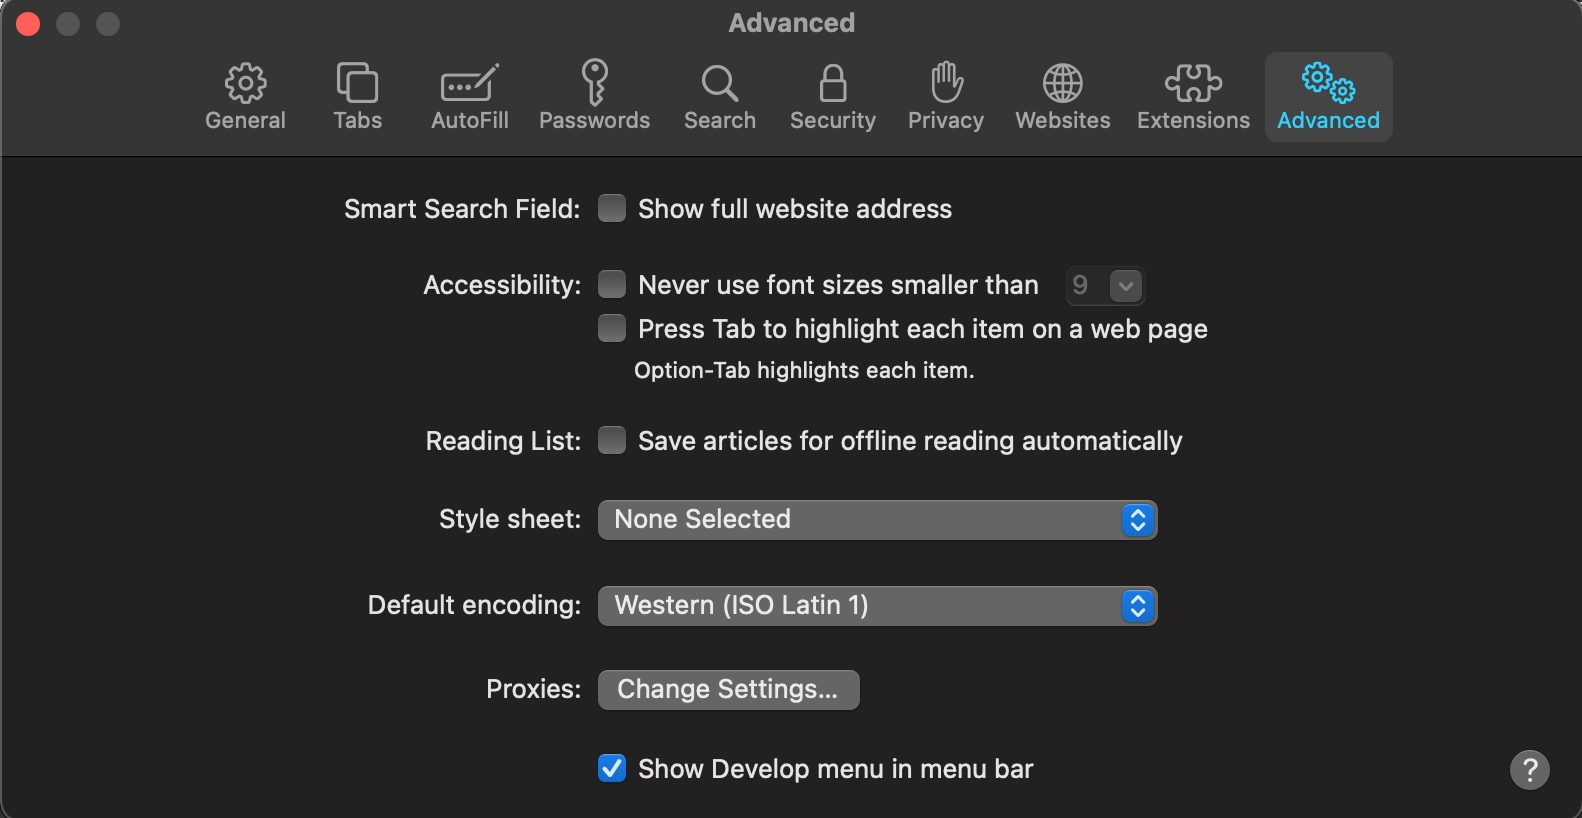
If using Safari -
Goto Safari preferences >> Advanced options and check the show develop menu as shown in the image below.
Now goto login page of Devtron and press
option+command+I. It will open inspect element.Then navigate to
Storage, click onCookiesand you would be able to see an argocd token with its value as shown in the image below.
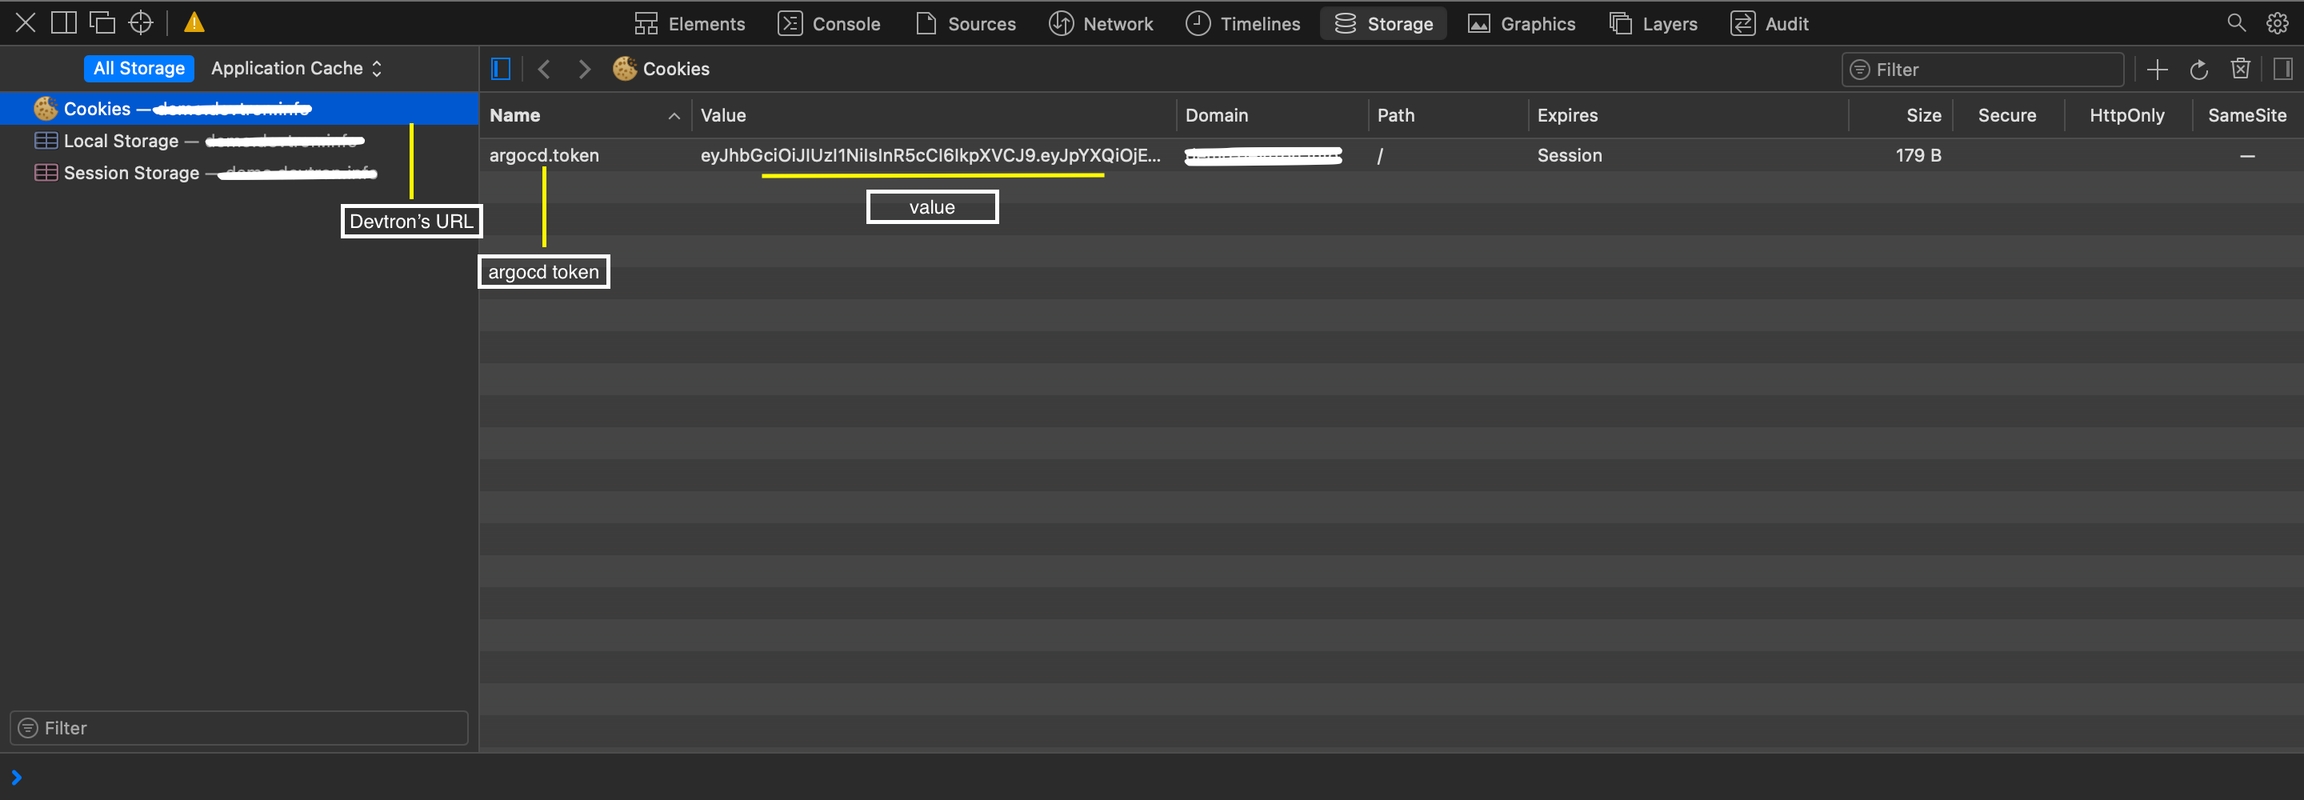
Now right click on token and select
deleteoption.
After clearing Cookies, try again to login, you should be able to login now.
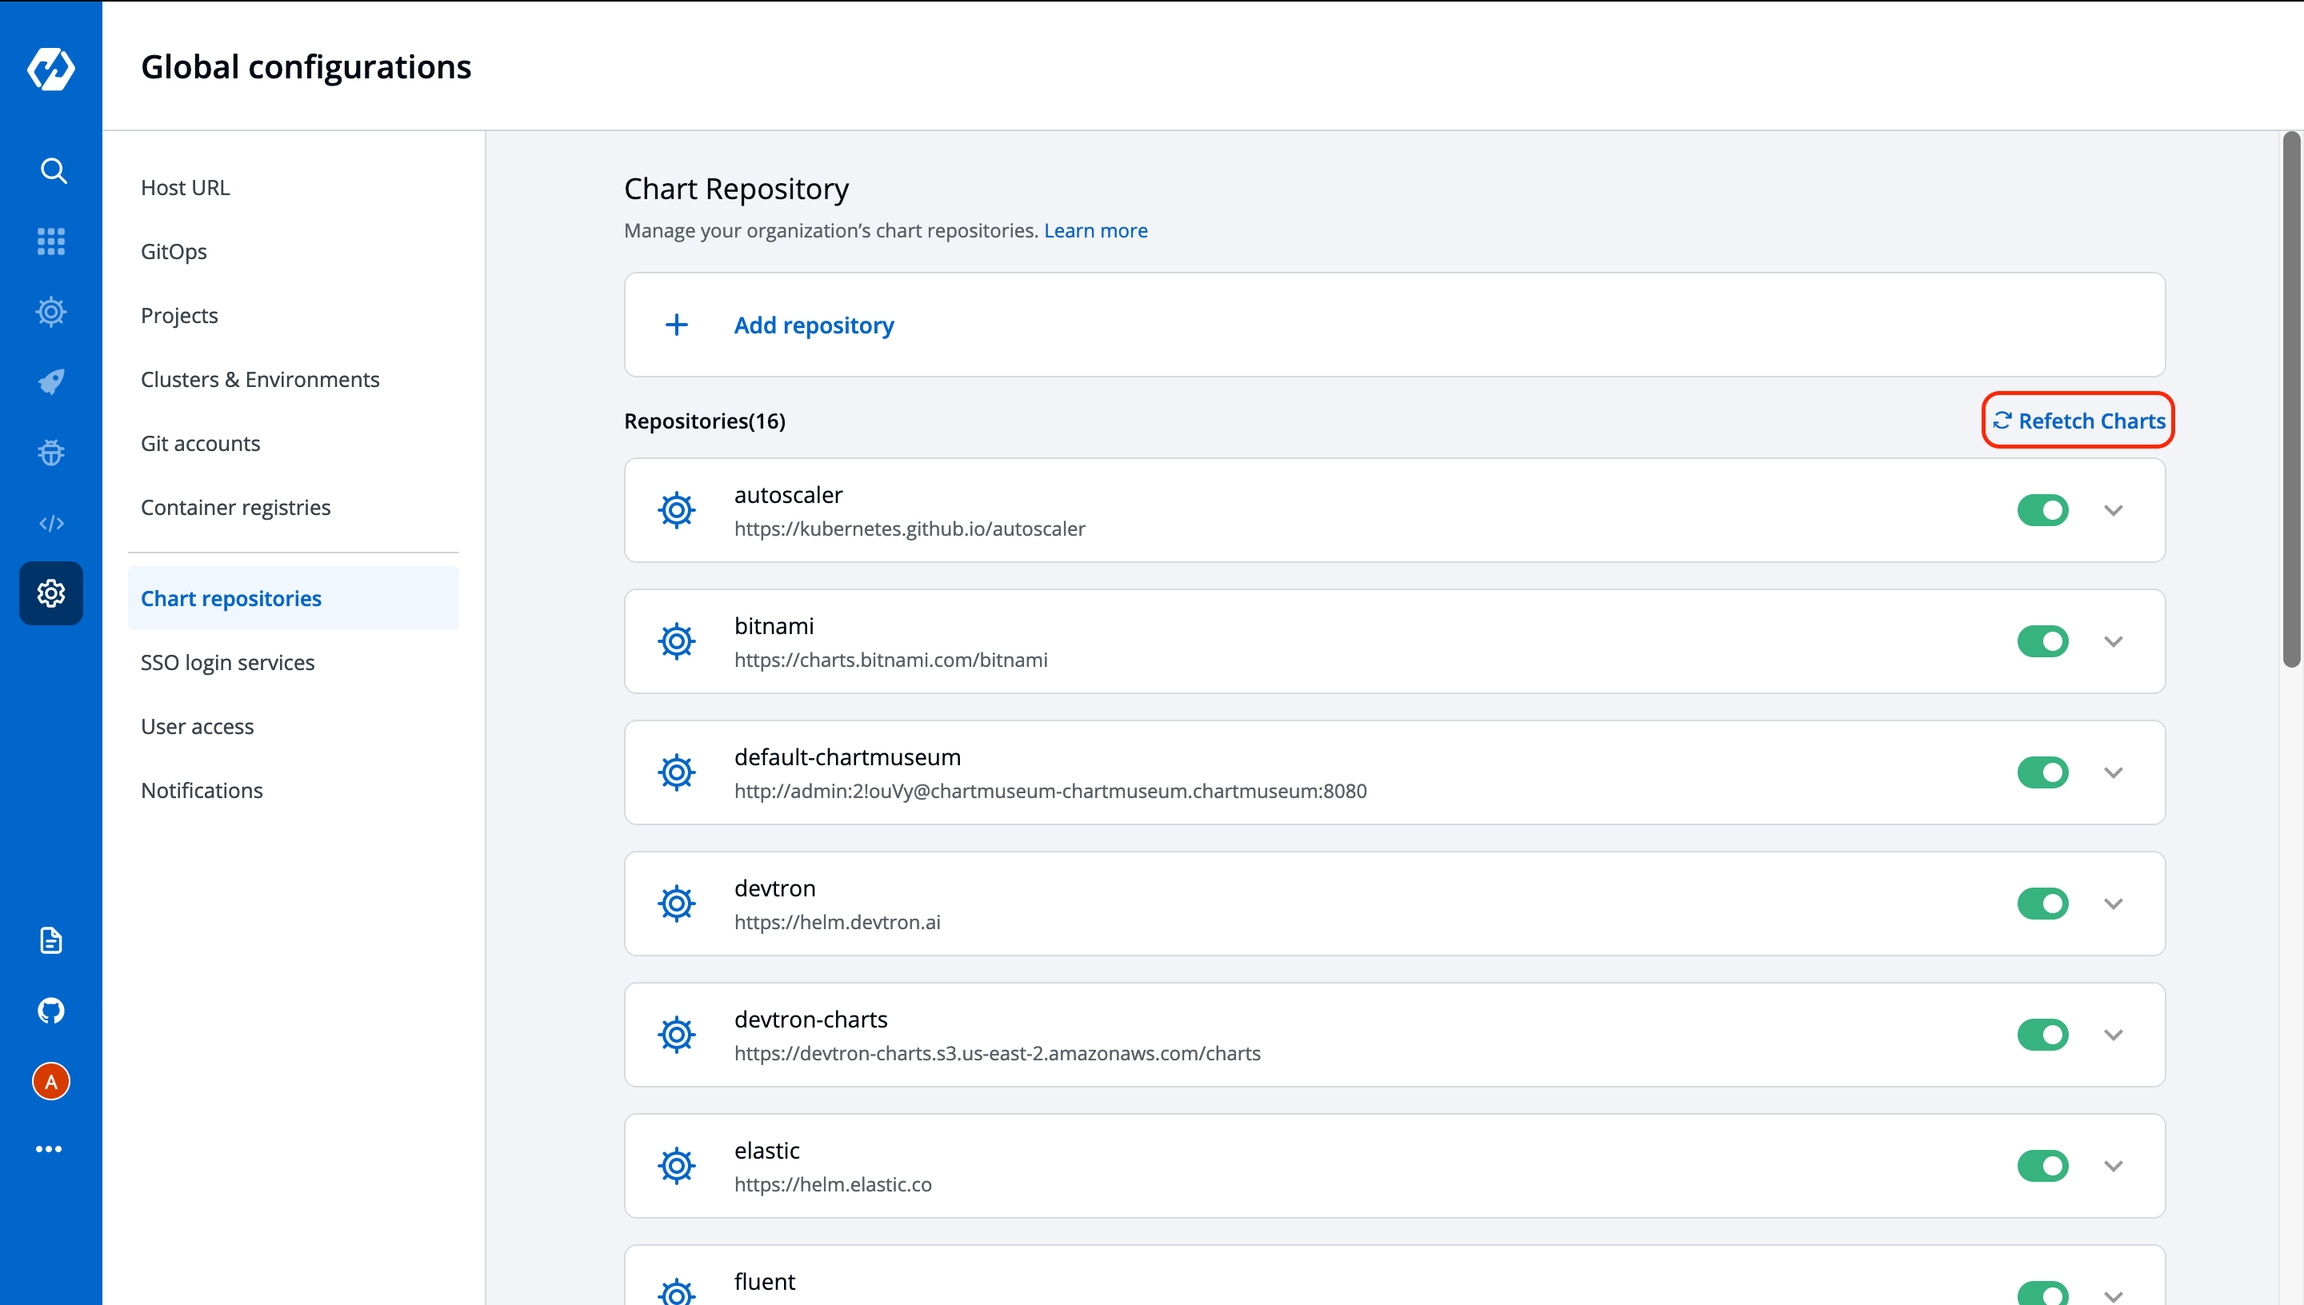
7. No charts found in Charts Discover Section
In the Devtron's Discover Chart section, if you are not able to see any charts available, goto Global Configuration >> Chart Repositories and click on Refresh Chart at the top-right as shown in the image below. After clicking the button, it might take 4-5mins to show all the charts in Discover section depending upon the chart repositories added.
8. Not able to update cluster
In Global Configurations >> Cluters & Environments, if you try to update a cluster which has been already added in Devtron, you might get an error as {"message":"Failed to update datasource. Reload new version and try again"}. If you are facing such issue, please follow the following steps -
Edit the changes you want to make in respective cluster
Click on save after making changes and you may get error message stated above.
Go to cluster where devtron has been installed and execute -
kubectl -ndevtroncd delete po -l app=devtronNow refresh the page and you should be able to save it.
[Note: If you already have created some environments in that cluster, it needs to be updated again]
9. Postgresql is in crashloop with error - Failed to pull image
There may be some other pods also in crashloop as they are not able to connect to database. To resolve this issue, you can either update devtron to latest version or run the following commands to fix instantly on the same version you are using:
kubectl patch -n devtroncd statefulset postgresql-postgresql -p '{"spec":{"template":{"spec":{"initContainers":[{"name":"init-chmod-data","image":"quay.io/devtron/minideb:latest"}],"containers":[{"name":"postgresql-postgresql","image":"quay.io/devtron/postgres:11.3.0-debian-9-r28"}]}}}}'Then delete postgresql pod so that it can fetch the updated images:
kubectl delete pod -n devtroncd postgresql-postgresql-0You can also delete other pods which are in crashloop after postgresql is up and running so that they can restart and connect to postgresql and Devtron will be up and running again in a few moments.
10. Unable to fetch the latest commit and not able to trigger auto build.
To solve this, bounce the git-sensor-0 pod.
kubectl delete pod -n devtroncd git-sensor-011. If you have restricted devtron-service to be accessible on certain IPs only and SSO login isn’t working
Whitelist the NAT-gateway IPs of the cluster (There can be multiple NAT-gateways if your cluster is multi-AZ)
12. If CPU metrics are not showing but memory metrics are visible in graphs.
Do the following:-
Go to Grafana and Login with the credentials.
Edit the CPU graphs and remove
image!=””from the query.Save the dashboard.
CPU metrics should start showing up in a while.
13. If user not able to upload a file more than specific size.
Please use below annotation in ingress
nginx.ingress.kubernetes.io/proxy-body-size: 100mNote:- Where m is MiB.
14. If AWS Load balancer controller is unable to provision ALB and getting message in alb controller as unauthorized, attach these IAM policy to the nodegroup IAM Role.
15. When app metrics is not coming on grafana and devtron dashboard, set the value of the following parameter as false in kube prometheus stack values.
serviceMonitorSelectorNilUsesHelmValues: false16. Unable to deploy metrics-server using chart on devtron
To solve
Disable certificate validation by passing --kubelet-insecure-tls argument to metrics server chart.
17. Unable to delete a database from postgres
Description of issue
ERROR: database <db-name> is being accessed by other users
DETAIL: There is 1 other session using the database.
You have to terminate the connections to the database first, for that you can use the command.
SELECT pg_terminate_backend(pg_stat_activity.pid) FROM pg_stat_activity WHERE pg_stat_activity.datname='TARGET_DB';Then run the command to delete database - drop databases <db-name>
18. Unable to login with admin password or reset devtron admin password
Debug
Run the command for admin credentials and use it for login in dashboard:
kubectl -n devtroncd get secret devtron-secret -o jsonpath='{.data.ADMIN_PASSWORD}' | base64 -dIf you are getting an error message of "invalid username or password" or you want to "reset admin password", follow the steps given below:
Solution:
Make sure you are on latest version or atleast you are using devtron version v0.6.9 or above. You can check your devtron version using
kubectl -n devtroncd get installers installer-devtron -o jsonpath='{.status.sync.data}' | grep "^LTAG=" | cut -d"=" -f2-Take a backup of devtron secret using
kubectl get secret devtron-secret -n devtroncd -o yaml > devtron-secret-backup.yamlEdit devtron secret using
kubectl edit secret devtron-secret -n devtroncdand remove the key value pairs of ADMIN_PASSWORD, admin.password and admin.passwordMtimeRestart argocd dex server to create new admin password for devtron using
kubectl delete po -n devtroncd -l app.kubernetes.io/name=argocd-dex-serverRun the command given above to get the new admin password
19. After installing Devtron using Helm, getting the admin password does not work.(if using windows)
Debug
'base64' is not recognized as an internal or external command, operable program or batch file.
Solution
The first way to debug is either install base64 encode and decode into your windows machine and use the appropriate cmd to get the admin password.
The other way is to get the password in the encoded form using the cmd
kubectl -n devtroncd get secret devtron-secret -o jsonpath='{.data.ACD_PASSWORD}', further decode it into plaintext using an online encoder decoder.
20. Getting UPGRADE FAILED: cannot patch "postgresql-postgresql" while upgrading Devtron to newer versions
UPGRADE FAILED: cannot patch "postgresql-postgresql" while upgrading Devtron to newer versionsDebug:
Make sure to annotate and label all the Devtron resources.
Description of error
Error: UPGRADE FAILED: cannot patch "postgresql-postgresql" with kind StatefulSet: StatefulSet.apps "postgresql-postgresql" is invalid: spec: Forbidden: updates to statefulset spec for fields other than 'replicas', 'template', 'updateStrategy' and 'minReadySeconds' are forbiddenSolution: Verify if annotations & labels are set to all k8s resources in devtroncd namespace and add --set components.postgres.persistence.volumeSize=20Gi parameter in Devtron upgrade command.
helm upgrade devtron devtron/devtron-operator --namespace devtroncd \
-f https://raw.githubusercontent.com/devtron-labs/devtron/main/charts/devtron/devtron-bom.yaml \
--set installer.modules={cicd} --reuse-values \
--set components.postgres.persistence.volumeSize=20Gi
21. Configure Blob Storage
You can configure blob storage with one of the following:
This configuration will use MinIO for storing logs and cache.
helm repo update

helm upgrade devtron devtron/devtron-operator \
--create-namespace --namespace devtroncd \
--reuse-values \
--set installer.modules={cicd} \
--set minio.enabled=true
This configuration will use AWS S3 bucket for storing build logs and cache. Refer to the AWS specific parameters on the Storage for Logs and Cache page.
Configure using S3 IAM policy:
NOTE: Pleasee ensure that S3 permission policy to the IAM role attached to the nodes of the cluster if you are using the below command.
helm repo update
helm upgrade devtron devtron/devtron-operator --namespace devtroncd \
--set installer.modules={cicd} \
--reuse-values \
--set configs.BLOB_STORAGE_PROVIDER=S3 \
--set configs.DEFAULT_CACHE_BUCKET=demo-s3-bucket \
--set configs.DEFAULT_CACHE_BUCKET_REGION=us-east-1 \
--set configs.DEFAULT_BUILD_LOGS_BUCKET=demo-s3-bucket \
--set configs.DEFAULT_CD_LOGS_BUCKET_REGION=us-east-1
Configure using access-key and secret-key for aws S3 authentication:
helm repo update

helm upgrade devtron devtron/devtron-operator --namespace devtroncd \
--set installer.modules={cicd} \
--reuse-values \
--set configs.BLOB_STORAGE_PROVIDER=S3 \
--set configs.DEFAULT_CACHE_BUCKET=demo-s3-bucket \
--set configs.DEFAULT_CACHE_BUCKET_REGION=us-east-1 \
--set configs.DEFAULT_BUILD_LOGS_BUCKET=demo-s3-bucket \
--set configs.DEFAULT_CD_LOGS_BUCKET_REGION=us-east-1 \
--set secrets.BLOB_STORAGE_S3_ACCESS_KEY=<access-key> \
--set secrets.BLOB_STORAGE_S3_SECRET_KEY=<secret-key>
Configure using S3 compatible storages:
helm repo update

helm upgrade devtron devtron/devtron-operator --namespace devtroncd \
--set installer.modules={cicd} \
--reuse-values \
--set configs.BLOB_STORAGE_PROVIDER=S3 \
--set configs.DEFAULT_CACHE_BUCKET=demo-s3-bucket \
--set configs.DEFAULT_CACHE_BUCKET_REGION=us-east-1 \
--set configs.DEFAULT_BUILD_LOGS_BUCKET=demo-s3-bucket \
--set configs.DEFAULT_CD_LOGS_BUCKET_REGION=us-east-1 \
--set secrets.BLOB_STORAGE_S3_ACCESS_KEY=<access-key> \
--set secrets.BLOB_STORAGE_S3_SECRET_KEY=<secret-key> \
--set configs.BLOB_STORAGE_S3_ENDPOINT=<endpoint>
This configuration will use Azure Blob Storage for storing build logs and cache. Refer to the Azure specific parameters on the Storage for Logs and Cache page.
helm repo update
helm upgrade devtron devtron/devtron-operator --namespace devtroncd \
--set installer.modules={cicd} \
--reuse-values \
--set secrets.AZURE_ACCOUNT_KEY=xxxxxxxxxx \
--set configs.BLOB_STORAGE_PROVIDER=AZURE \
--set configs.AZURE_ACCOUNT_NAME=test-account \
--set configs.AZURE_BLOB_CONTAINER_CI_LOG=ci-log-container \
--set configs.AZURE_BLOB_CONTAINER_CI_CACHE=ci-cache-container
This configuration will use Google Cloud Storage for storing build logs and cache. Refer to the Google Cloud specific parameters on the Storage for Logs and Cache page.
helm repo update

helm upgrade devtron devtron/devtron-operator --namespace devtroncd \
--set installer.modules={cicd} \
--reuse-values \
--set configs.BLOB_STORAGE_PROVIDER: GCP \
--set secrets.BLOB_STORAGE_GCP_CREDENTIALS_JSON: {\"type\": \"service_account\",\"project_id\": \"<your-project-id>\",\"private_key_id\": \"<your-private-key-id>\",\"private_key\": \"<your-private-key>\",\"client_email\": \"<your-client-email>\",\"client_id\": \"<your-client-id>\",\"auth_uri\": \"https://accounts.google.com/o/oauth2/auth\",\"token_uri\": \"https://oauth2.googleapis.com/token\",\"auth_provider_x509_cert_url\": \"https://www.googleapis.com/oauth2/v1/certs\",\"client_x509_cert_url\": \"<your-client-cert-url>\"} \
--set configs.DEFAULT_CACHE_BUCKET: cache-bucket
--set configs.DEFAULT_BUILD_LOGS_BUCKET: log-bucket
22. Rollout is showing error - :111: attempt to index a non-table object(nil) with key 'stableRS' stack traceback: :111: in main chunk [G]: ?
This can occur if you are using or recently upgraded to Kubernetes version 1.22 or above and you are using rollout controller version 0.13.0 from chart devtron-charts/rollout or devtron/rollout. The issue can be because of CRDs which were updated in later versions of rollout chart.
Check which chart repo and version of rollout controller are you using on that cluster from Helm Apps section
Update the rollout chart version to latest and re-deploy. If your rollout controller is deployed from
devtron-chartshelm repo then change the repo todevtron/rolloutand then update the version to latest. Also, if devtron helm repo is not showing on your devtron then go to Global Configurations > Chart Repositories and add a new repo with the namedevtronand urlhttps://helm.devtron.ai. Wait for few minutes and then charts from devtron repo will be there on your devtron. This should resolve your issue
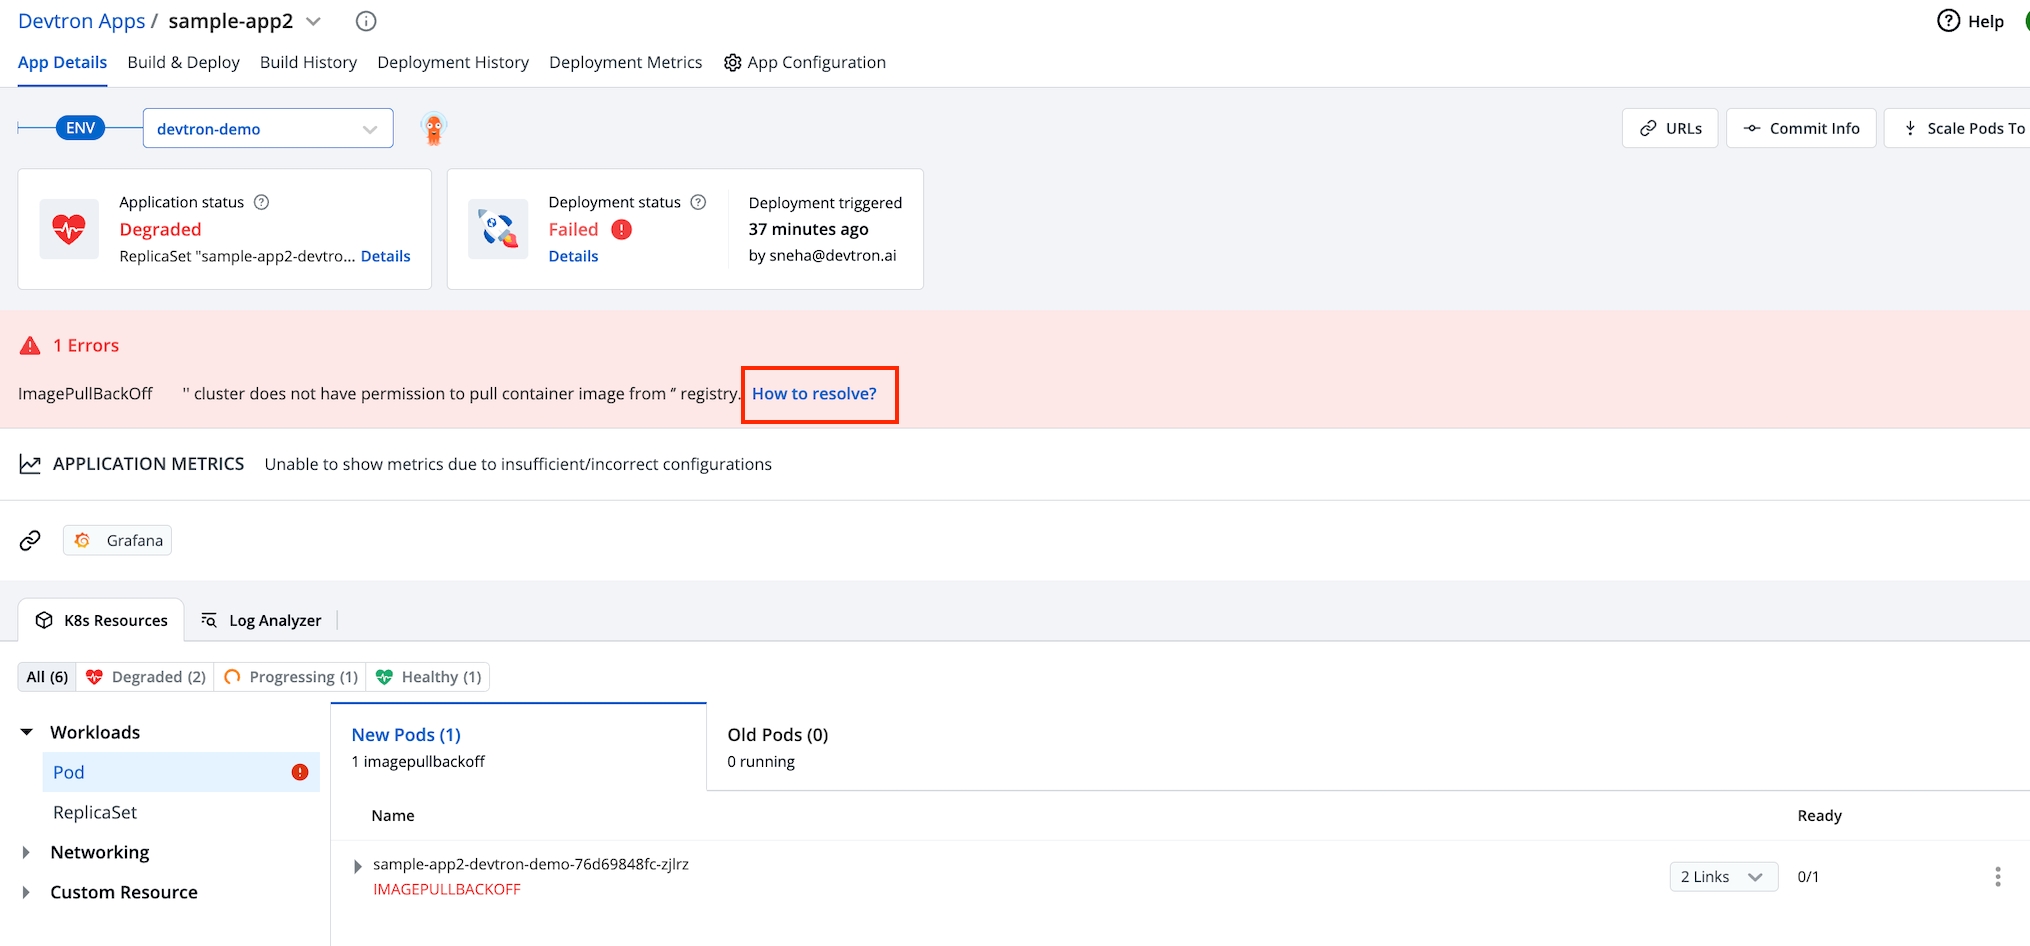
23. How to resolve if Deployment Status shows Failed or Degraded when you pull images from private container registry
If the deployment status shows Failed or Degraded, then the cluster is not able to pull container image from the private registry. In that case, the status of pod shows ImagePullBackOff.
The failure of deployment can be one of the following reasons:
Provided credentials may not have permission to pull container image from registry.
Provided credentials may be invalid.
You can resolve the ImagePullBackOff issue by clicking How to resolve? on the App Details page.
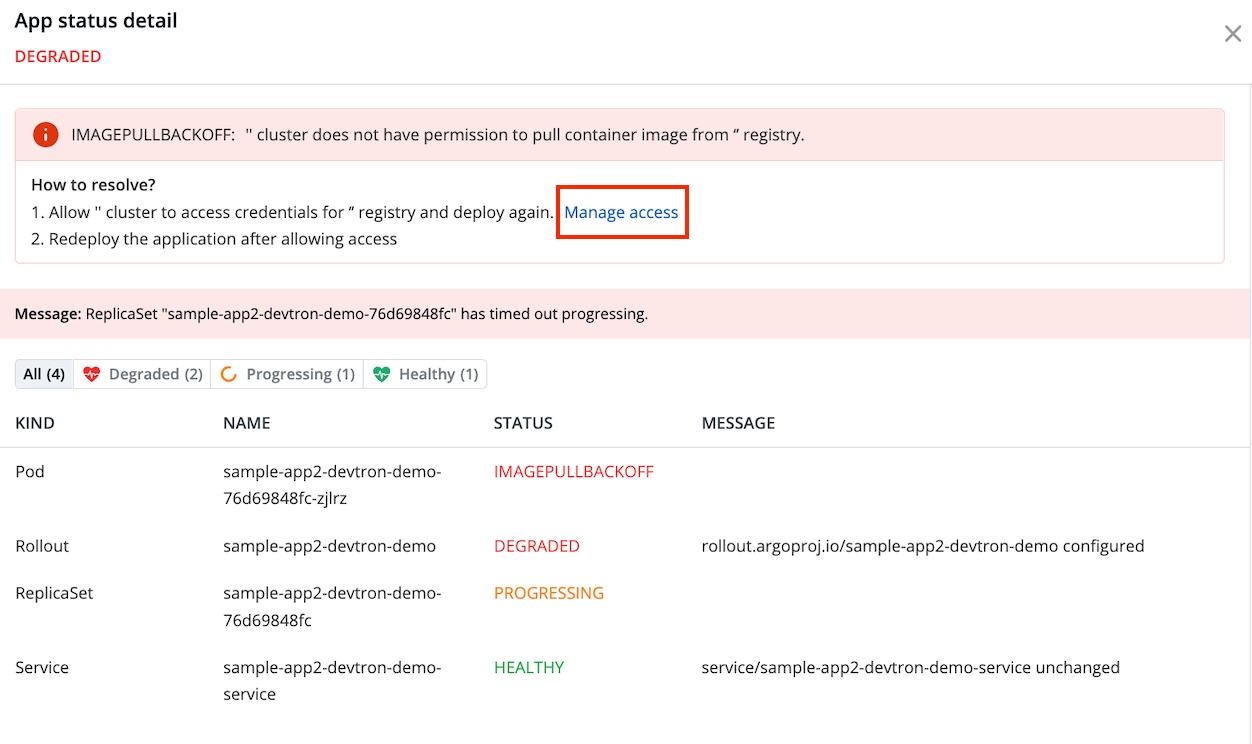
To provide the auto-inject credentials to the specific clusters for pulling the image from the private repository, click Manage Access which will take you to the Container Registries page.
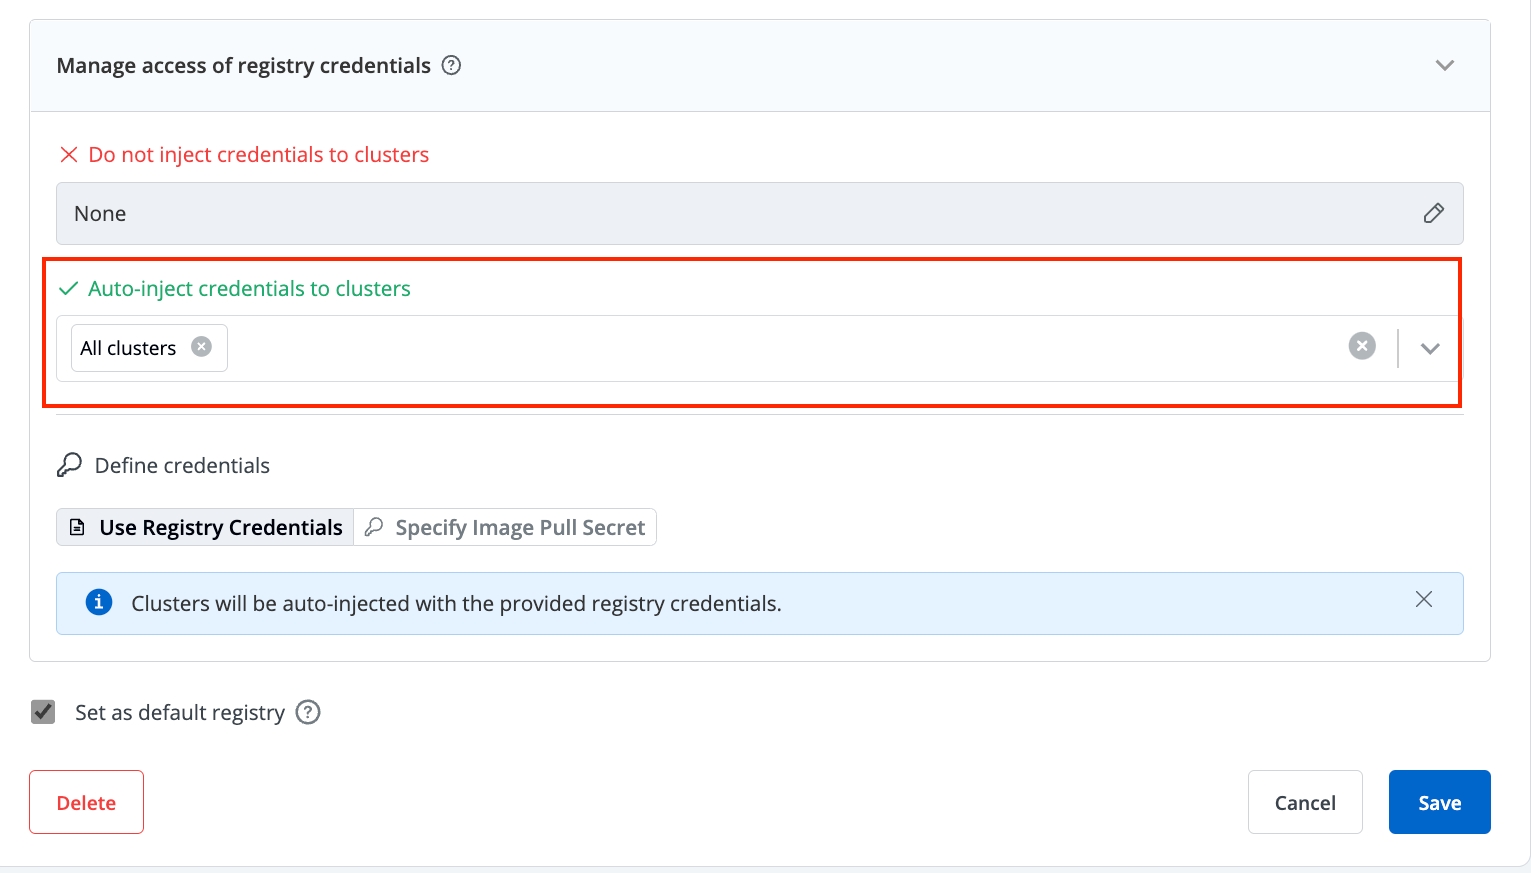
On the Container Registries page, select the docker registry and click Manage.
In the Auto-inject credentials to clusters, click Confirm to edit to select the specific cluster or all clusters for which you want to auto-inject the credentials to and click Save.
Redeploy the application after allowing the access.
24. Devtron Terminal Connection Timeout Issue on GKE Cluster
Problem:
When connecting to the pod or cluster terminal from the Devtron dashboard on an ingress with gce class in a GKE cluster, the connection gets disconnected after every 30 seconds. This issue is caused by the default timeoutSec value of 30 seconds in the backendConfig.
Solution:
To resolve this issue, you can increase the timeoutSec value in the backendConfig and apply the configuration to the Devtron service. Here are the steps to do this:
Create a
BackendConfigyaml file with the increasedtimeoutSecvalue. For example:
apiVersion: cloud.google.com/v1beta1
kind: BackendConfig
metadata:
  name: devtron-backendconfig
spec:
  timeoutSec: 1800
you can adjust the timeoutSec value in the backendConfig as per your specific requirement. This value determines the maximum amount of time the load balancer should wait for a response from the backend before timing out. You can set the timeoutSec value to a higher or lower value based on your use case and the response time of your backend.
Apply the BackendConfig to the GKE cluster using the following command:
kubectl apply -f <path-to-backendconfig.yaml> -n devtroncdAdd the
cloud.google.com/backend-config: '{"default": "devtron-backendconfig"}'annotation to the Devtron service with the BackendConfig name. For example:
apiVersion: v1
kind: Service
metadata:
  name: devtron-service
  namespace: devtroncd
  annotations:
    cloud.google.com/backend-config: '{"default": "devtron-backendconfig"}'
...
Save the changes to the Devtron service configuration.
With these configuration changes, the Devtron dashboard connection should no longer timeout after 30 seconds, allowing for a more stable and consistent connection.
25. Refreshing ArgoCD Certificates When Expired
Edit ArgoCD Secret
Use kubectl edit to edit the ArgoCD secret in the appropriate namespace (devtroncd in this case). Find the data section and delete the lines for tls.crt and tls.key:
kubectl edit secret argocd-secret -n devtroncdDelete Lines for
tls.crtandtls.key
Once you've opened the ArgoCD secret for editing, find the data section and delete the lines for tls.crt and tls.key. Save your changes and exit the editor.
Delete ArgoCD Server Pod
Use kubectl delete pod to delete the ArgoCD server pod. This will cause a new pod to be created with the updated certificate.
kubectl delete pod -n devtroncd <argocd-server-pod-name>Replace <argocd-server-pod-name> with the name of the ArgoCD server pod.
Delete Devtron Pod
Wait for two minutes and then delete the Devtron pod using kubectl delete pod. This will force the Devtron pod to use the new certificate.
kubectl delete pod -n devtroncd -l app=devtronThis command deletes the Devtron pod in the devtroncd namespace with the label app=devtron.
Following these steps should allow you to refresh the ArgoCD certificates when they have expired.
26. Not able to see commits, throwing exit status 128
Save the Git Repository Again Wait for few minutes and check the build pipeline if commits are visible or not
Check git sensor pod logs
kubectl logs -n devtroncd -l app=git-sensorIf you still get the same issue, try to bounce the pod and save the git repository again
kubectl delete po -n devtroncd -l app=git-sensorTry to clone the git repository with the token you have added for Git Account
In case the cloning fails, you can generate the token, update the Git account in Global Configurations, and try to save the git repository again.
27. Git-sensor PVC- disk full
Need to increase the PVC size if you are getting following error:
Need to check the Storageclass by which PVC was provisioned.
Run the following command:
kubectl get storageclassCheck for the field allowVolumeExpansion, if it is set to true, run the following command and increase the size of the PVC.
kubectl edit pvc git-volume-git-sensor-0 -n devtroncdHowever, if the field is allowVolumeExpansion: false, set it to true and run the above command.
Edit the following field:
spec:
    capacity:
        storage: 10Gi # increase as per convenience
Increase the PVC size as per your requirement. This will resolve the issue. If not, then try to bounce the pod using the following command.
kubectl delete po -n devtroncd git-sensor-0Last updated
Was this helpful?