External links
Last updated
Last updated
External links allow you to connect to the third-party Monitoring Tools within your Devtron dashboard for seamlessly monitoring/debugging/logging/analyzing your applications. The Monitoring Tool is available as a bookmark at various component levels, such as application, pods, and container.
To monitor/debug an application using a specific Monitoring Tool (such as Grafana, Kibana, etc.), you may need to navigate to the tool's page, then to the respective app/resource page.
External links take you directly to the tool's page, which includes the context of the application, environment, pod, and container.
Before you begin, configure an application in the Devtron dashboard.
Super admin access*
Monitoring tool URL
*External links can only be added/managed by a super admin, but other users can access the configured Monitoring tools on their app's page.
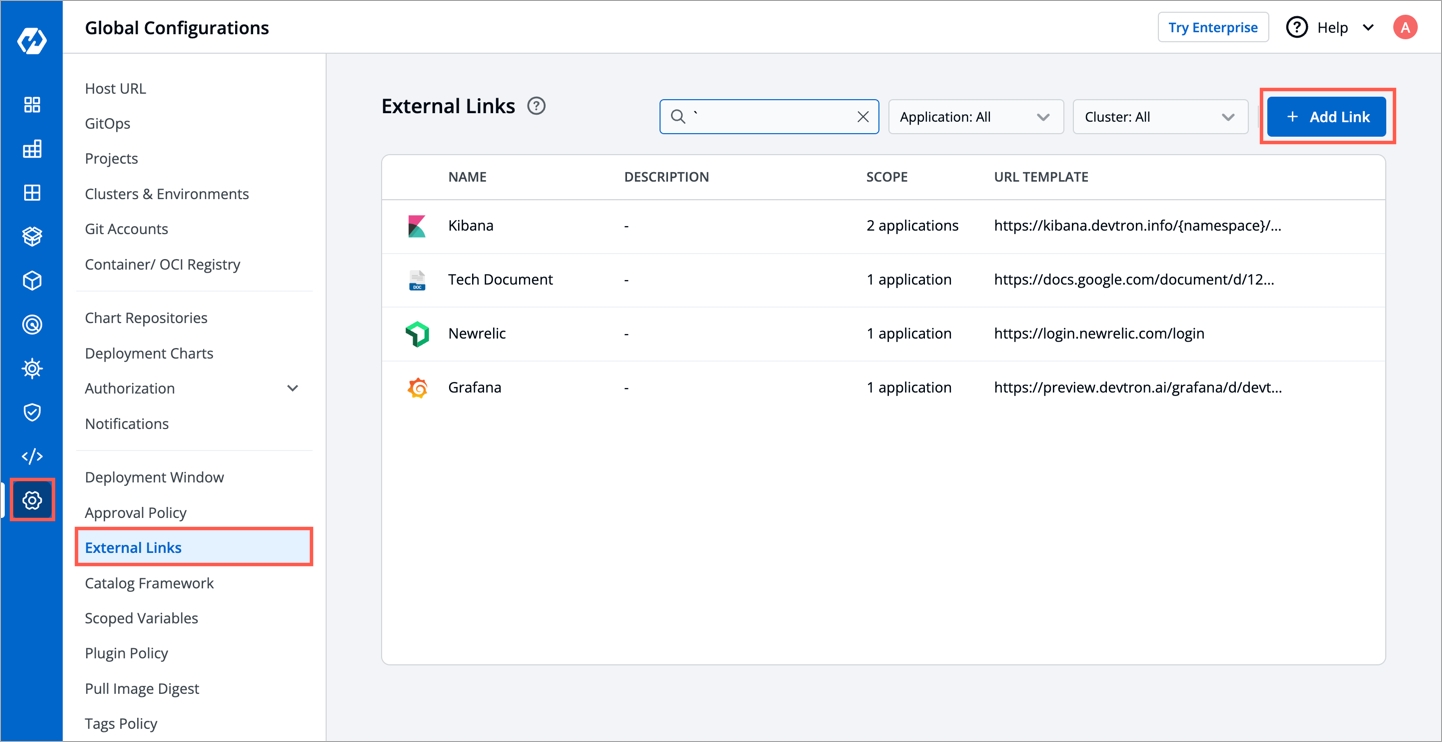
On the Devtron dashboard, select Global Configurations from the left navigation pane.
Select External links.
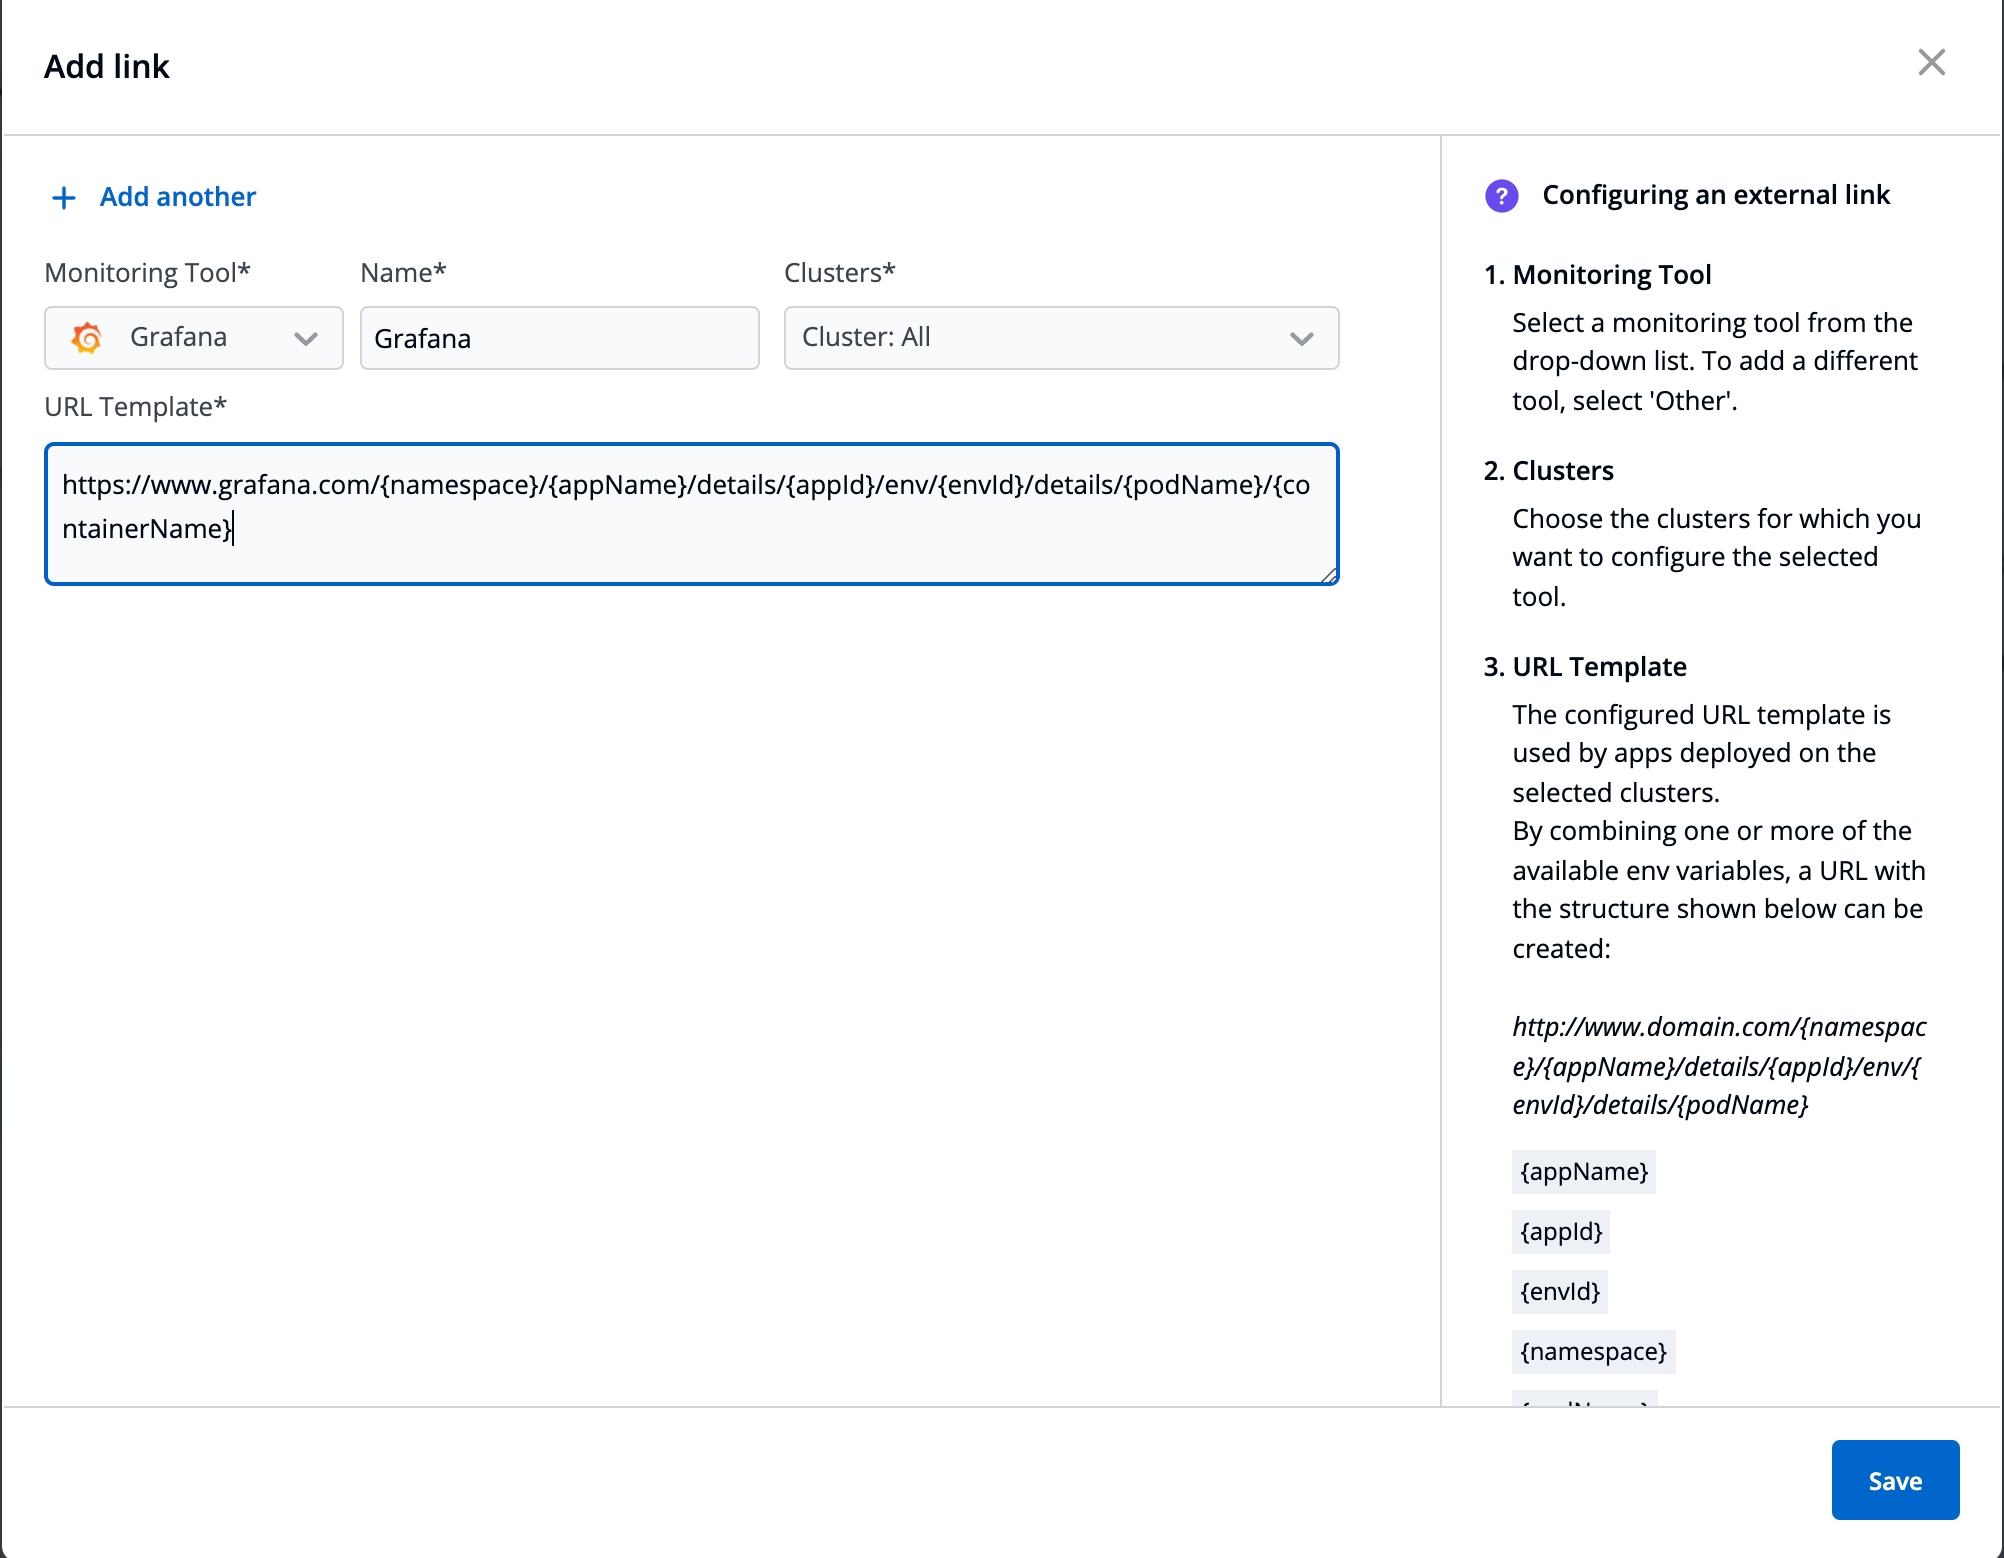
Select Add link.
On the Add link page, enter the following fields:
Monitoring Tool
Select a Monitoring Tool from the drop-down list. To add a different tool, select 'Other'.
Name
Enter a user-defined name for the Monitoring Tool
Clusters
Choose the clusters for which you want to configure the selected tool.
Select more than one cluster name, to enable the link on multiple clusters
Select 'Cluster: All', to enable the link on the existing clusters and future clusters
URL Template
The configured URL Template is used by apps deployed on the selected clusters. By combining one or more of the env variables, a URL with the structure shown below can be created: http://www.domain.com/{namespace}/{appName}/details/{appId}/env/{envId}/details/{podName} The env variables:
{appName}
{appId}
{envId}
{namespace}
{podName}: If used, the link will only be visible at the pod level on the App details page.
{containerName}: If used, the link will only be visible at the container level on the App details page.
Note: The env variables will be dynamically replaced by the values that you used to configure the link.
Note: To add multiple links, select + Add another at the top-left corner.
Select Save.
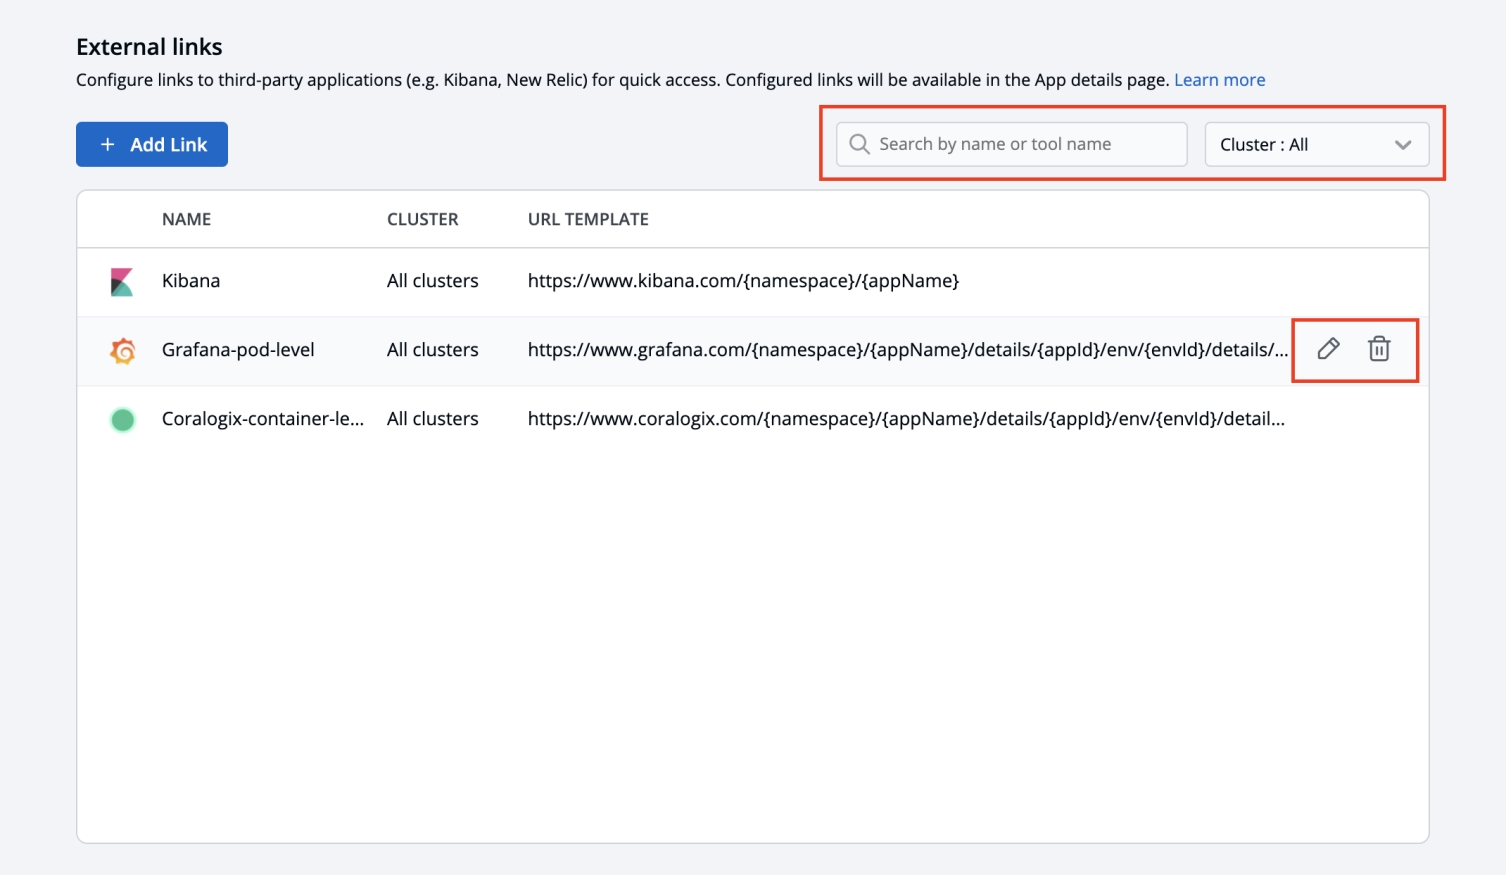
The users (admin and others) can access the configured external link from the App details page.
On this page, the configured external links can be filtered/searched, as well as edited/deleted.
Select Global Configurations > External links.
Filter and search the links based on the tool's name or a user-defined name.
Edit a link by selecting the edit icon next to an external link.
Delete an external link by selecting the delete icon next to a link. The bookmarked link will be removed in the clusters for which it was configured.