Chart Group
Introduction
Using Devtron UI, one or more Helm charts can be grouped and deployed together with a single click.
1. Create Group
In the left pane, select
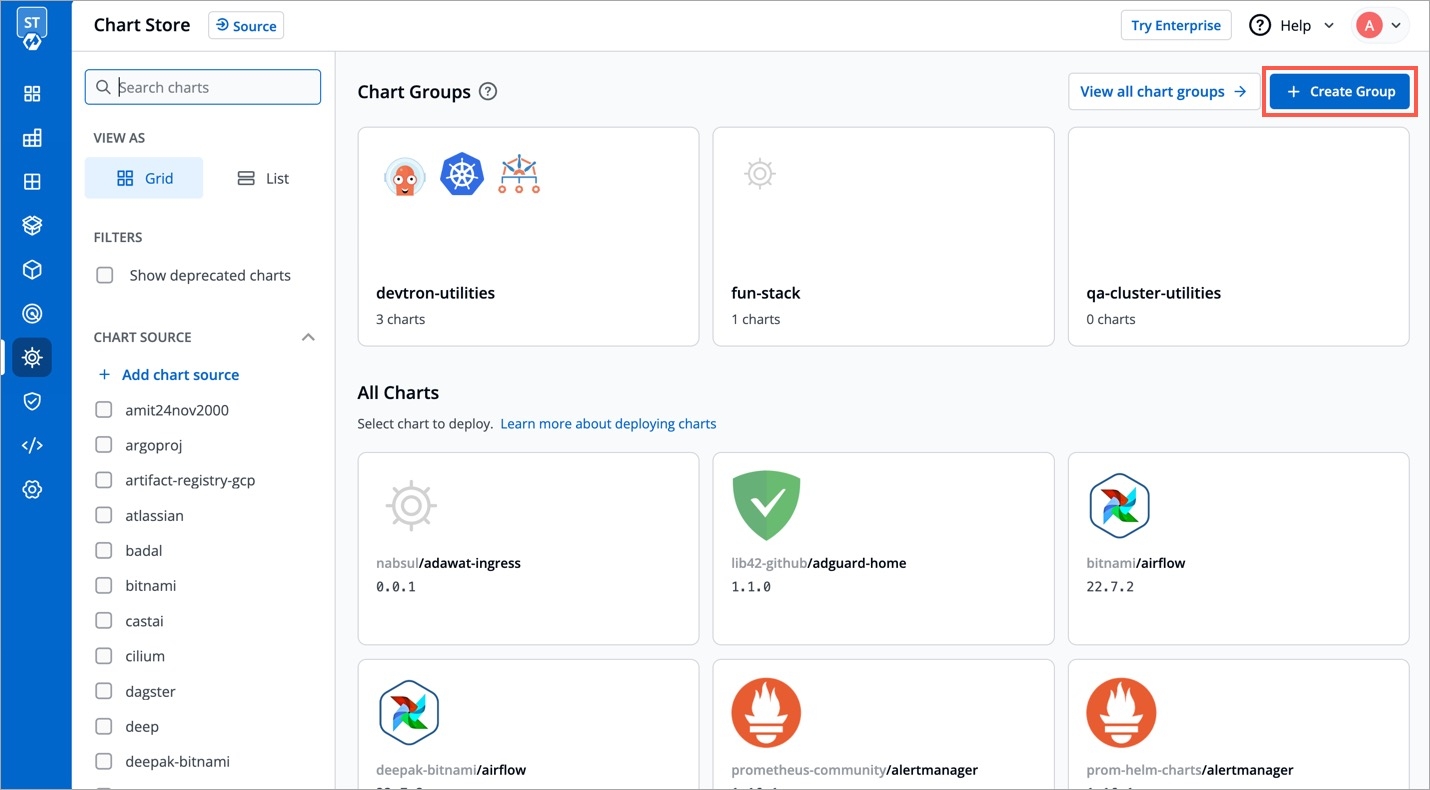
Charts.On the
Chart Storepage, selectCreate Groupfrom the upper-right corner.
In the
Create Chart Groupscreen, enternameanddescription(optional) for the chart group, and then selectCreate Group.
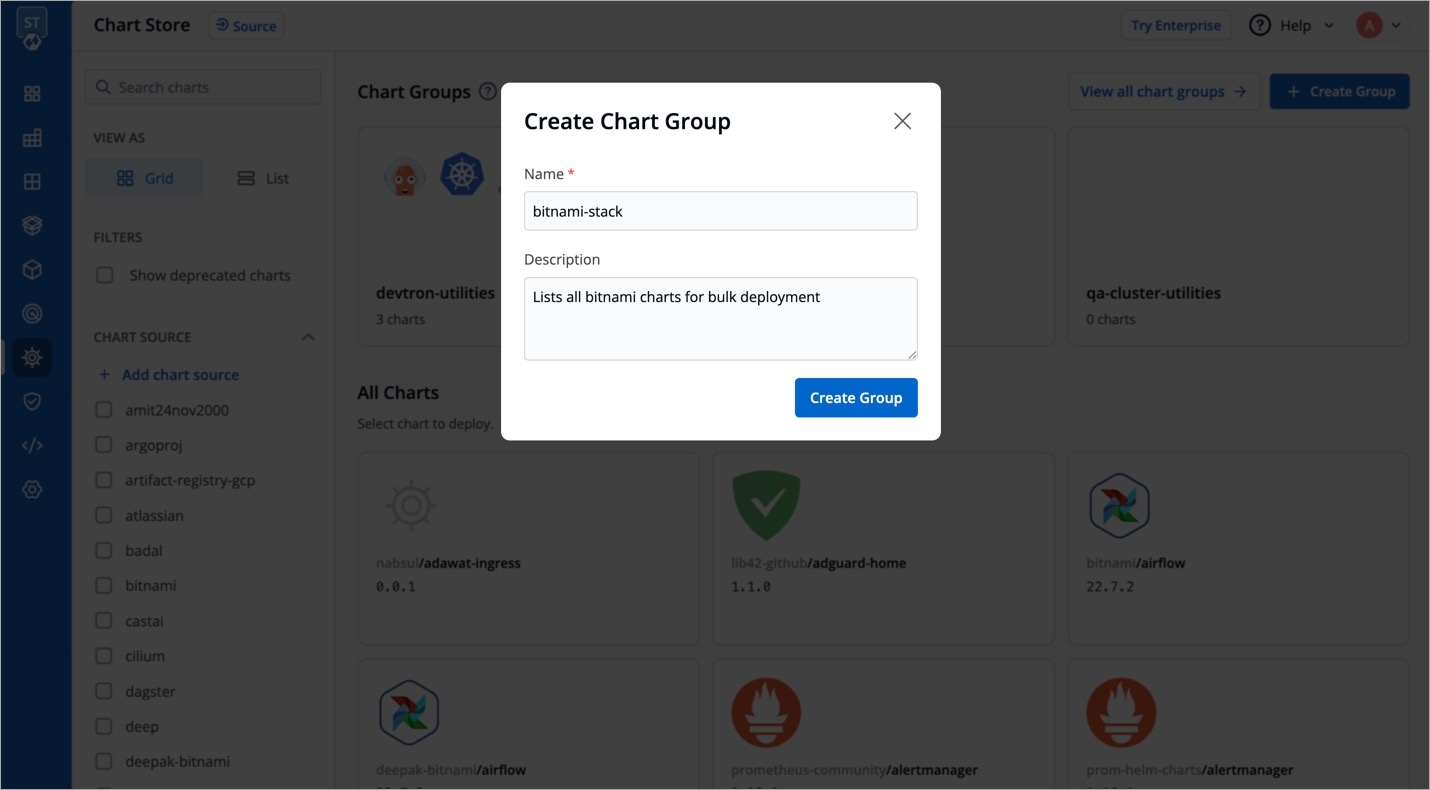
Once you create the group, you can now select and add the charts to this chart group.
2. Add Charts To Group
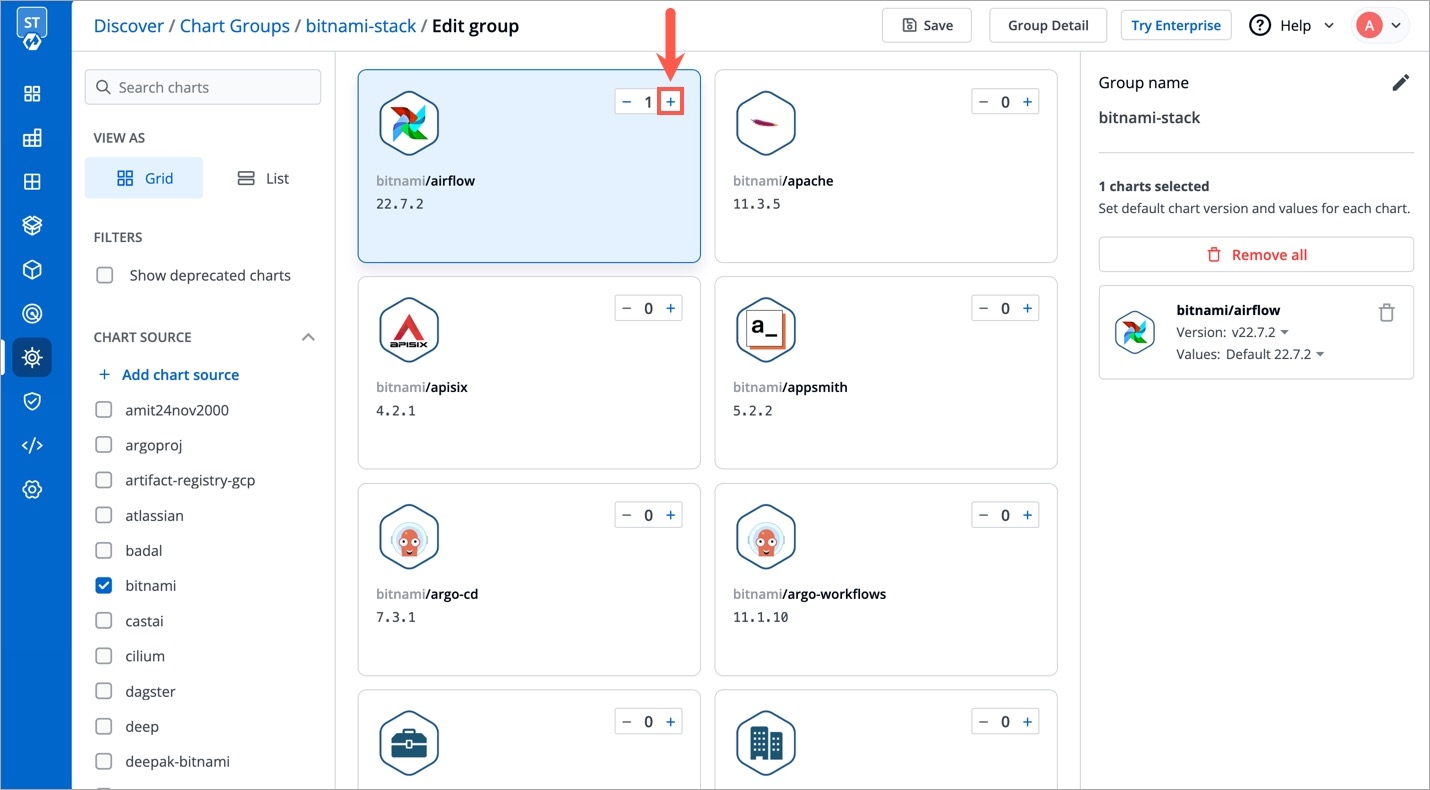
To add a chart to the group, click the
+sign at the top-right corner of a chart, and then selectSave.
Click on
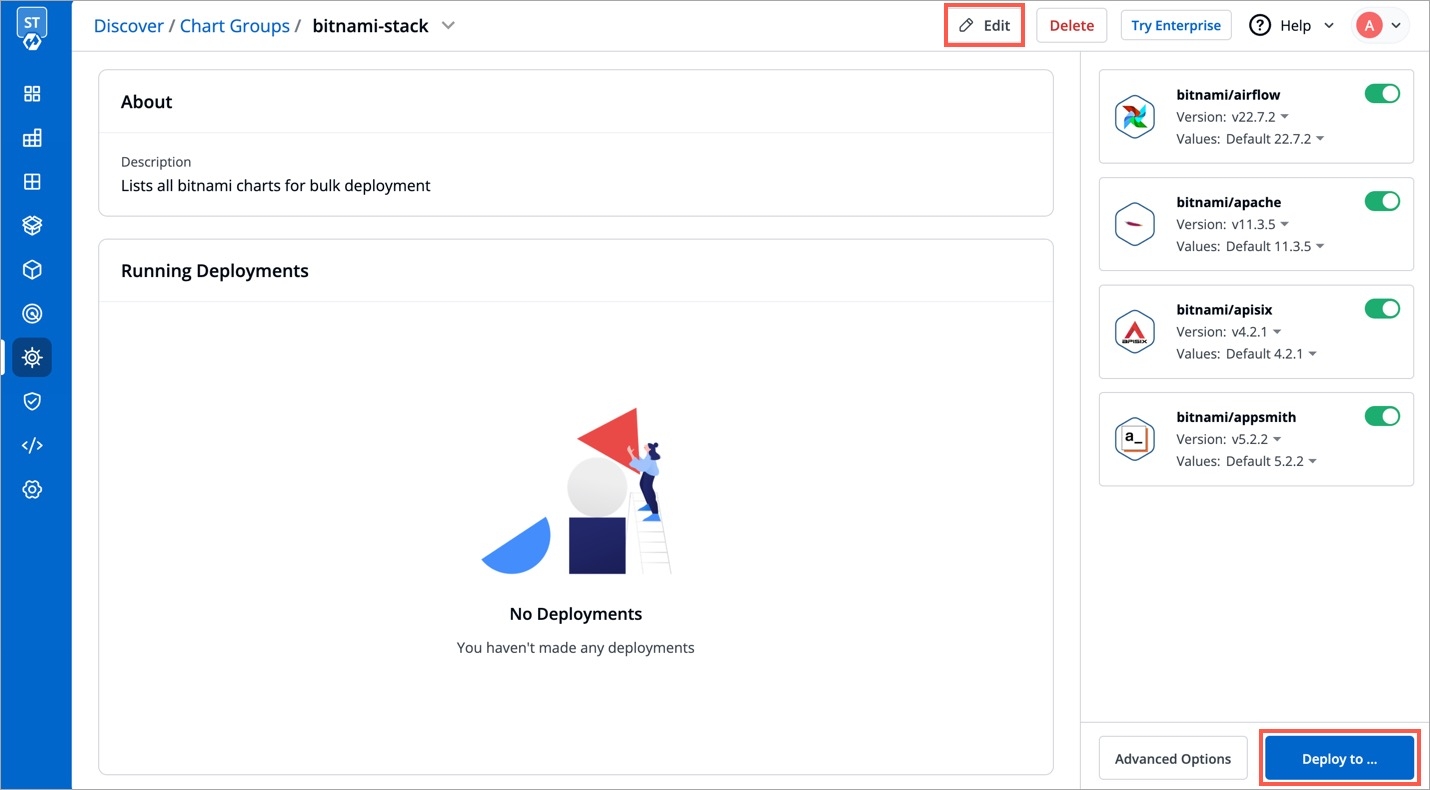
Group Detailto see all the running instances and group details. You can also edit the chart group from here.
3.Bulk Deploy and Edit Option for Charts
You can see all the charts in the chart group in the right panel.
Select
Deploy to...
In the
Deploy Selected Charts, select theProjectandDeploy to Environmentvalues where you want to deploy the chart group.
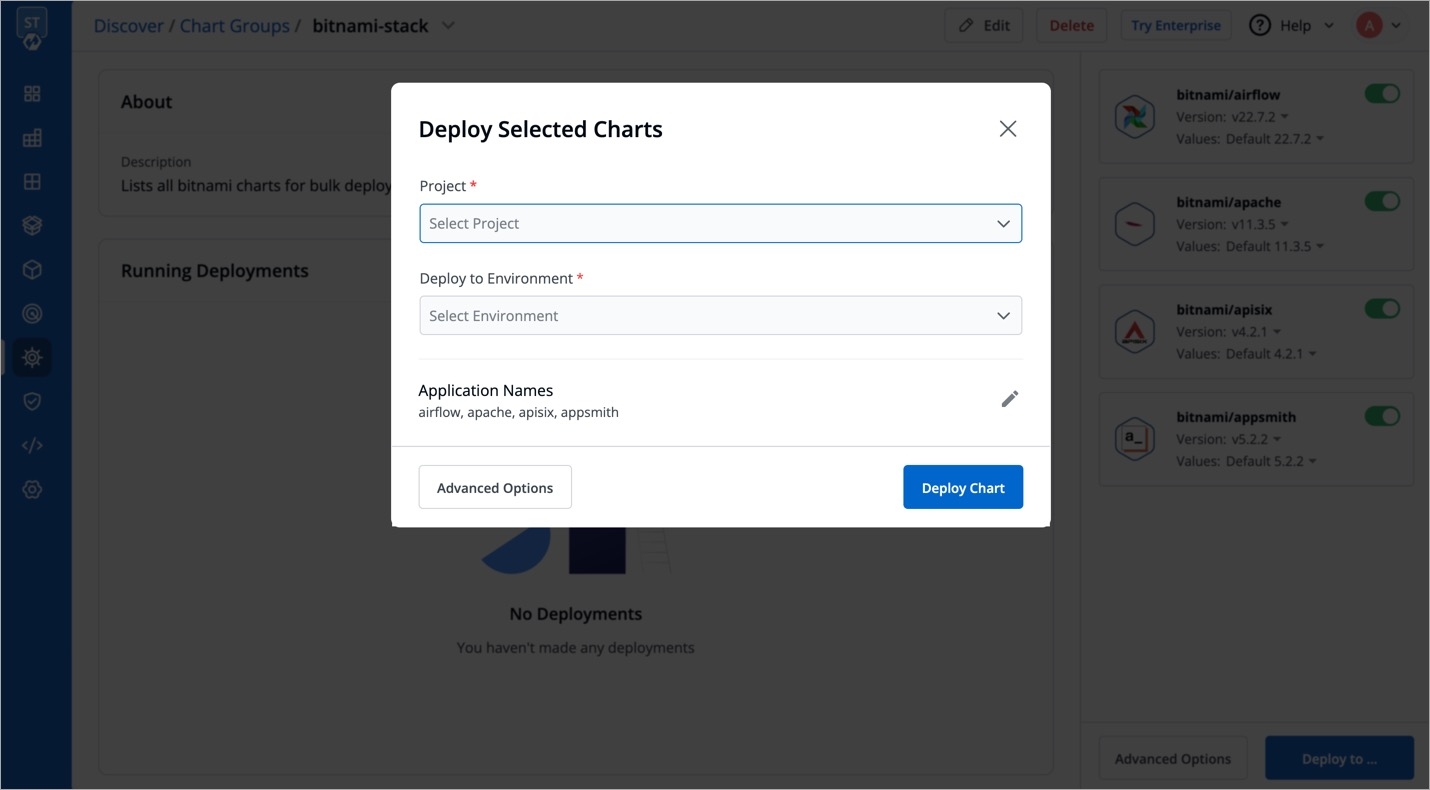
Select
Advanced Optionsfor more deploy options, such as editing thevalues.yamlor changing theEnvironmentandProjectfor each chart.
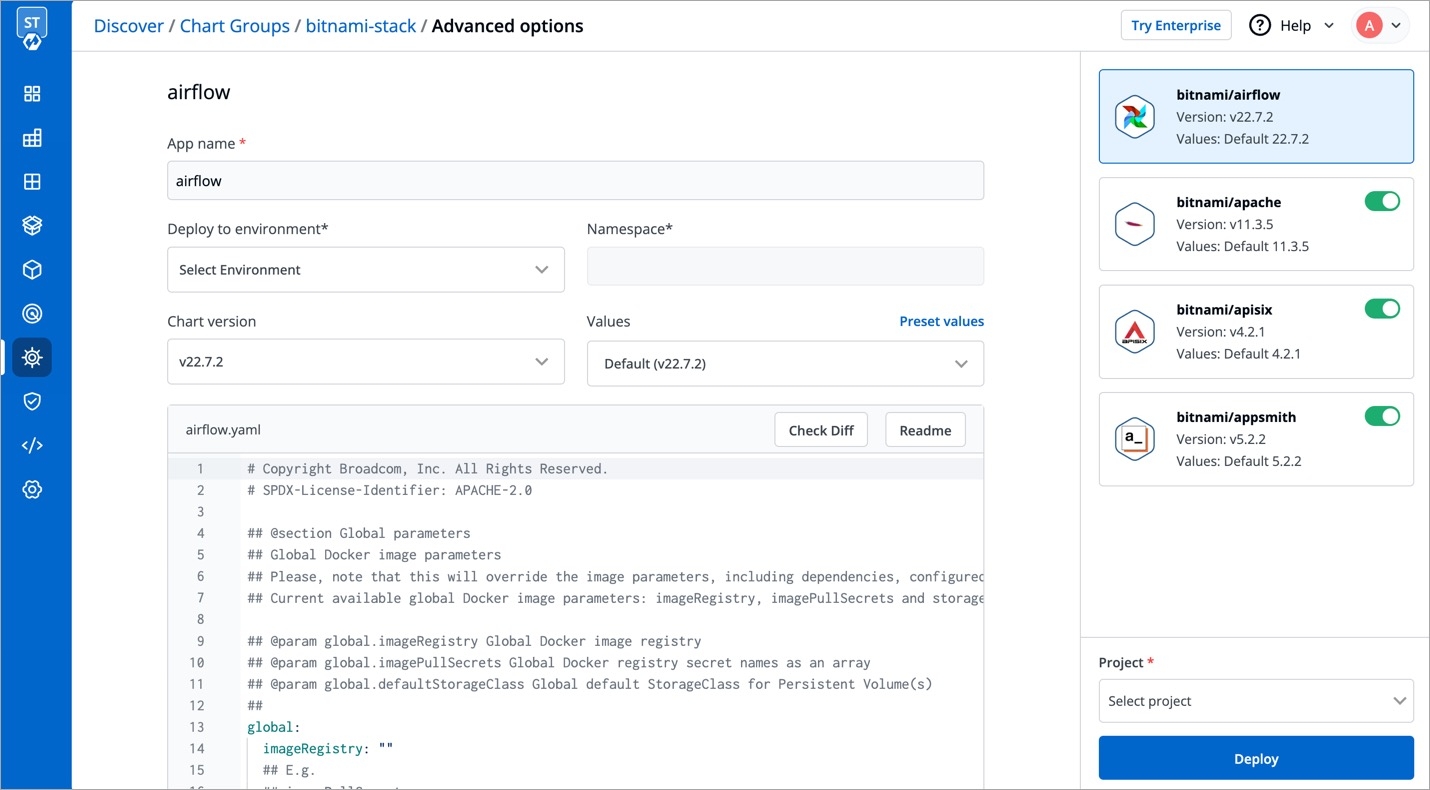
Last updated
Was this helpful?

