

Run History
The run history allows you to review every execution of job pipelines. Here you can review who triggered each pipeline, when it started executing and finished, and whether it succeeded or failed. It also allows you to inspect logs for each execution.
Accessing Run History for Specific Pipeline
Who Can Perform This Action?
Users need to have the Admin role or the Super Admin role. Refer the User permissions.
Either you have just executed the job and want to inspect the live execution, or you just want to check previous executions of a job pipeline
Navigate to the Run History tab of your job, and all the executions will appear in a reverse chronological order under the pipeline name. In case you have configured multiple job pipelines within a job, you need to select the pipeline from the Select Pipeline dropdown in the top-left corner.

Figure 1: Selecting Pipeline Select the specific execution you want to inspect. By default, the latest execution is selected.

Figure 2: Selecting Specific Execution After selecting the execution, the right section of the page will display the details about that particular execution.
FieldDescriptionTriggeredShows the date, time, user, and commit ID that initiated this run.
EnvironmentIndicates which execution environment (e.g., devtron-ci) was used for this job.
Execution startedTimestamp marking when the job actually began running.
Execution succeededTimestamp marking when the job finished successfully.
Worker statusFinal outcome of the worker performing the job (e.g., Succeeded or Failed). On failure, the error message is also shown

Figure 3: Execution's details
Apart from these details, you can also inspect logs, source code, security, and download artifacts (if any).
Logs
In the logs tab, you can inspect logs for each pipeline stage and task along with their runtime.
Use the
Search logsearch bar to search specific keywords or errors.You can expand/collapse each pipeline stage to view specific logs related to that stage. Use the
Expand/collapse all stagesbutton near the search bar to expand or collapse all stages at once.Select the fullscreen button in the bottom-right corner to view logs in fullscreen.

Figure 4: Logs
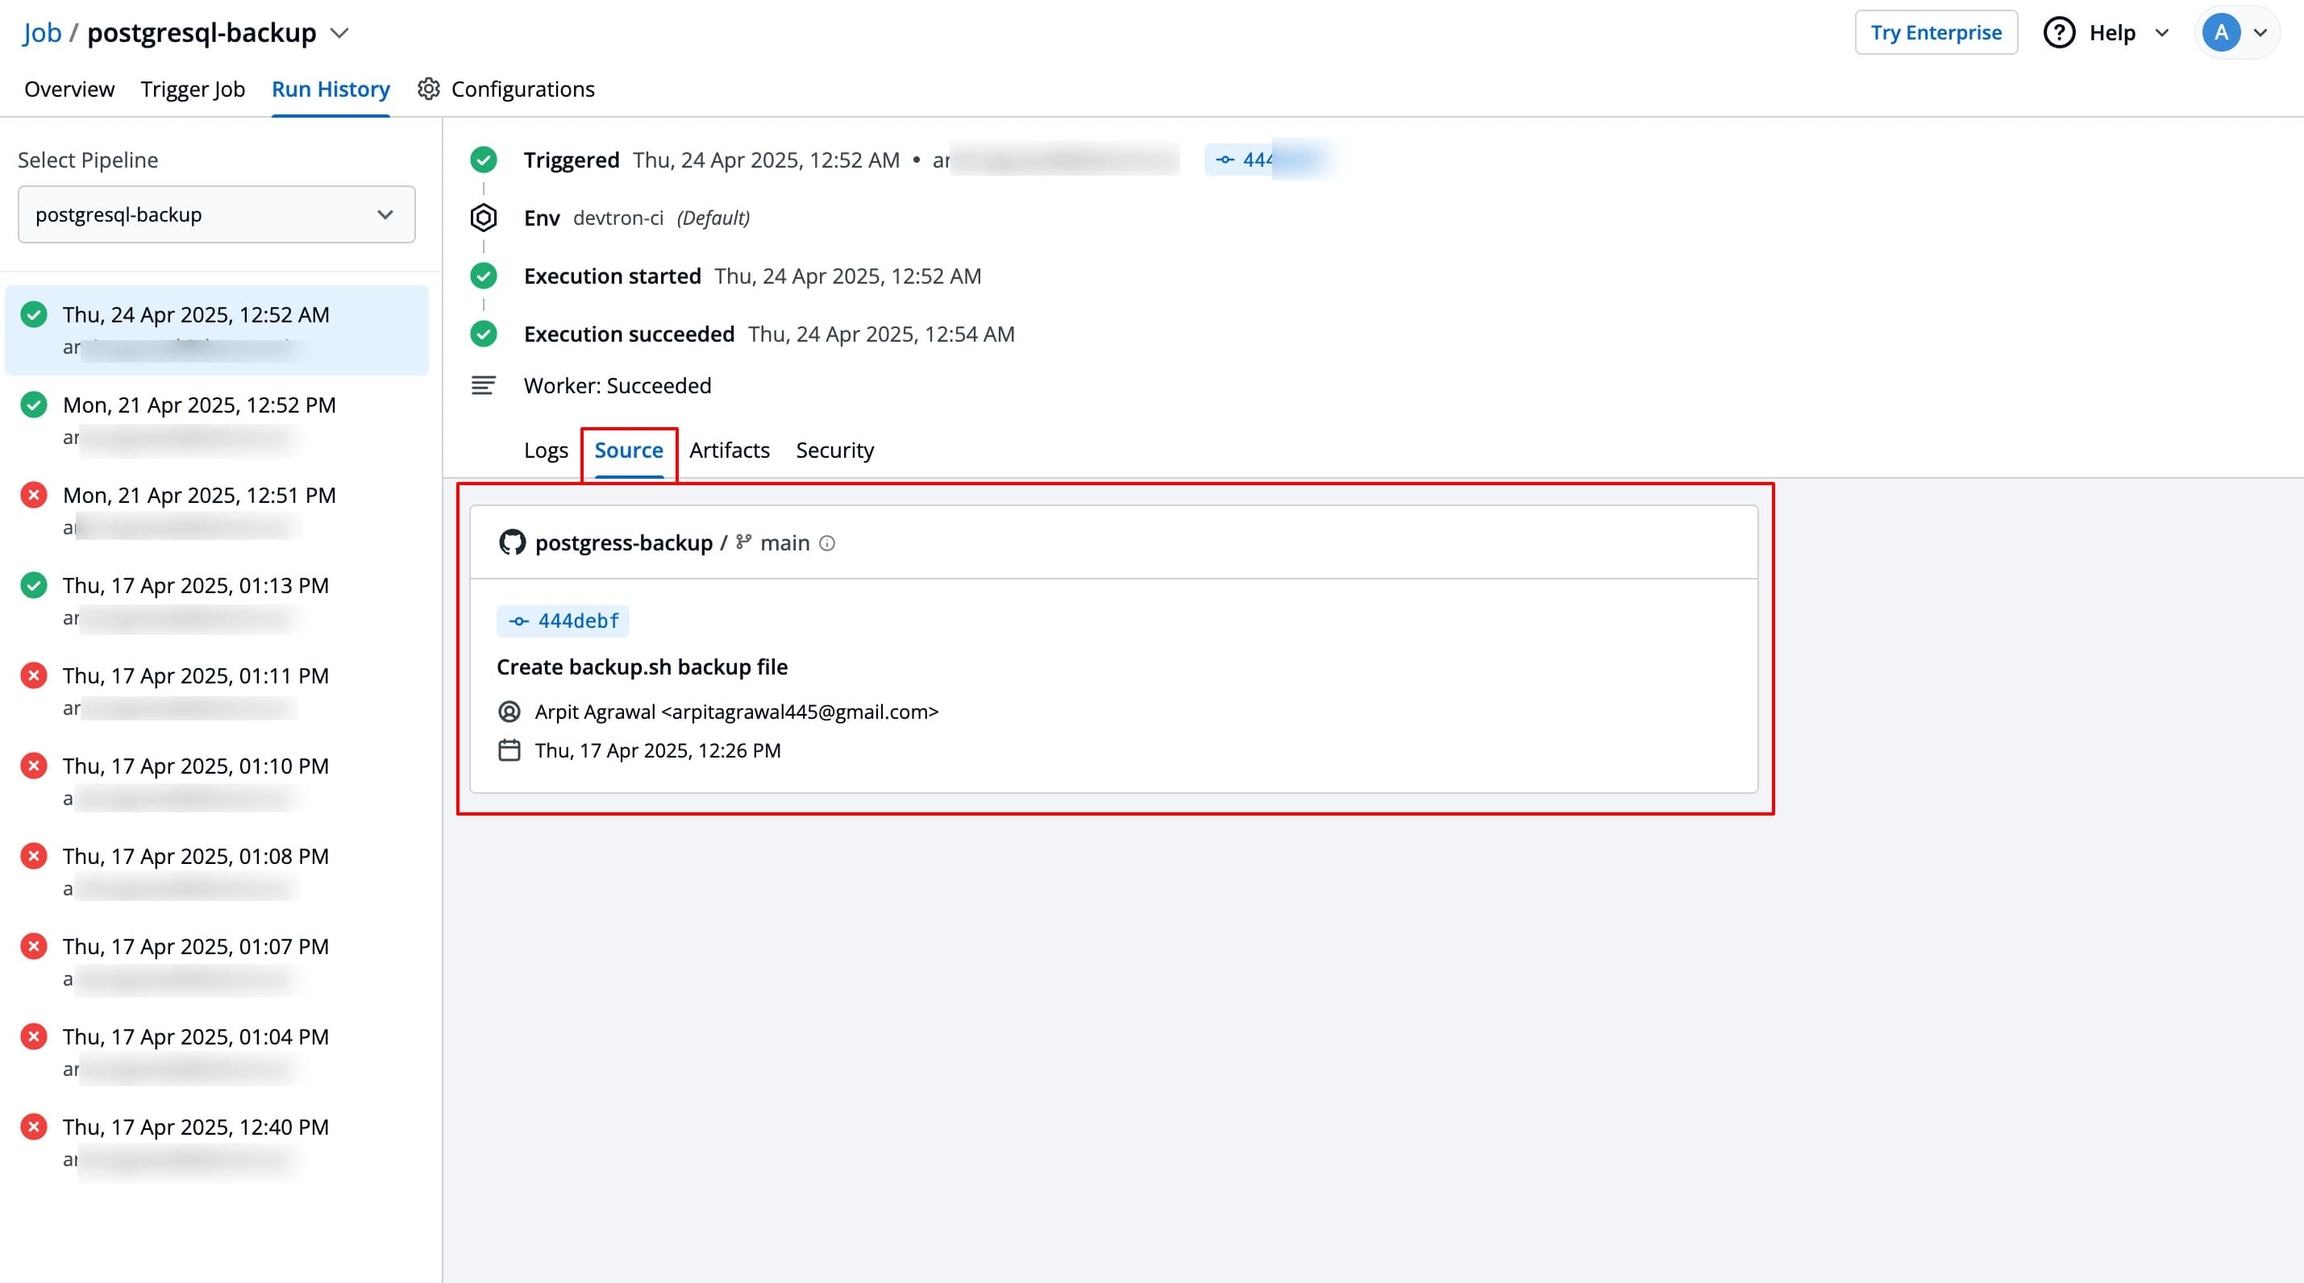
Source
The source tab shows which commit is from the source code (configured Git repository) that is used to execute the job pipeline. It shows the following commit details:
Repository name & icon
The Git repo used with its provider logo
Commit hash
A short, clickable commit ID (e.g. 443vecd) that opens the full commit details when clicked.
Commit message
Commit message used while pushing that commit
Author
Name & email of the committer.
Date & time
When that commit was authored
Artifacts
The Artifacts tab shows all archives or files your job has produced such as backup binaries, reports, log bundles and let you download them for inspection or further use your job has produced.
Security
The Security tab provides a view of vulnerability scanning results for code, the container images used or built during the job execution. It appears when a security scan plugin (e.g., Trivy via the Code Scan plugin) is integrated into your job pipeline.
After inspecting the run history, you can also set up the Job Overview so that others can easily know more about the job.
Last updated
Was this helpful?