Troubleshooting
Last updated
Was this helpful?


Last updated
Was this helpful?
We always try to make your experience of using Devtron as smooth as possible but still if you face any issues, follow the troubleshooting guide given below or join our if you couldn't find the solution for the issue you are facing.
This occurs most of the time because any one or multiple jobs get failed during installation. To resolve this, you'll need to first check which jobs have failed. Follow these steps:
Run the following command and check which are the jobs with 0/1 completions:
Note down or remember the names of jobs with 0/1 completions and check if their pods are in running state still or not by running the command: kubectl get pods -n devtroncd
If they are in running condition, please wait for the jobs to be completed as it may be due to internet issue and if not in running condition, then delete those incomplete jobs using: kubectl delete jobs -n devtroncd
Now download migrator.yaml file from our github repository using the command:
Now edit the file you downloaded in step 3 and remove the postgresql-migrator secret resource creation and then apply the yaml file using the command: kubectl apply -f migrator.yaml -n devtroncd
It will re-create the failed jobs and you’ll see their pods created again. Just wait for a few minutes until the jobs gets completed then you are good to go. You should be able to save your global configurations now.
Update the rollout crds to latest version, run the following command:
error: user/UserAuthHandler.go:236","msg":"service err, AuthVerification","err":"no token provided Or error: Failed to query provider "api/dex": Get "api/dex/.well-known/openid-configuration": unsupported protocol scheme
Delete devtron pod once to reload the configurations using:
Check if the pods are being created when you start a new build, run the command and look if a new pod is created when you started the build:
If yes, delete kubewatch and devtron pod so that kubewatch can restart and start sharing the logs again:
Wait for 5 minutes and then trigger a new build again, if still not resolved then run the following commands one by one
Again wait for 5 minutes and your issue should be resolved
If the graphs are not visible check if prometheus is configured properly. Then go to Global Configurations > Clusters & Environments > Click on any environment for the cluster where you added prometheus endpoint and simply click Update.
If the charts are still not visible, try visiting the url: /grafana?orgId=2
If you see Not Found on this page, then follow all the given steps or if the page is accessible and you are getting panel with id 2 not found then follow from step 6:
Get grafana password using kubectl -n devtroncd get secret devtron-secret -o jsonpath='{.data.GRAFANA_PASSWORD}' | base64 -d
kubectl run --rm -it --image quay.io/devtron/k8s-utils:tutum-curl curl Run this command and it will create a pod for using curl
Copy the following and change grafana-password with your password of grafana and change the value of prometheusUrl with your prometheus endpoint
and run in the pod that we created above in step 2. 4. Now visit /grafana?orgId=2 again and you'll see grafana login page. Login using username admin and password from step 1 and check if prometheus url is updated in datasources. If not, update it in the default datasource. 5. Now from devtron UI, update any of the environment again and it's datasource will be created automatically. 6. In Grafana UI you need to be logged in and Go to Dashboards > Manage then click Import and Import the given dashboards one by one.
After that, your issue should be resolved and you should be able to see all the graphs on UI.
If you are not able to login into Devtron dashboard even after giving the correct password, it is possible that the argocd token of previous session has been stored in the cookies and is not able to override the new token that is generated for the new session. If you are facing this issue, follow the steps below -
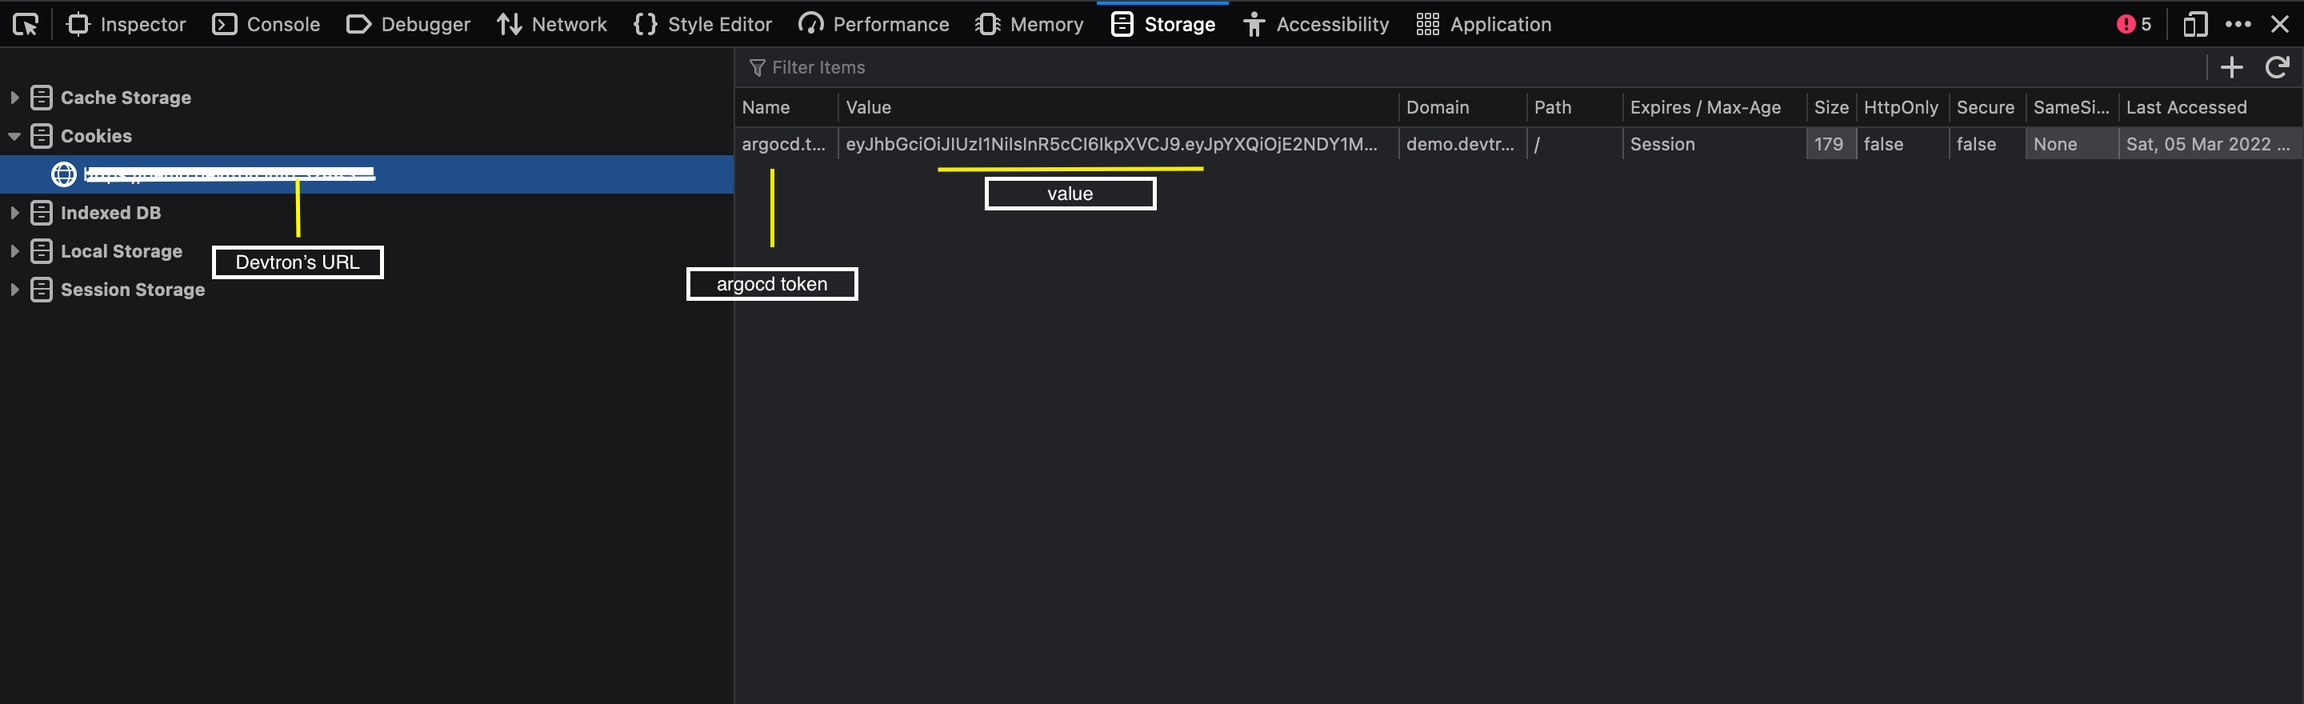
If using Firefox -
Goto login page of Devtron and open inspect.
Navigate to storage tab in inspect.
Click on url where Devtron has been installed under Cookies tab and you could see an argocd token with its value, something similar to below image.
Now right click on token, and click on Delete All Session Cookies option.
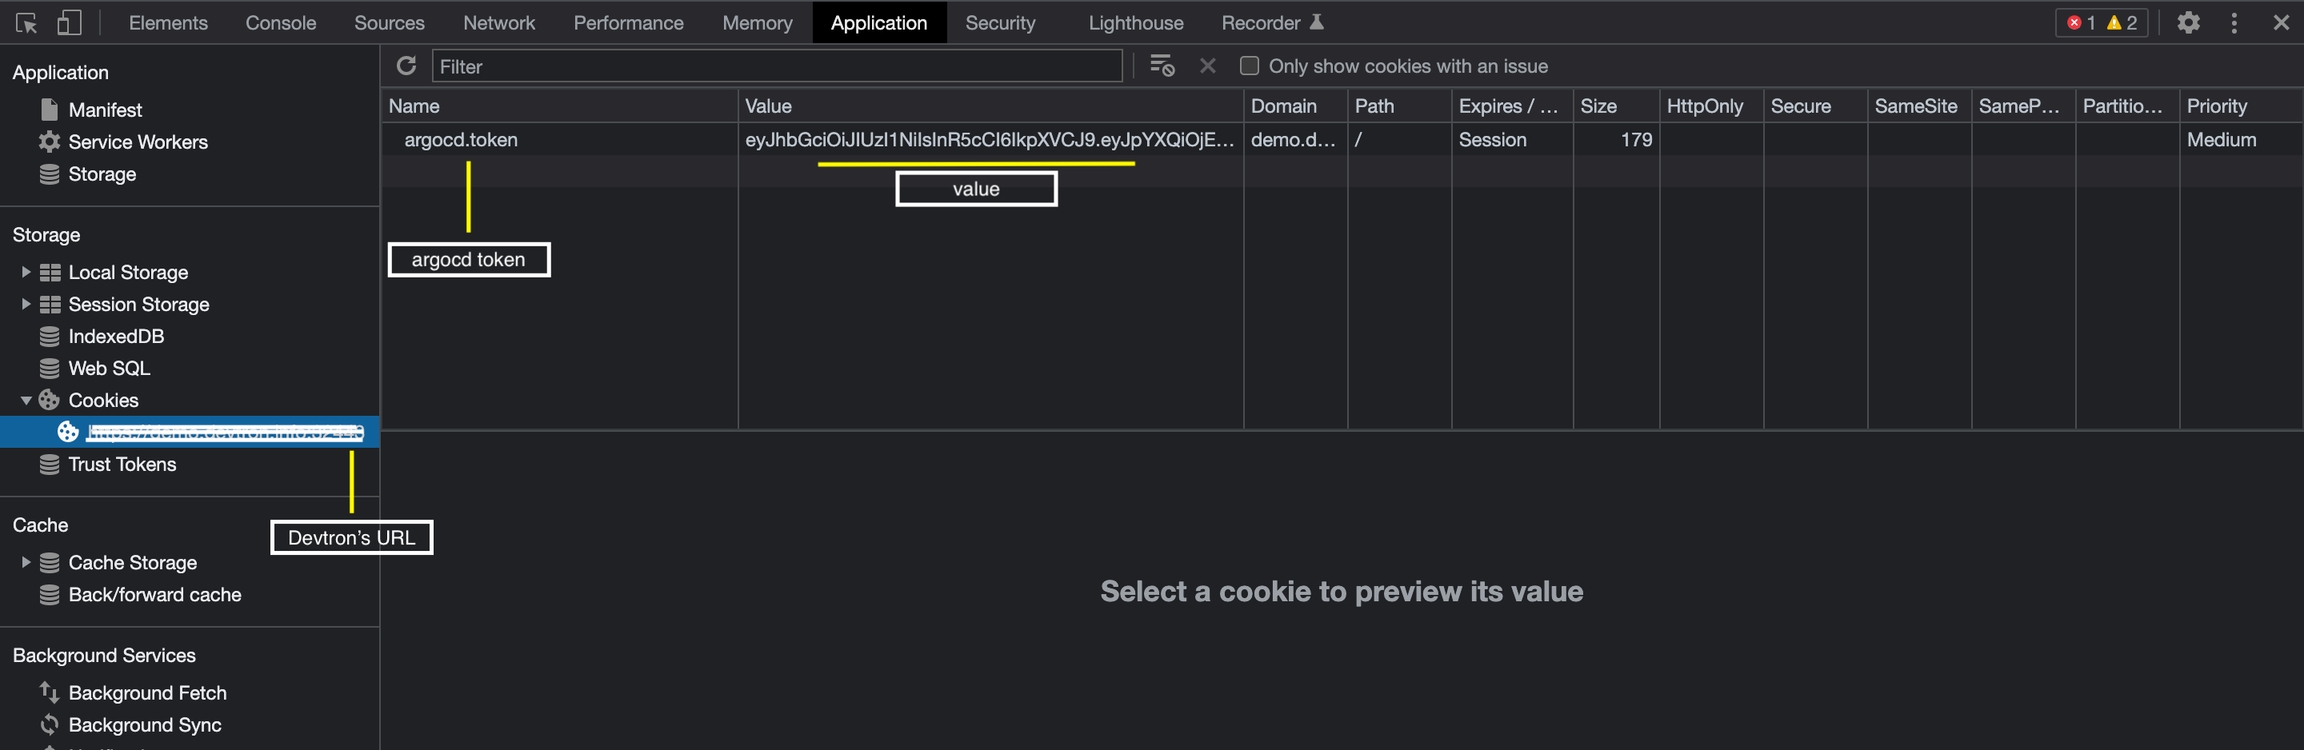
If using Chrome -
Goto login page of Devtron and open inspect.
Navigate to Application tab, and under Storage tab click on Cookies.
Click on url under Cookie and you would be able tto see an argocd token with its value, as shown in the image below.
Now right click on token and click on delete option.
If using Safari -
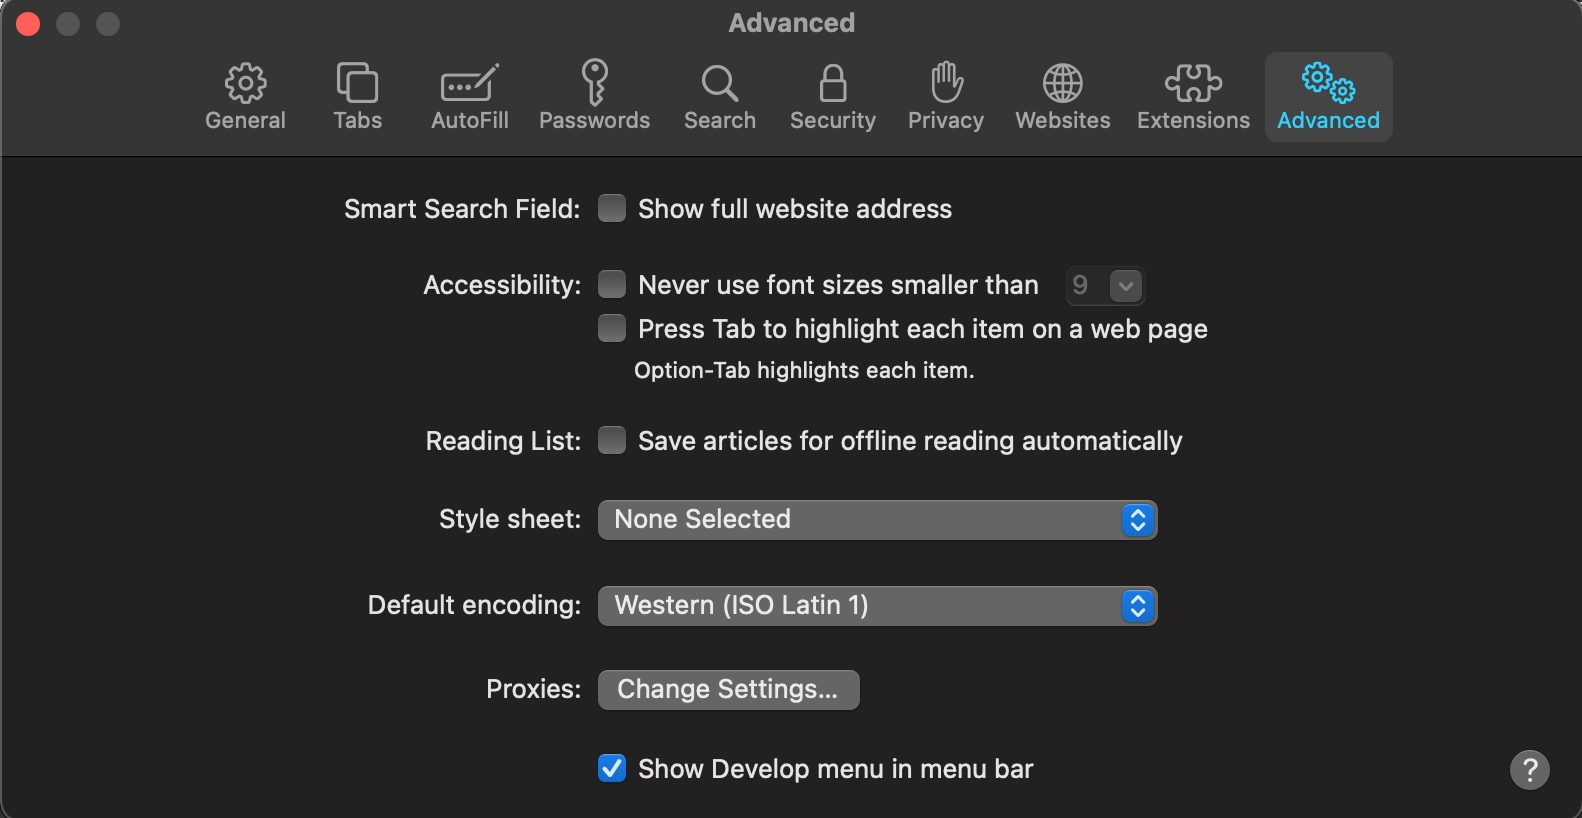
Goto Safari preferences >> Advanced options and check the show develop menu as shown in the image below.
Now goto login page of Devtron and press option+command+I. It will open inspect element.
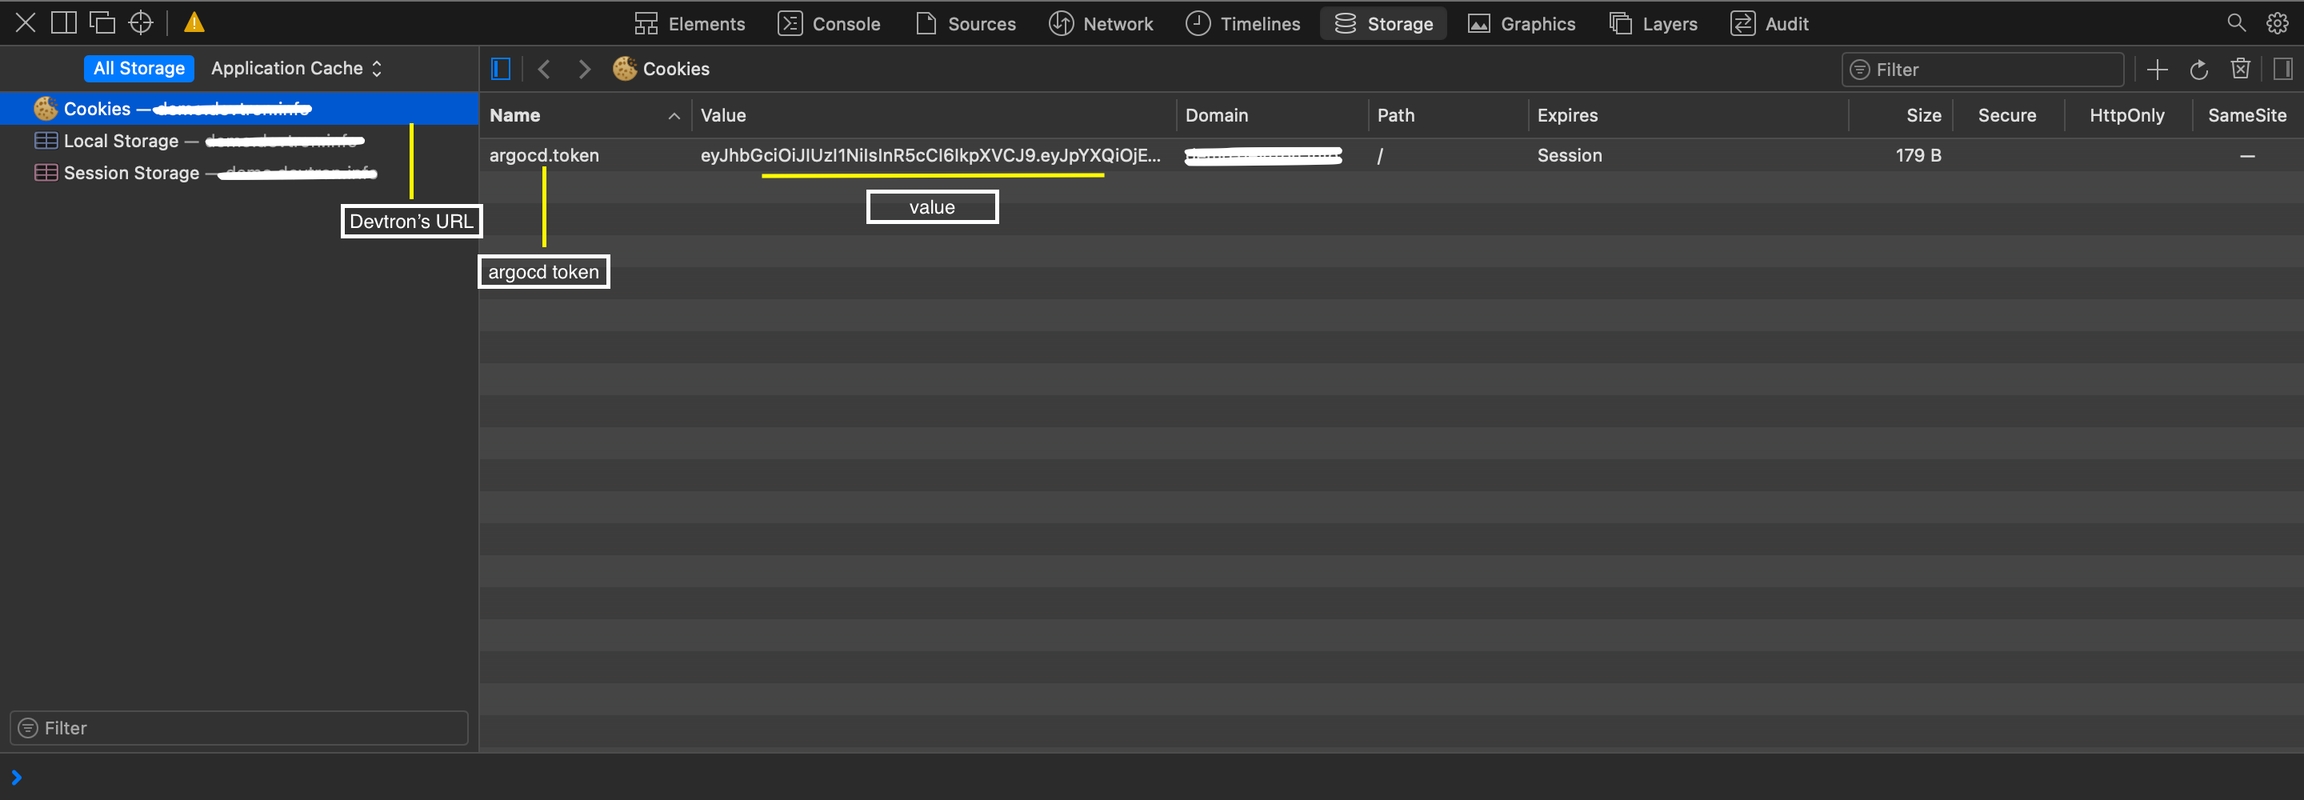
Then navigate to Storage, click on Cookies and you would be able to see an argocd token with its value as shown in the image below.
Now right click on token and select delete option.
After clearing Cookies, try again to login, you should be able to login now.
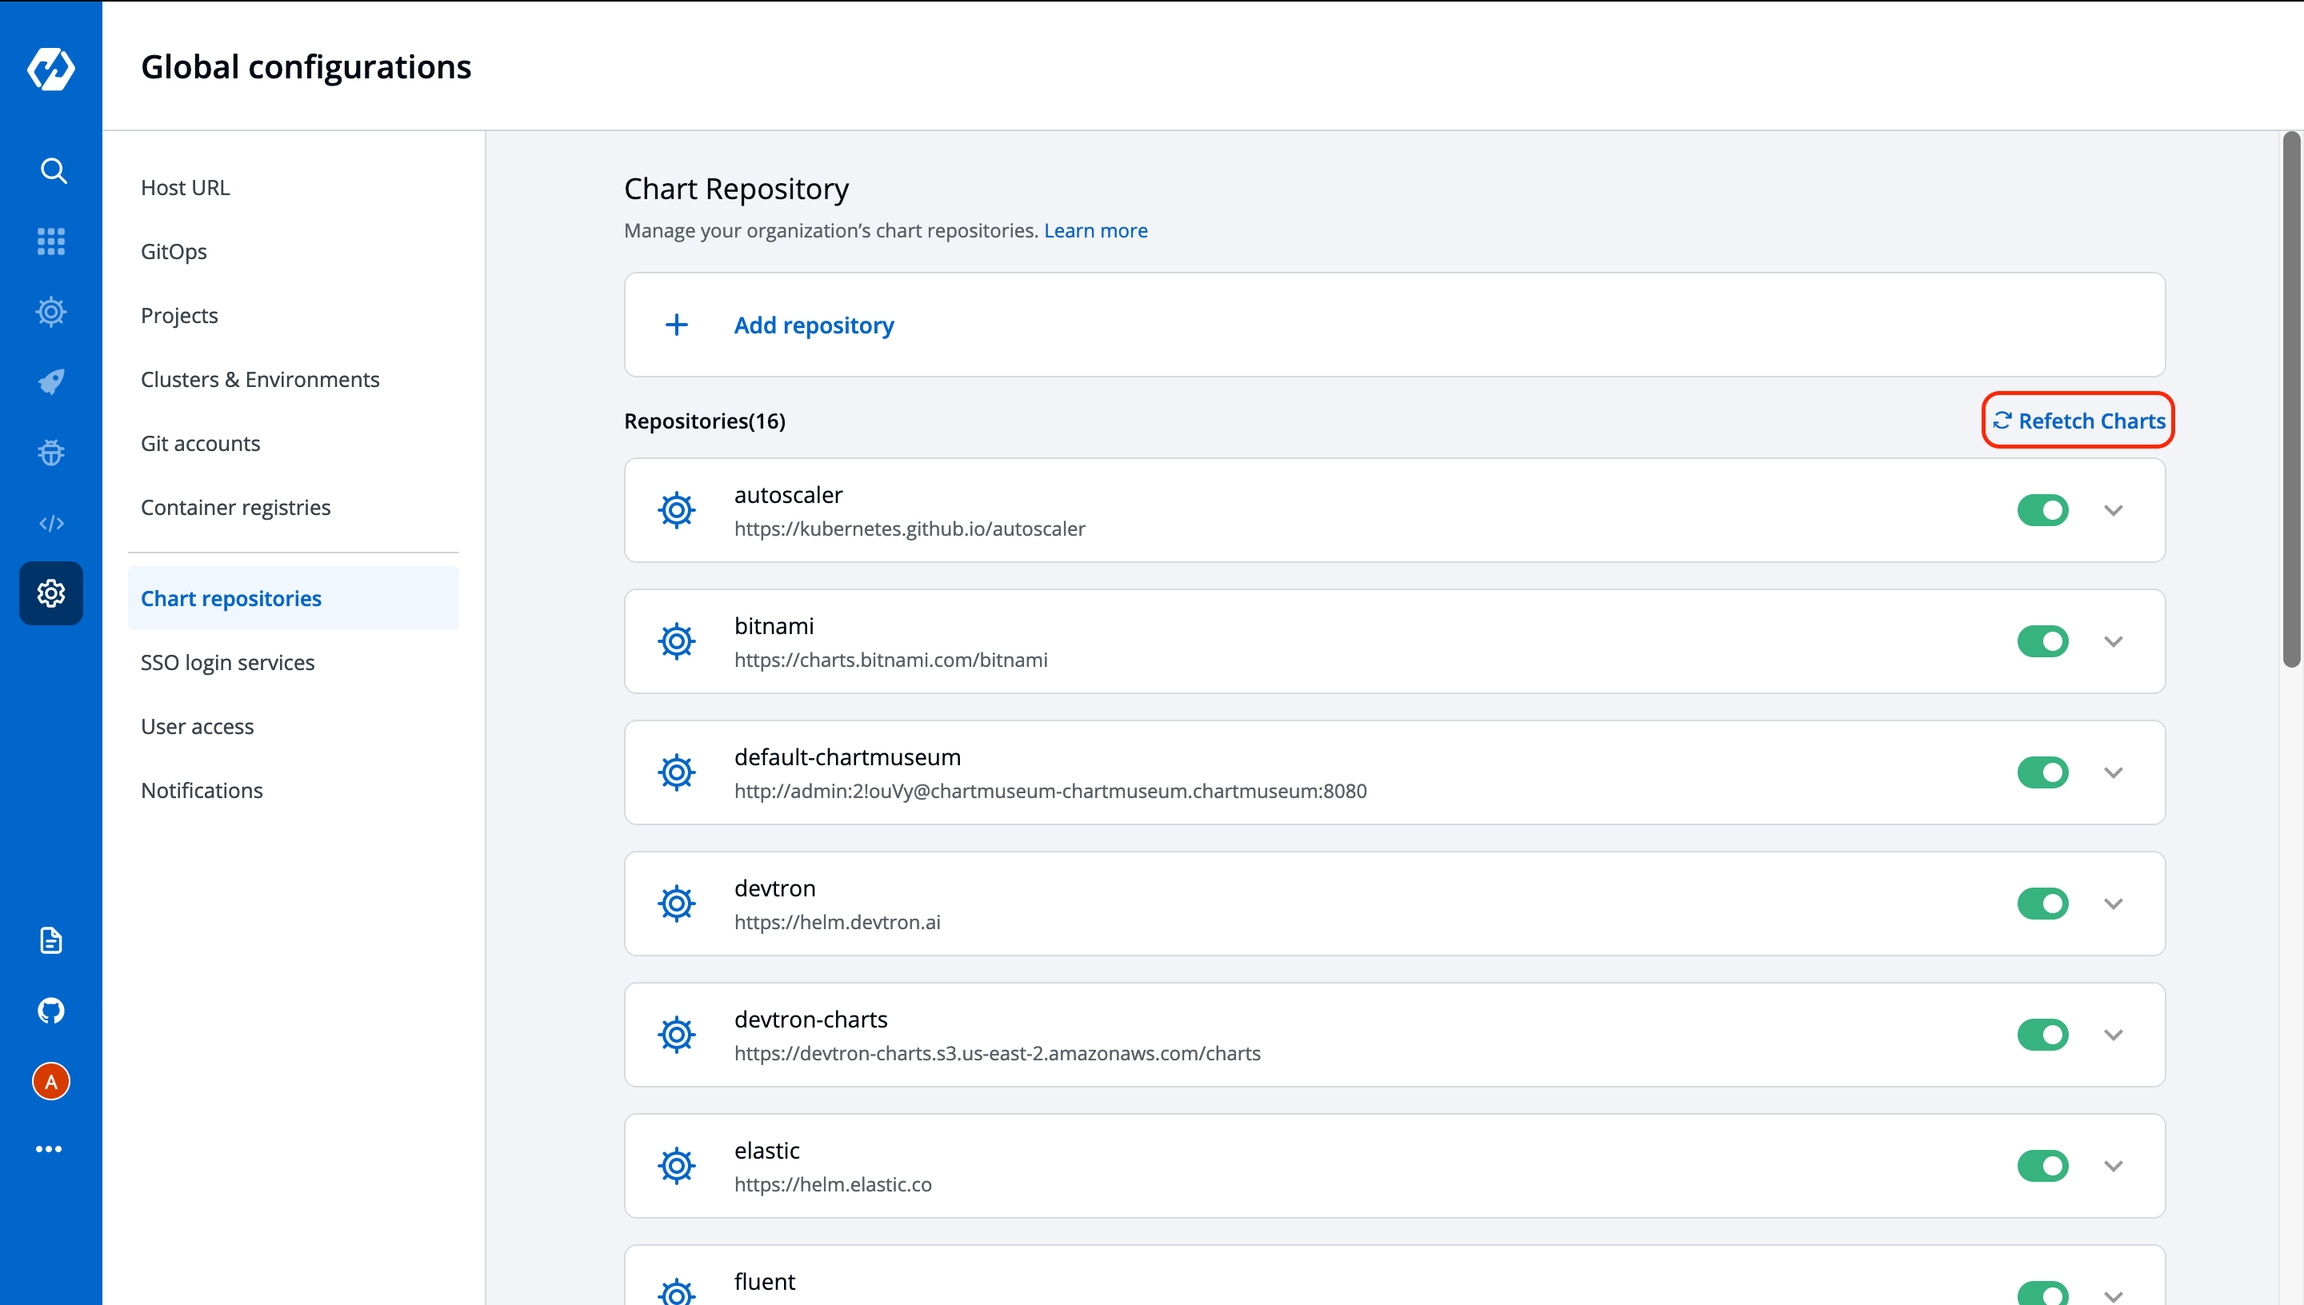
In the Devtron's Discover Chart section, if you are not able to see any charts available, goto Global Configuration >> Chart Repositories and click on Refresh Chart at the top-right as shown in the image below. After clicking the button, it might take 4-5mins to show all the charts in Discover section depending upon the chart repositories added.
In Global Configurations >> Cluters & Environments, if you try to update a cluster which has been already added in Devtron, you might get an error as {"message":"Failed to update datasource. Reload new version and try again"}. If you are facing such issue, please follow the following steps -
Edit the changes you want to make in respective cluster
Click on save after making changes and you may get error message stated above.
Go to cluster where devtron has been installed and execute - kubectl -ndevtroncd delete po -l app=devtron
Now refresh the page and you should be able to save it.
[Note: If you already have created some environments in that cluster, it needs to be updated again]
Then delete postgresql pod so that it can fetch the updated images:
You can also delete other pods which are in crashloop after postgresql is up and running so that they can restart and connect to postgresql and Devtron will be up and running again in a few moments.
To solve this, bounce the git-sensor-0 pod.
Whitelist the NAT-gateway IPs of the cluster (There can be multiple NAT-gateways if your cluster is multi-AZ)
Do the following:-
Go to Grafana and Login with the credentials.
Edit the CPU graphs and remove image!=”” from the query.
Save the dashboard.
CPU metrics should start showing up in a while.
Please use below annotation in ingress
Note:- Where m is MiB.
To solve
Disable certificate validation by passing --kubelet-insecure-tls argument to metrics server chart.
Description of issue
ERROR: database <db-name> is being accessed by other users
DETAIL: There is 1 other session using the database.
You have to terminate the connections to the database first, for that you can use the command.
Then run the command to delete database - drop databases <db-name>
Debug
Run the command for admin credentials and use it for login in dashboard:
If you are getting an error message of “invalid username or password”, follow the solution to solve it.
Solution:
Run kubectl get secret -n devtroncd and then edit the argocd-secret, remove both the admin.password lines.
Run kubectl delete po your-argocd-server-pod -n devtroncd, it will create a new pod after deletion and reset your admin password. Re-run the command for admin credentials again to get the new password.
Debug
'base64' is not recognized as an internal or external command, operable program or batch file.
Solution
The first way to debug is either install base64 encode and decode into your windows machine and use the appropriate cmd to get the admin password.
The other way is to get the password in the encoded form using the cmd
UPGRADE FAILED: cannot patch "postgresql-postgresql" while upgrading Devtron to newer versionsDebug:
Description of error
Solution: Verify if annotations & lables are set to all k8s resources in devtroncd namespace and add --set components.postgres.persistence.volumeSize=20Gi parameter in Devtron upgrade command.
There may be some other pods also in crashloop as they are not able to connect to database. To resolve this issue, you can either or run the following commands to fix instantly on the same version you are using:
kubectl -n devtroncd get secret devtron-secret -o jsonpath='{.data.ACD_PASSWORD}', further decode it into plaintext using an online .
Make sure to all the Devtron resources.