

Chart Store
Introduction
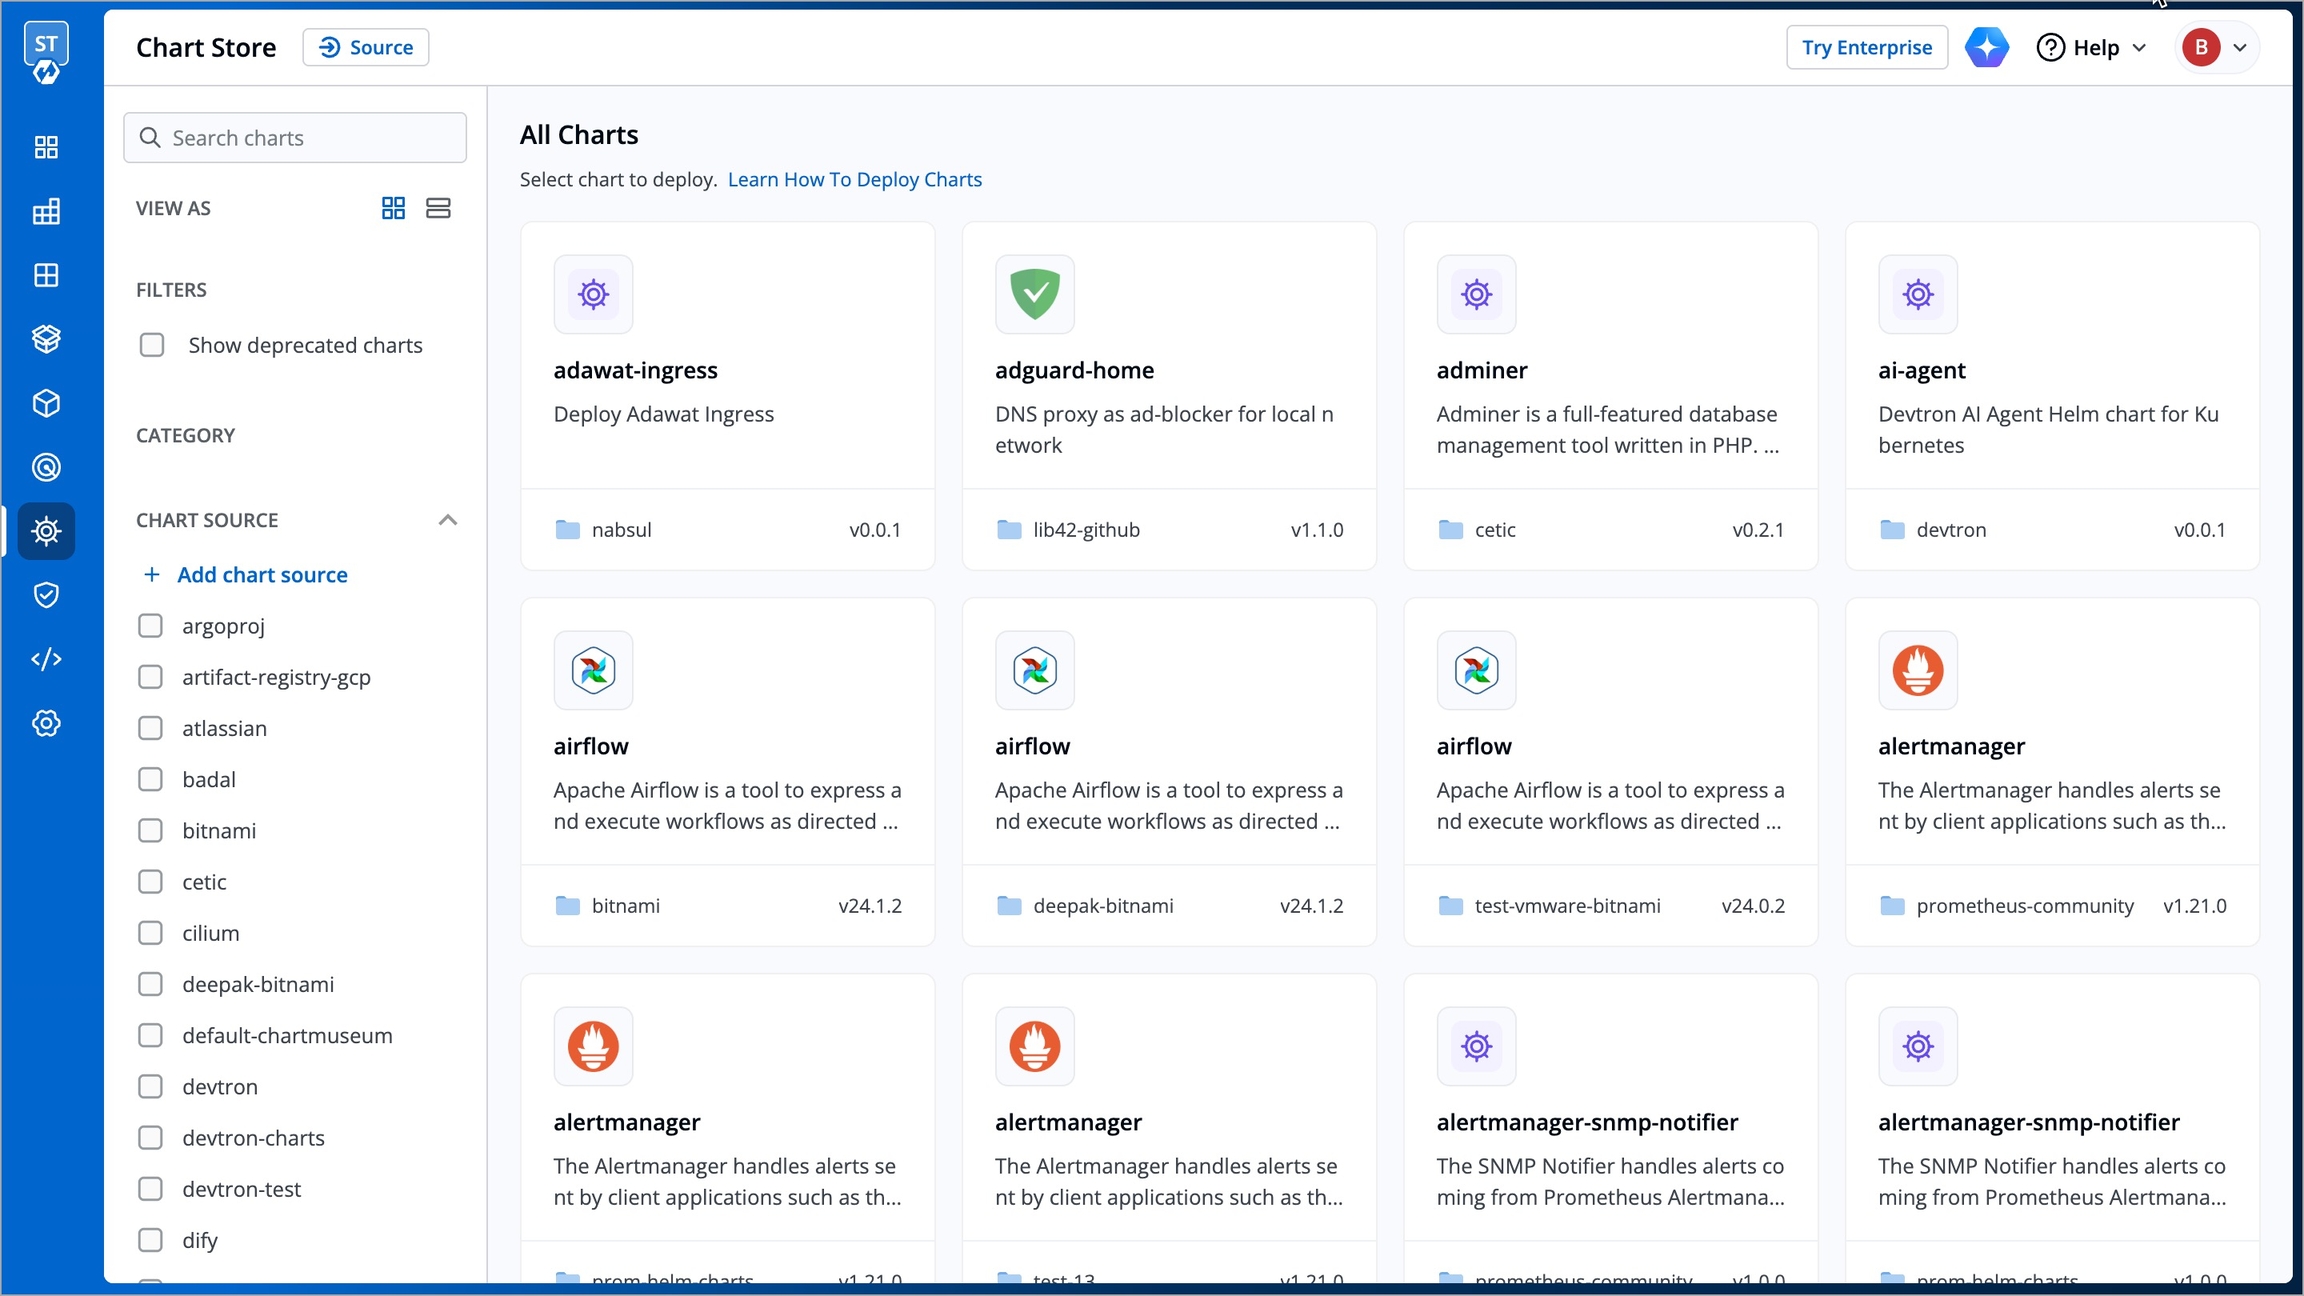
A Helm Chart is like a blueprint for deploying your application on Kubernetes. It contains all the necessary configuration files needed to define what and how your application should run. The Chart Store in Devtron offers a wide variety of helm charts from different sources for you to select and install based on your requirement. It helps you in managing and organizing charts in the same way an app store helps you manage apps.
Navigate to the Chart Store.
Fetch and Populate Charts
The Chart Store populates charts from two sources:
The chart repositories added to the Chart Repository section of the Global Configurations page.
The OCI registry (only if Use as chart repository checkbox is enabled) added to the Container/OCI Registry section of the Global Configurations page.
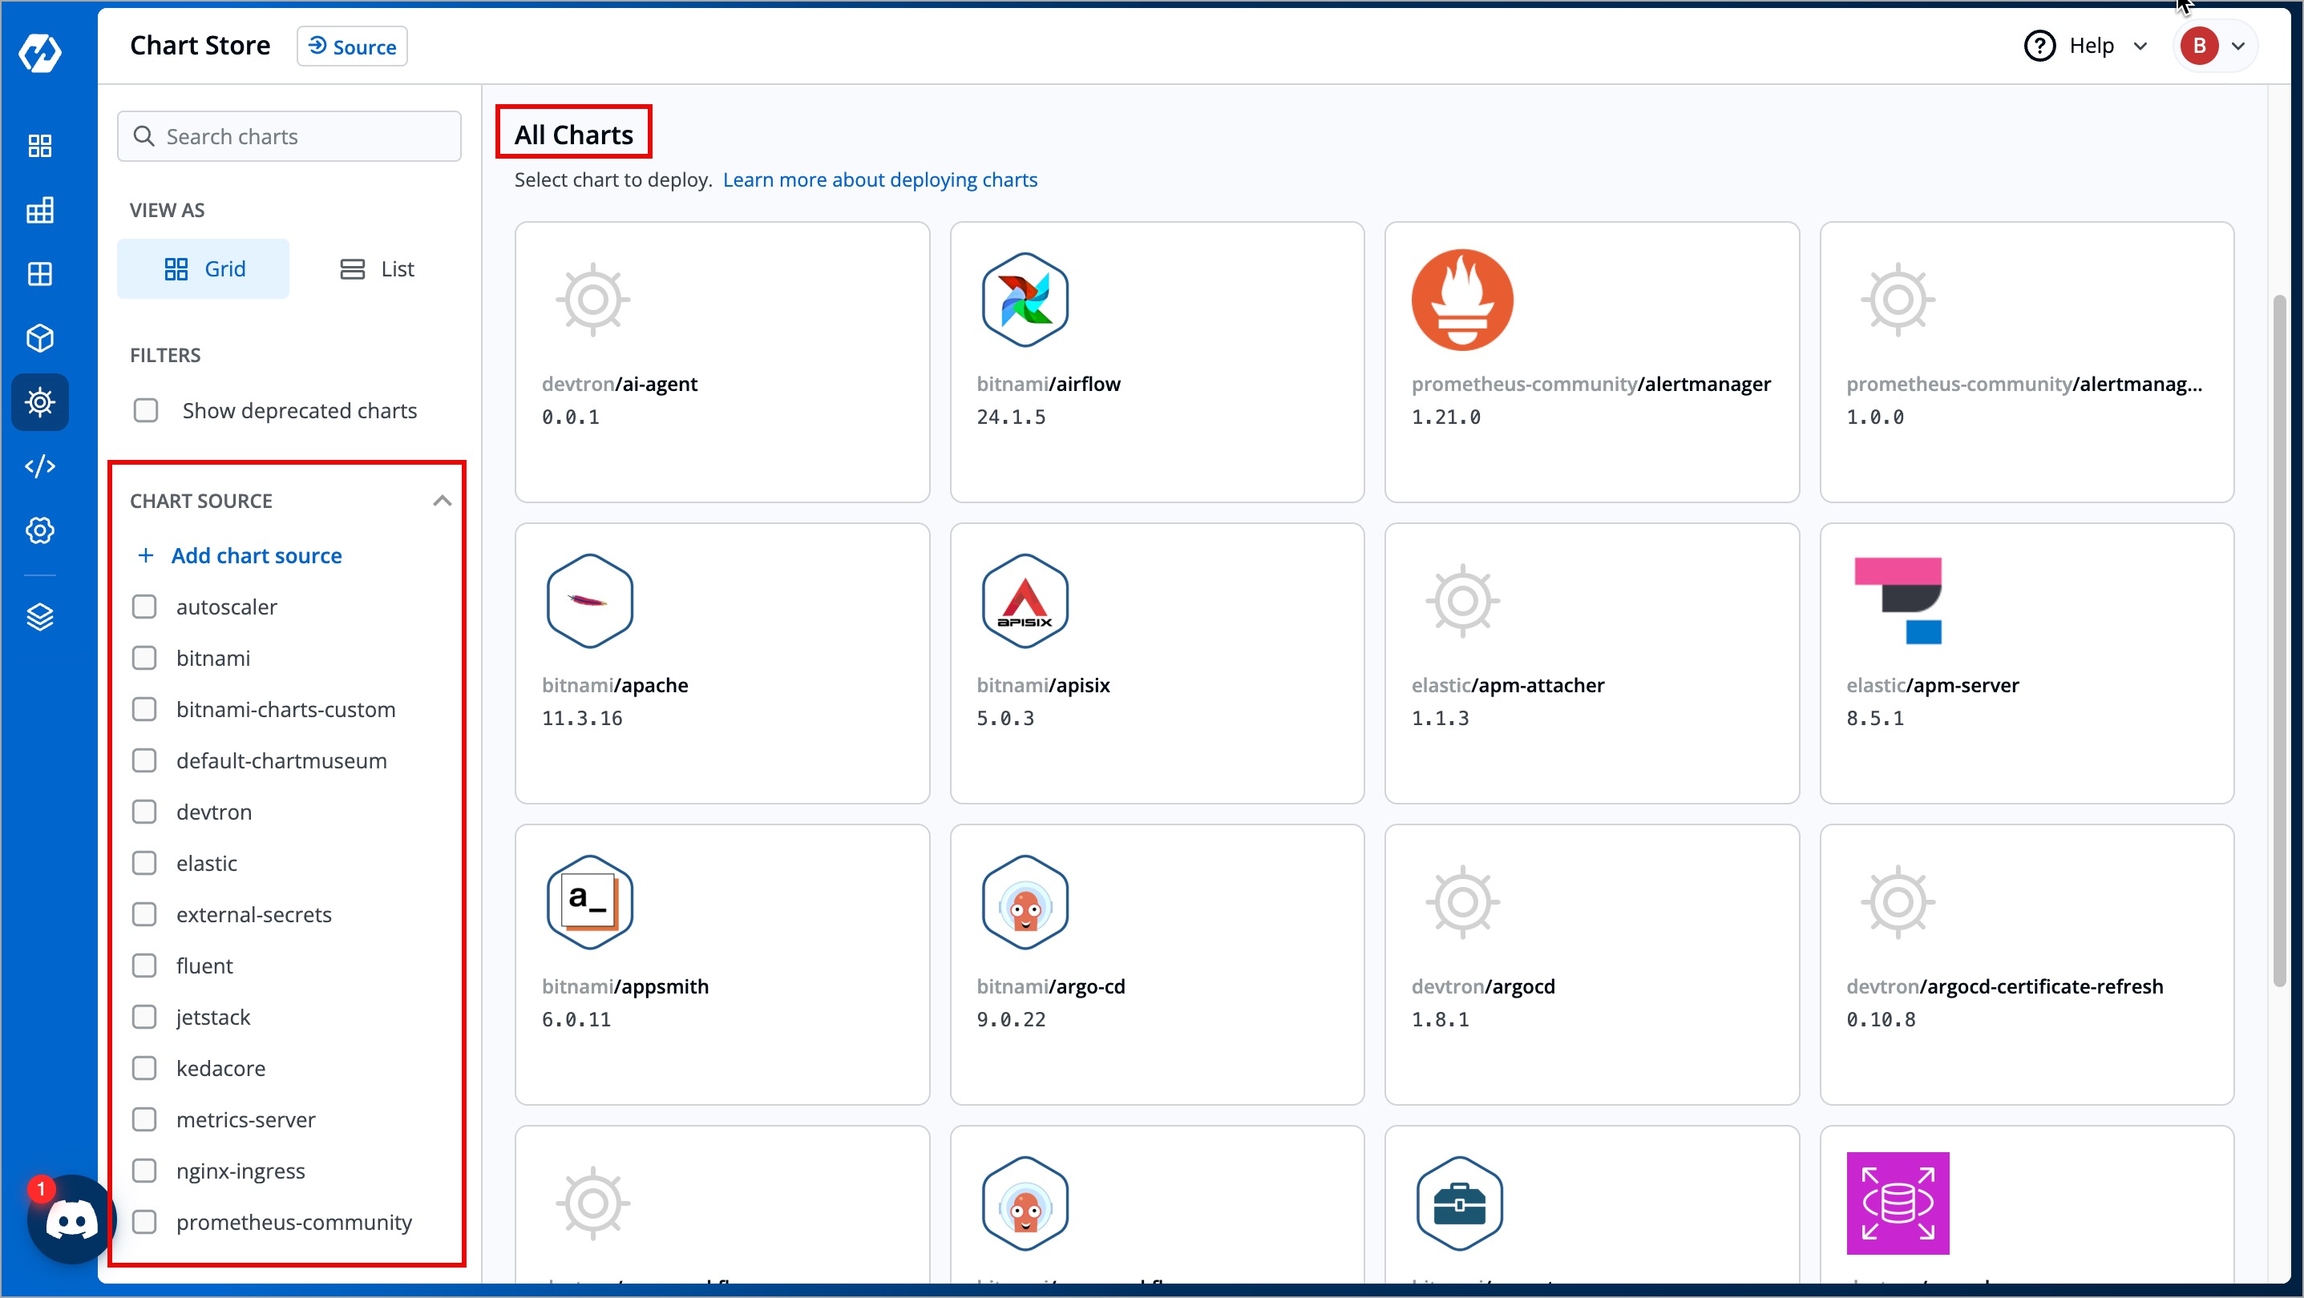
When you add a chart repository and/or an OCI registry, the sources along with the associated charts are automatically populated in the Chart Store. The chart sources are displayed in the Chart Source drop-down box, and the charts are displayed in the All Charts section.
Add a Chart Source
Who Can Perform This Action?
Only a Super Admin can add a chart source. The Source button in the Chart Store page is visible only to Super Admins.
To add a chart repository or an OCI registry as a chart source, follow the instructions below:
Navigate to Chart Store → Sources. The Helm chart sources section appears, displaying all helm chart sources.
Click the Add button.
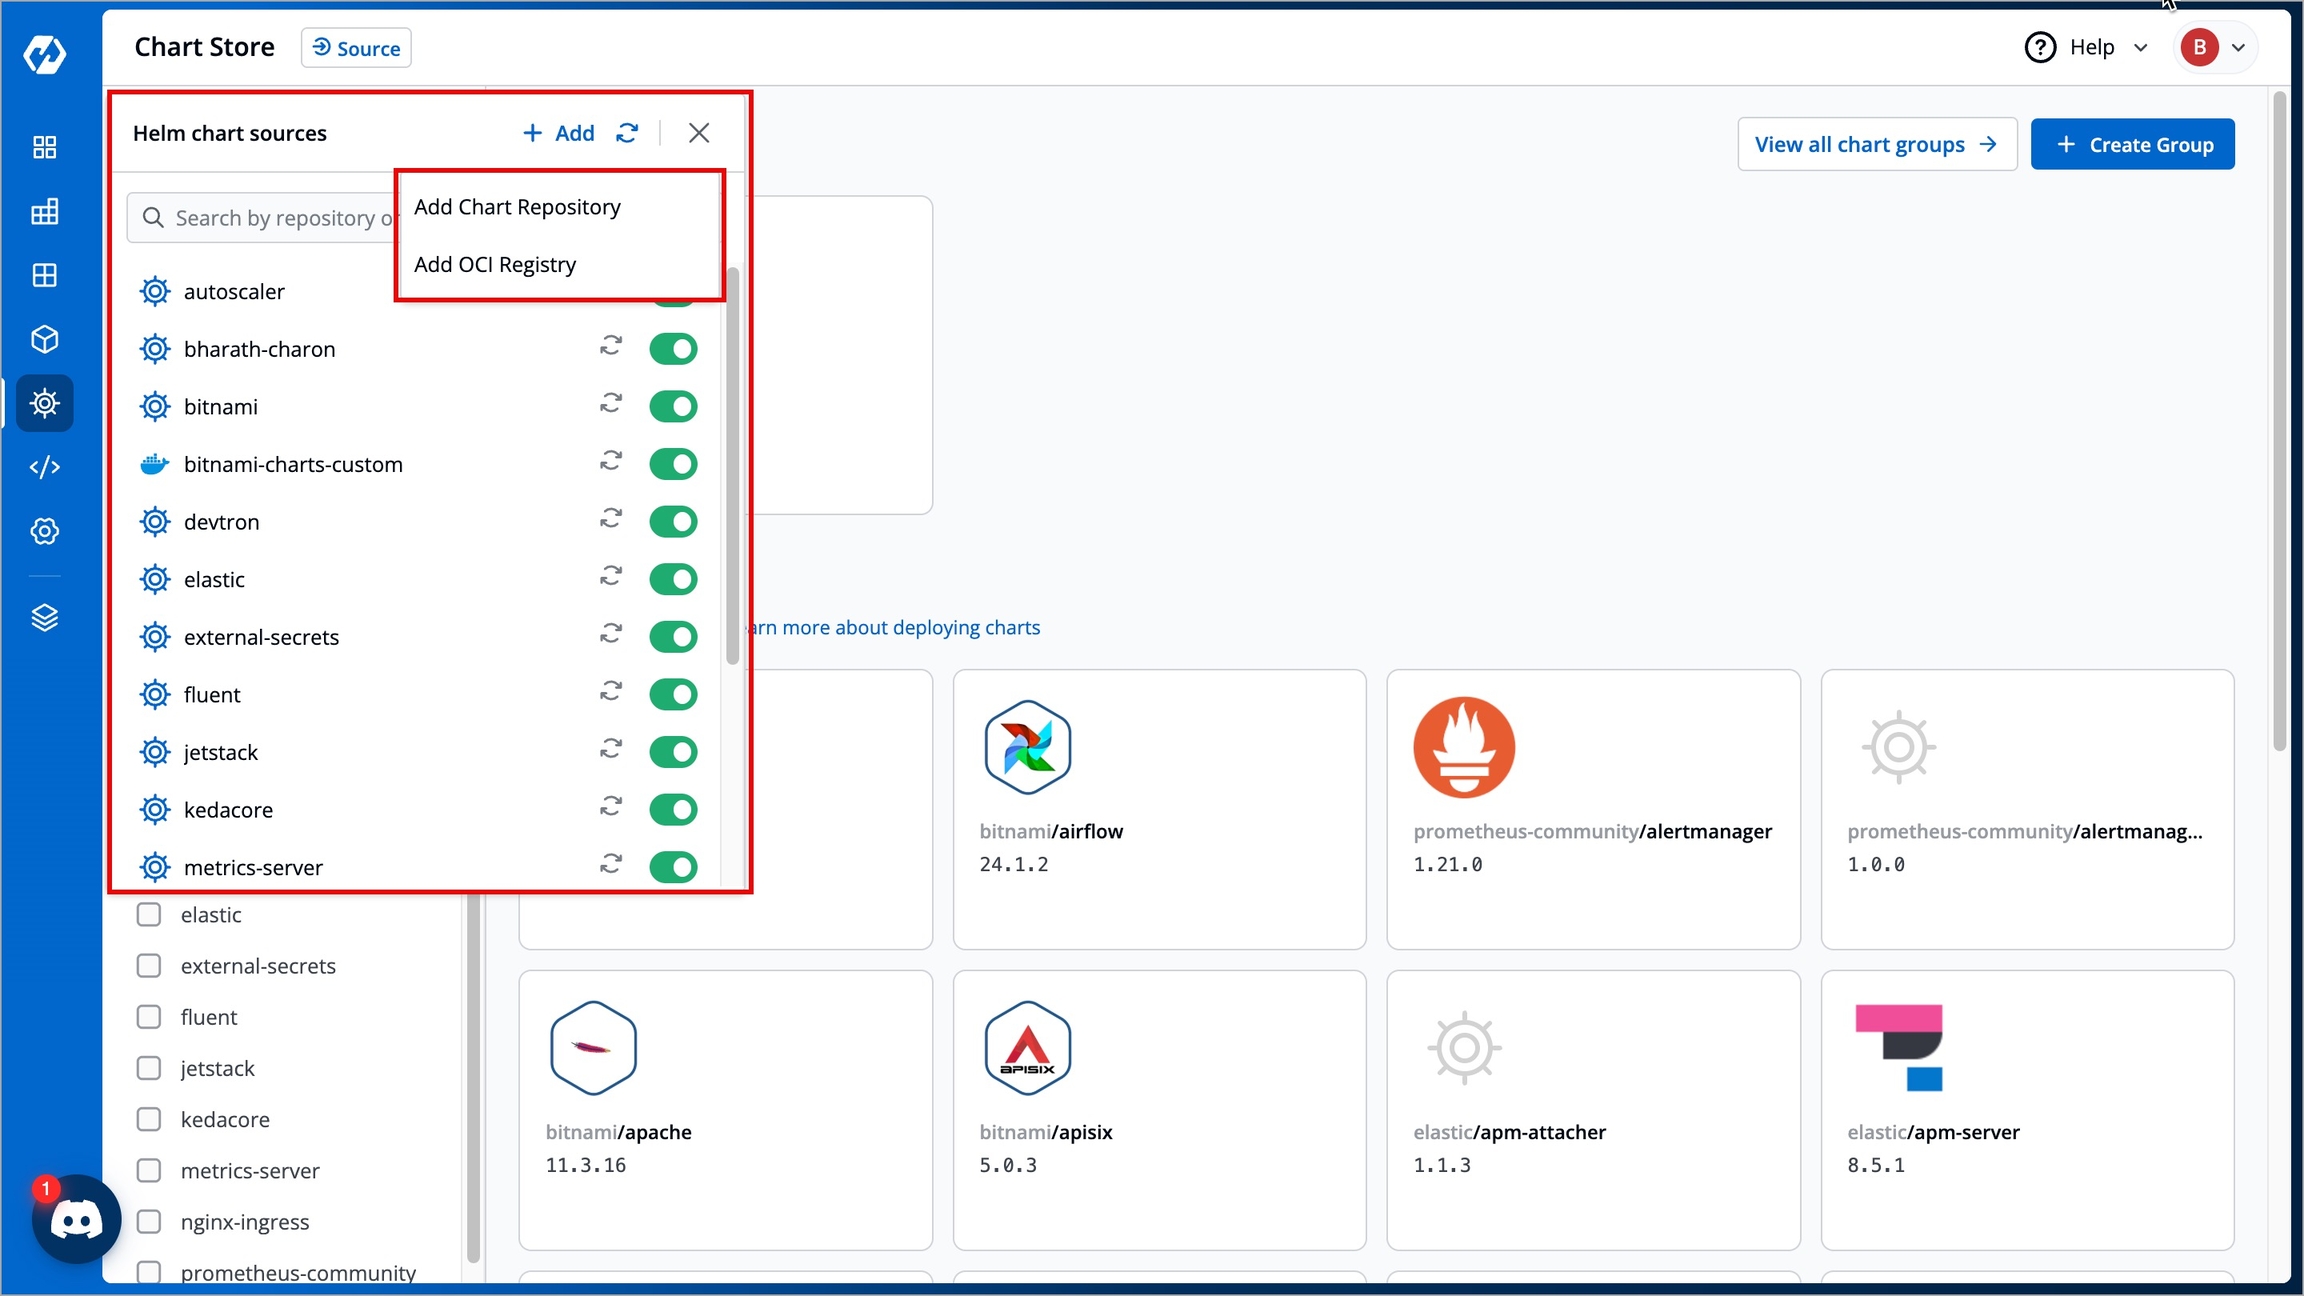
Figure 3: Chart Sources Click on Add Chart Repository . It will take you to the Chart Repositories page in the Global Configurations page.
Click on Add OCI Registry. It will take you to the Container/OCI Registry page in the Global Configurations.
Search for a Chart
To quickly search for a chart, perform any of the following actions:
Navigate to the search bar at the top-left corner of the screen. Enter the chart name you're looking for and press Enter. The chart will be displayed in the All Charts section.
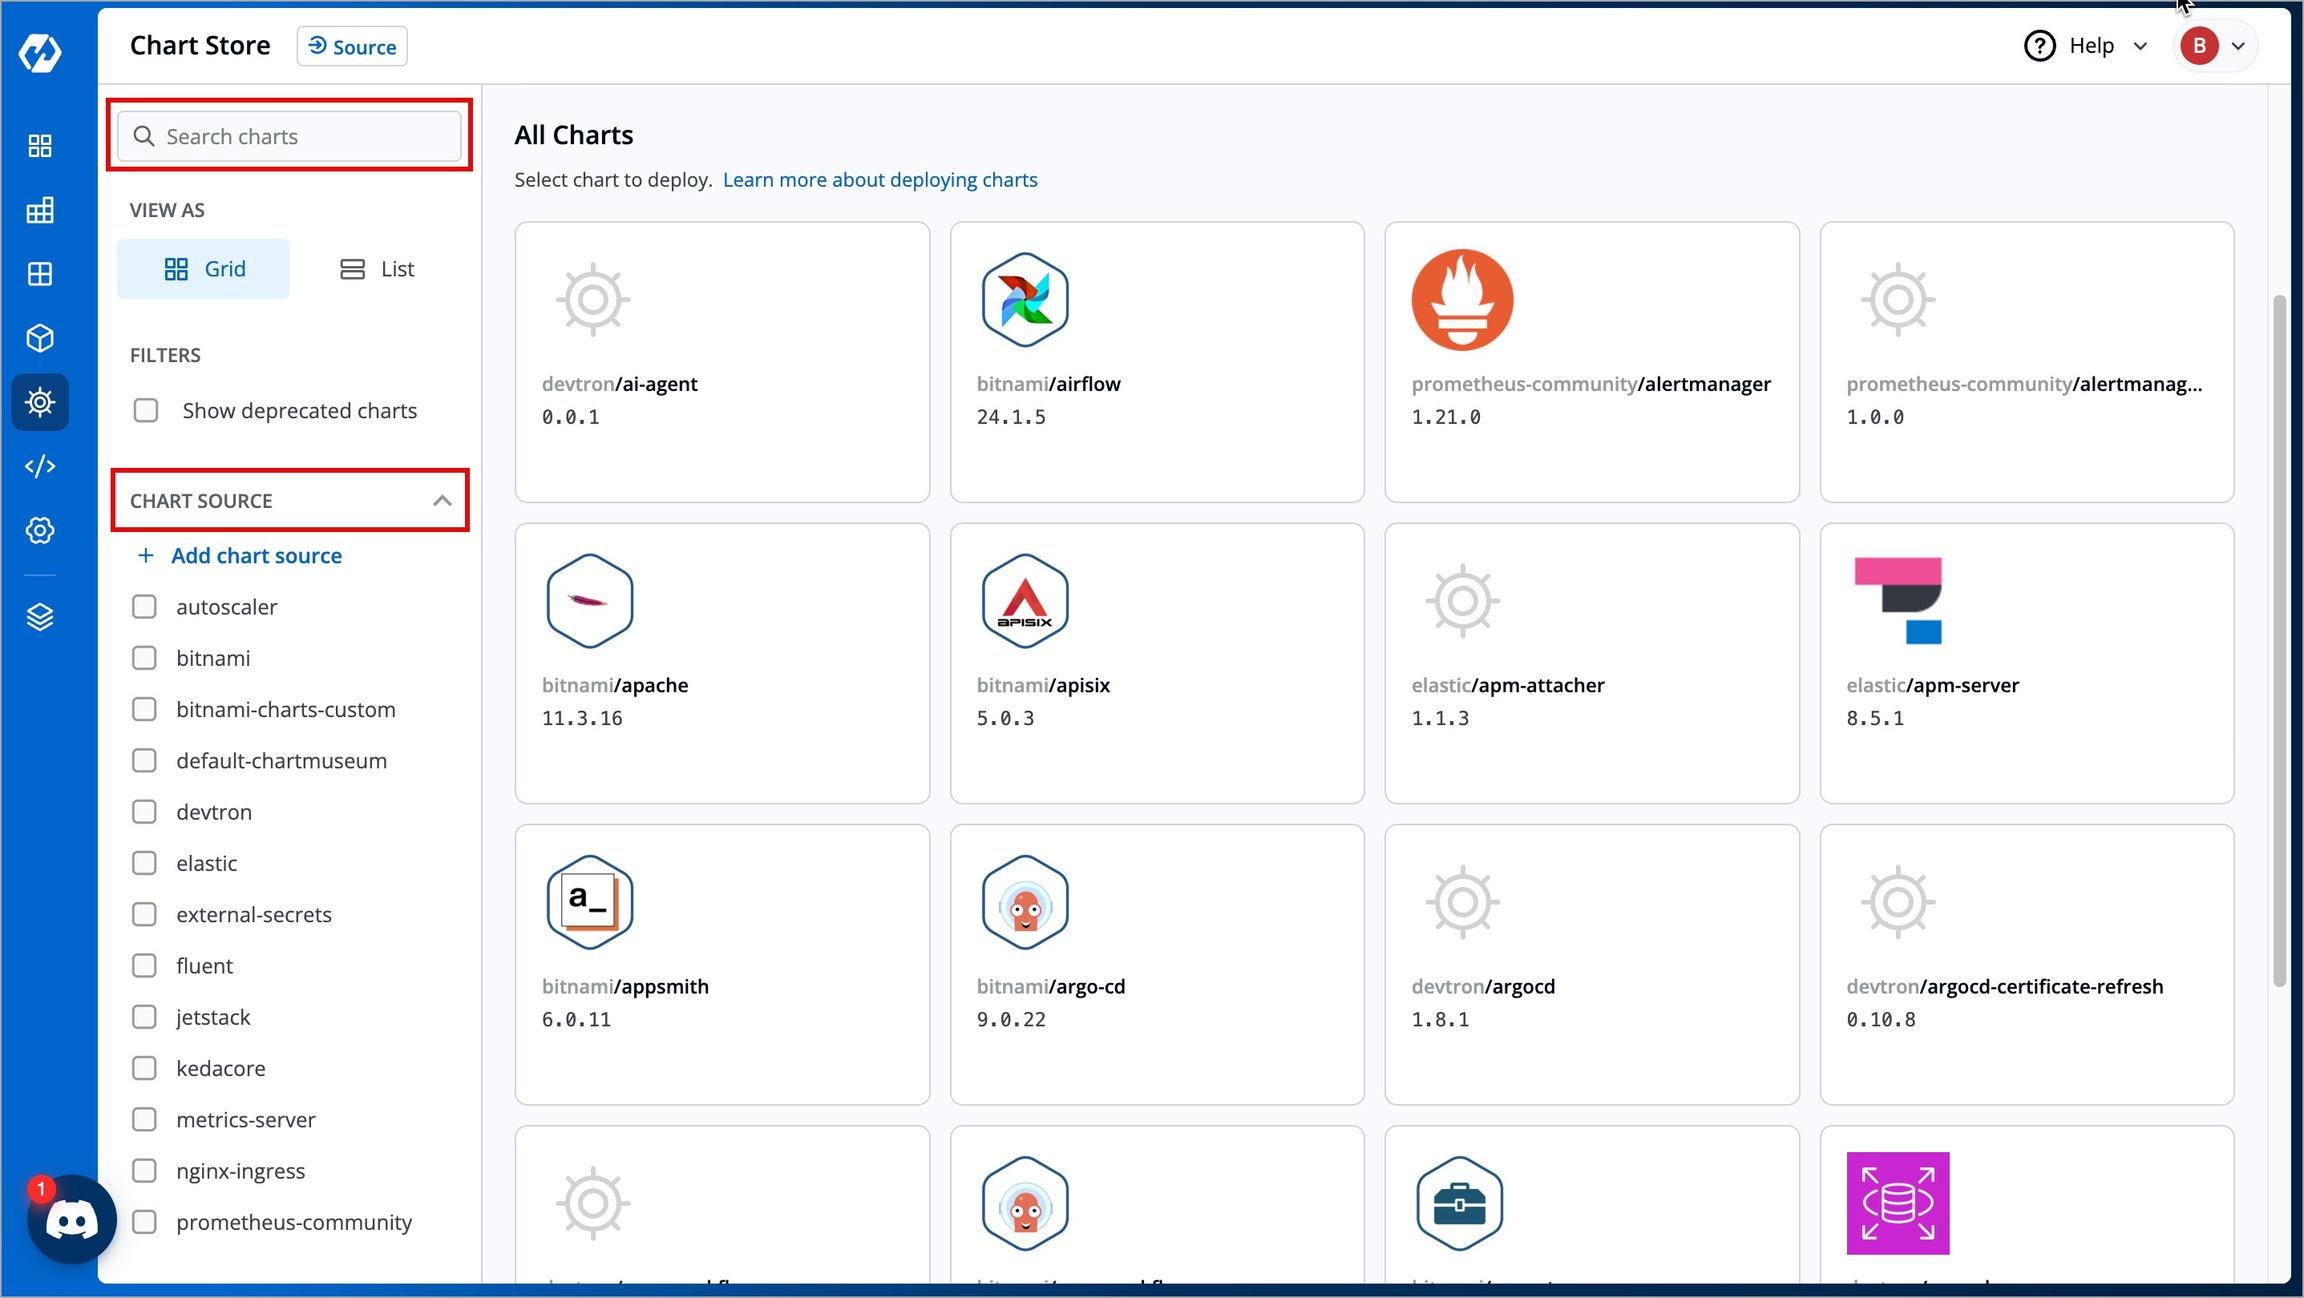
Figure 4: Search Charts Select your preferred chart source(s) using the checkboxes in the Chart Source drop-down box. The charts associated with that chart source will be displayed in the All Charts section.
Unable to Find Your Chart?
Try performing a resync by clicking the Resync button next to each chart source. If the chart is still not displayed, it might be deprecated. Enable the Show deprecated charts checkbox in the Filters section. All the deprecated charts will then be displayed in the All Charts section.
Next Steps
Refer to:
Deploy Charts - if you need to deploy, update, upgrade, disable, or delete charts.
Chart Groups - if you need to create a chart group and bulk deploy them.
Last updated
Was this helpful?