

Application Metrics
Introduction
Application Metrics are the indicators used to evaluate the performance and efficiency of your application. It can be enabled in the Devtron platform to see your application's metrics.
Types of Metrics
CPU usage
Overall CPU utilization per pod and aggregated
Memory Usage
Overall memory utilization per pod and aggregated
Throughput
Number of requests processed per minute
Latency
Delay between request and response, measured in percentiles
Set Up Application Metrics
Note
Application metrics can only be enabled if your application is deployed using Devtron Deployment Charts and not Custom Deployment Charts.
Step 1: Install Monitoring (Grafana) Integration
For OSS and Self-Managed Enterprise
To use the Grafana dashboard, you need to first install the integration from the Devtron Stack Manager. Refer Monitoring (Grafana) Integration to learn more.
For Devtron-Managed Enterprise
If you want to enable Grafana Integration, email us at [email protected] or reach out to your Devtron representative.
Step 2: Install Prometheus
Who Can Perform This Action?
Users need to have Admin role or above to deploy a chart.
Note
Ensure GitOps is configured before deploying Prometheus. If not, Prometheus will default to being deployed via Helm.
Go to the Chart Store and search for
prometheus. Use the Prometheus community'skube-prometheus-stackchart to deploy Prometheus.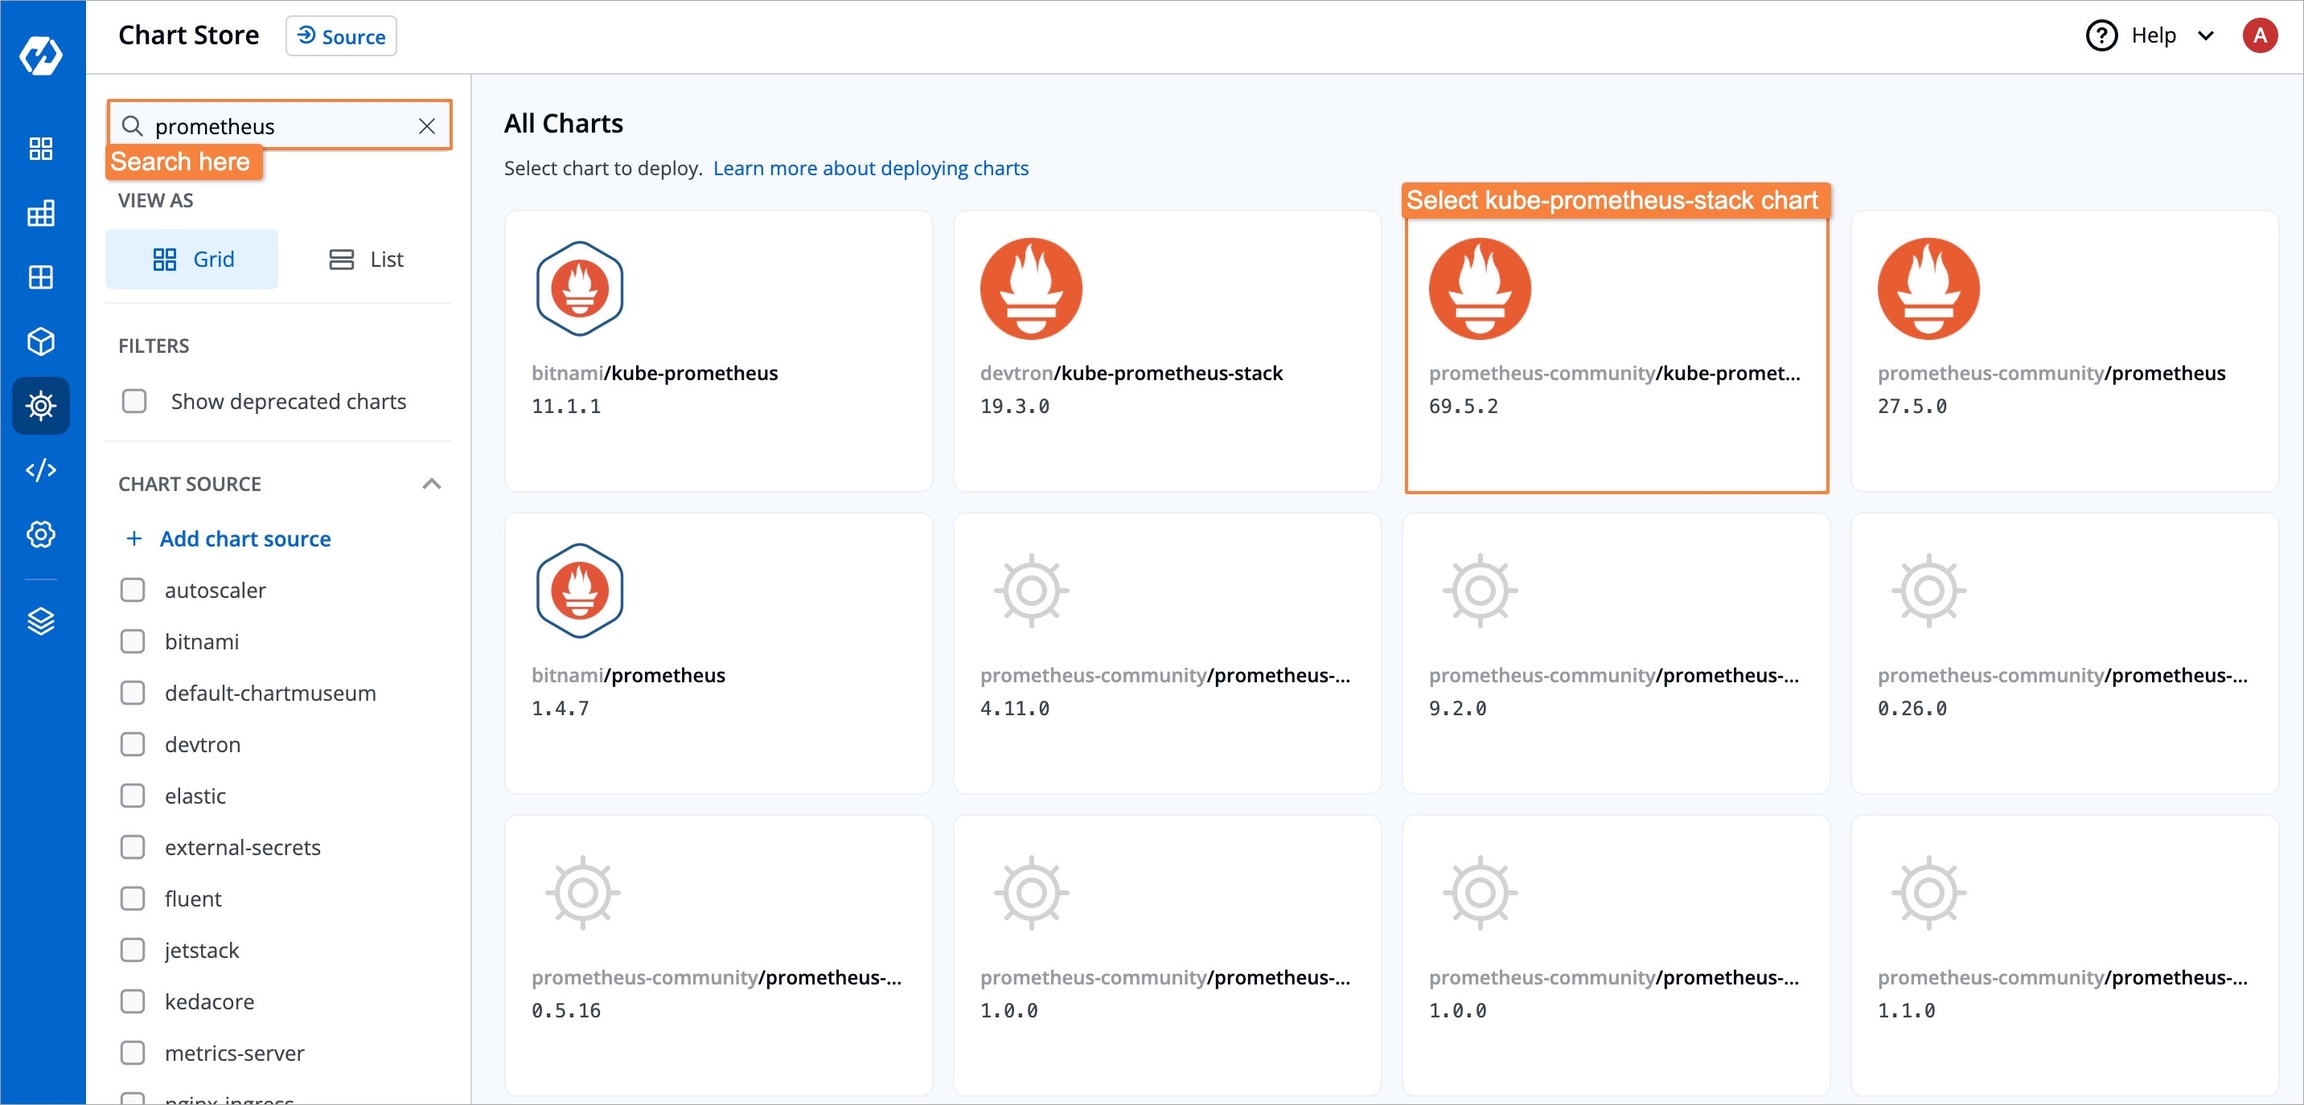
Figure 2: Chart Store After selecting the chart, configure these values as needed before deployment.
kube-state-metrics: metricLabelsAllowlist: - pods=[*]serviceMonitorSelectorNilUsesHelmValues: false podMonitorSelectorNilUsesHelmValues: falseSearch for the above parameters, and update them as shown (or customize as needed).
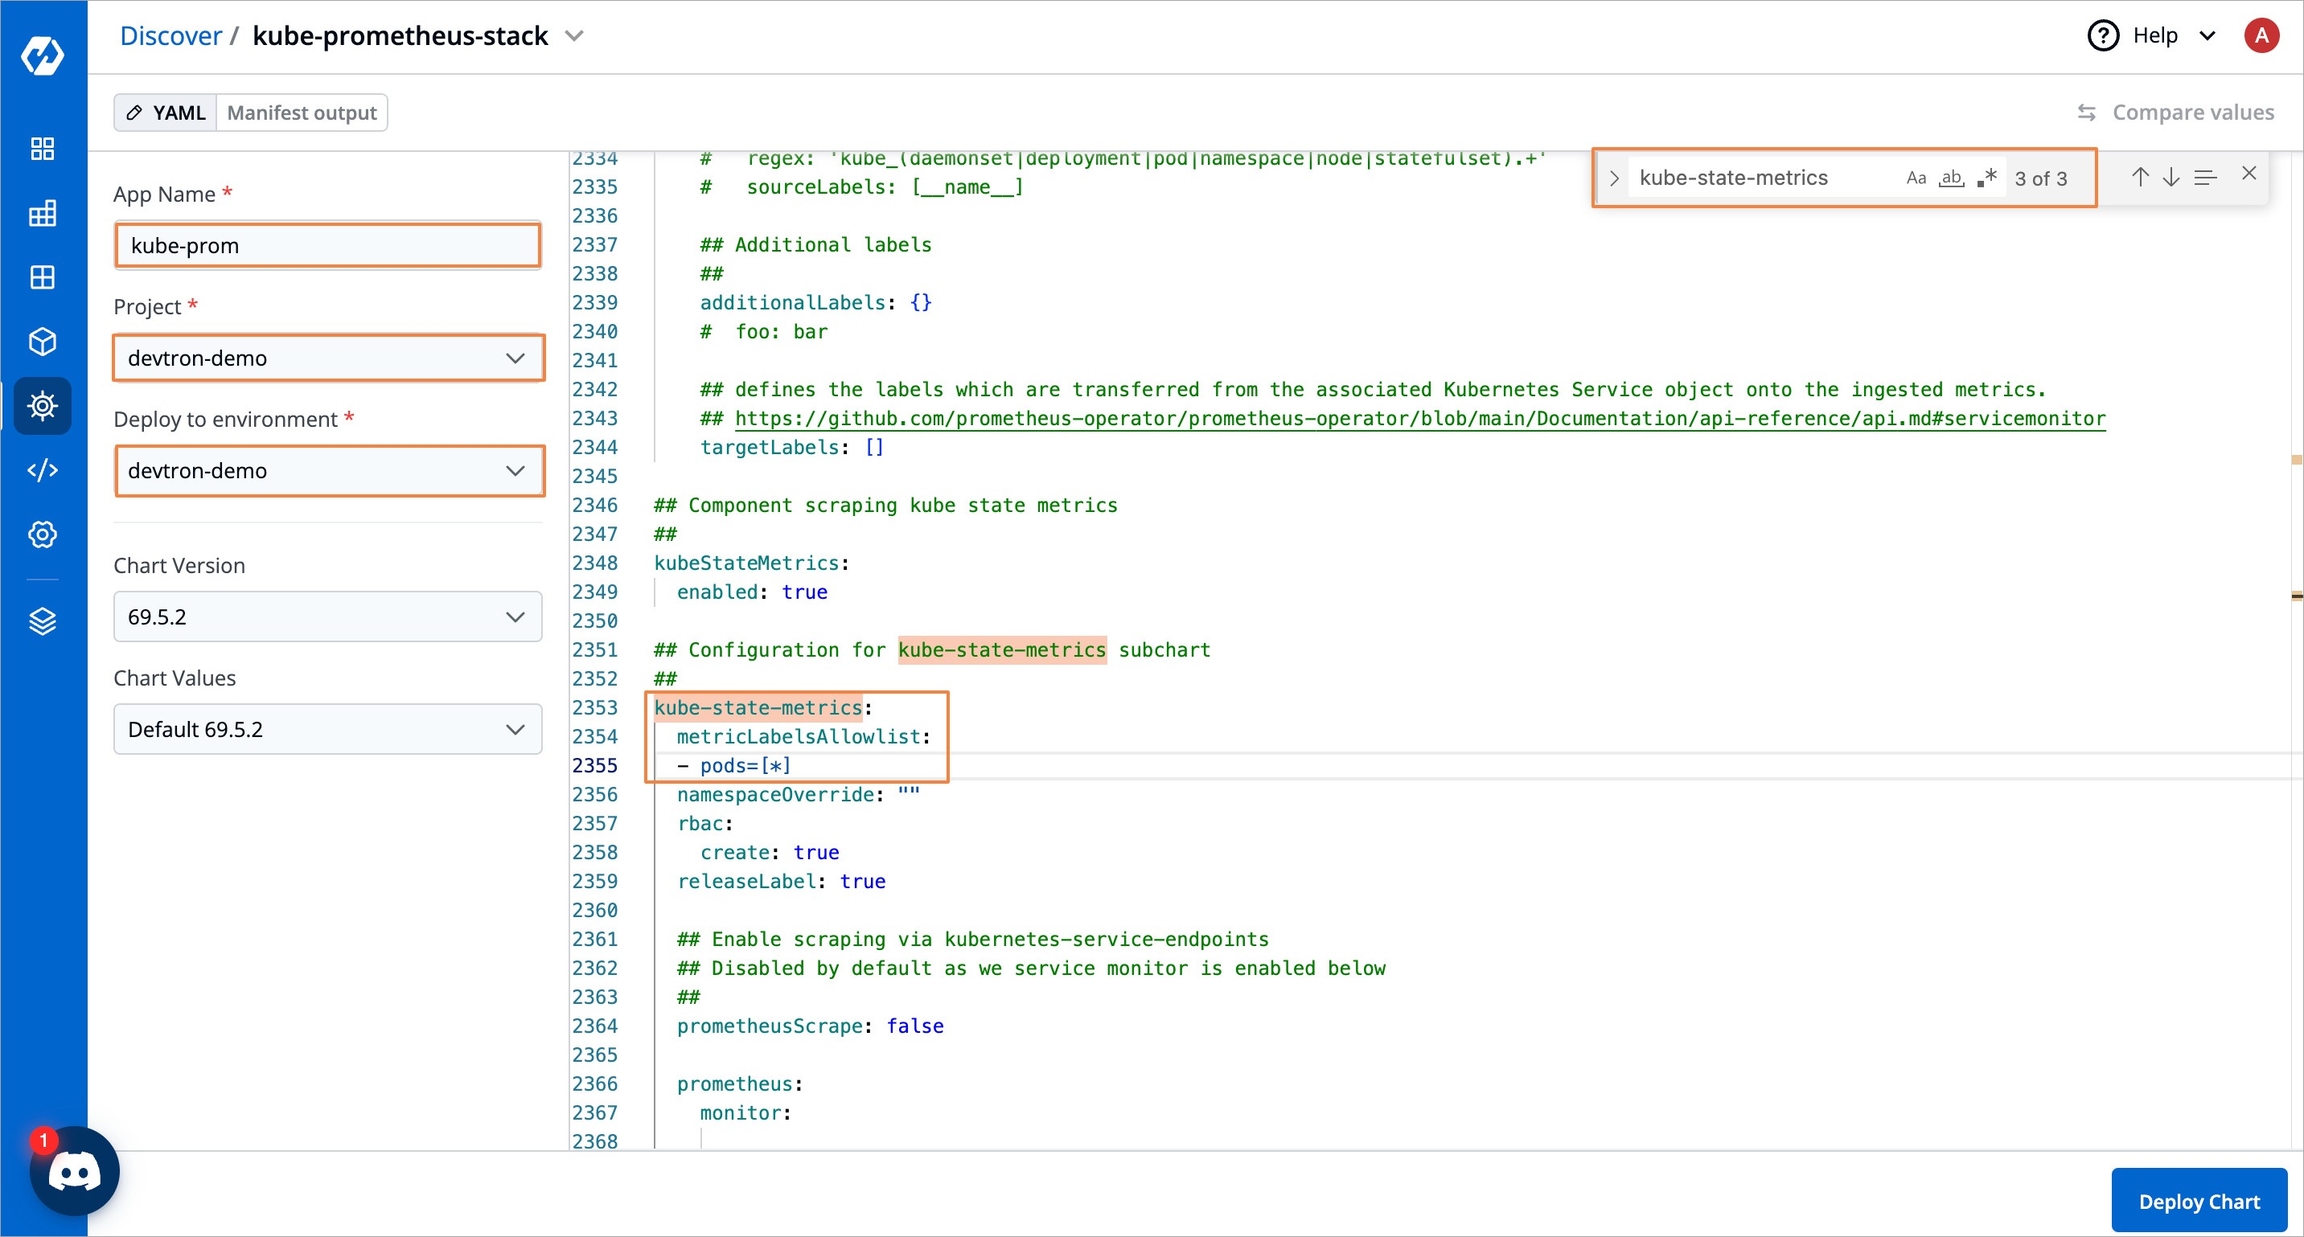
Figure 3a: Prometheus Chart Configuration 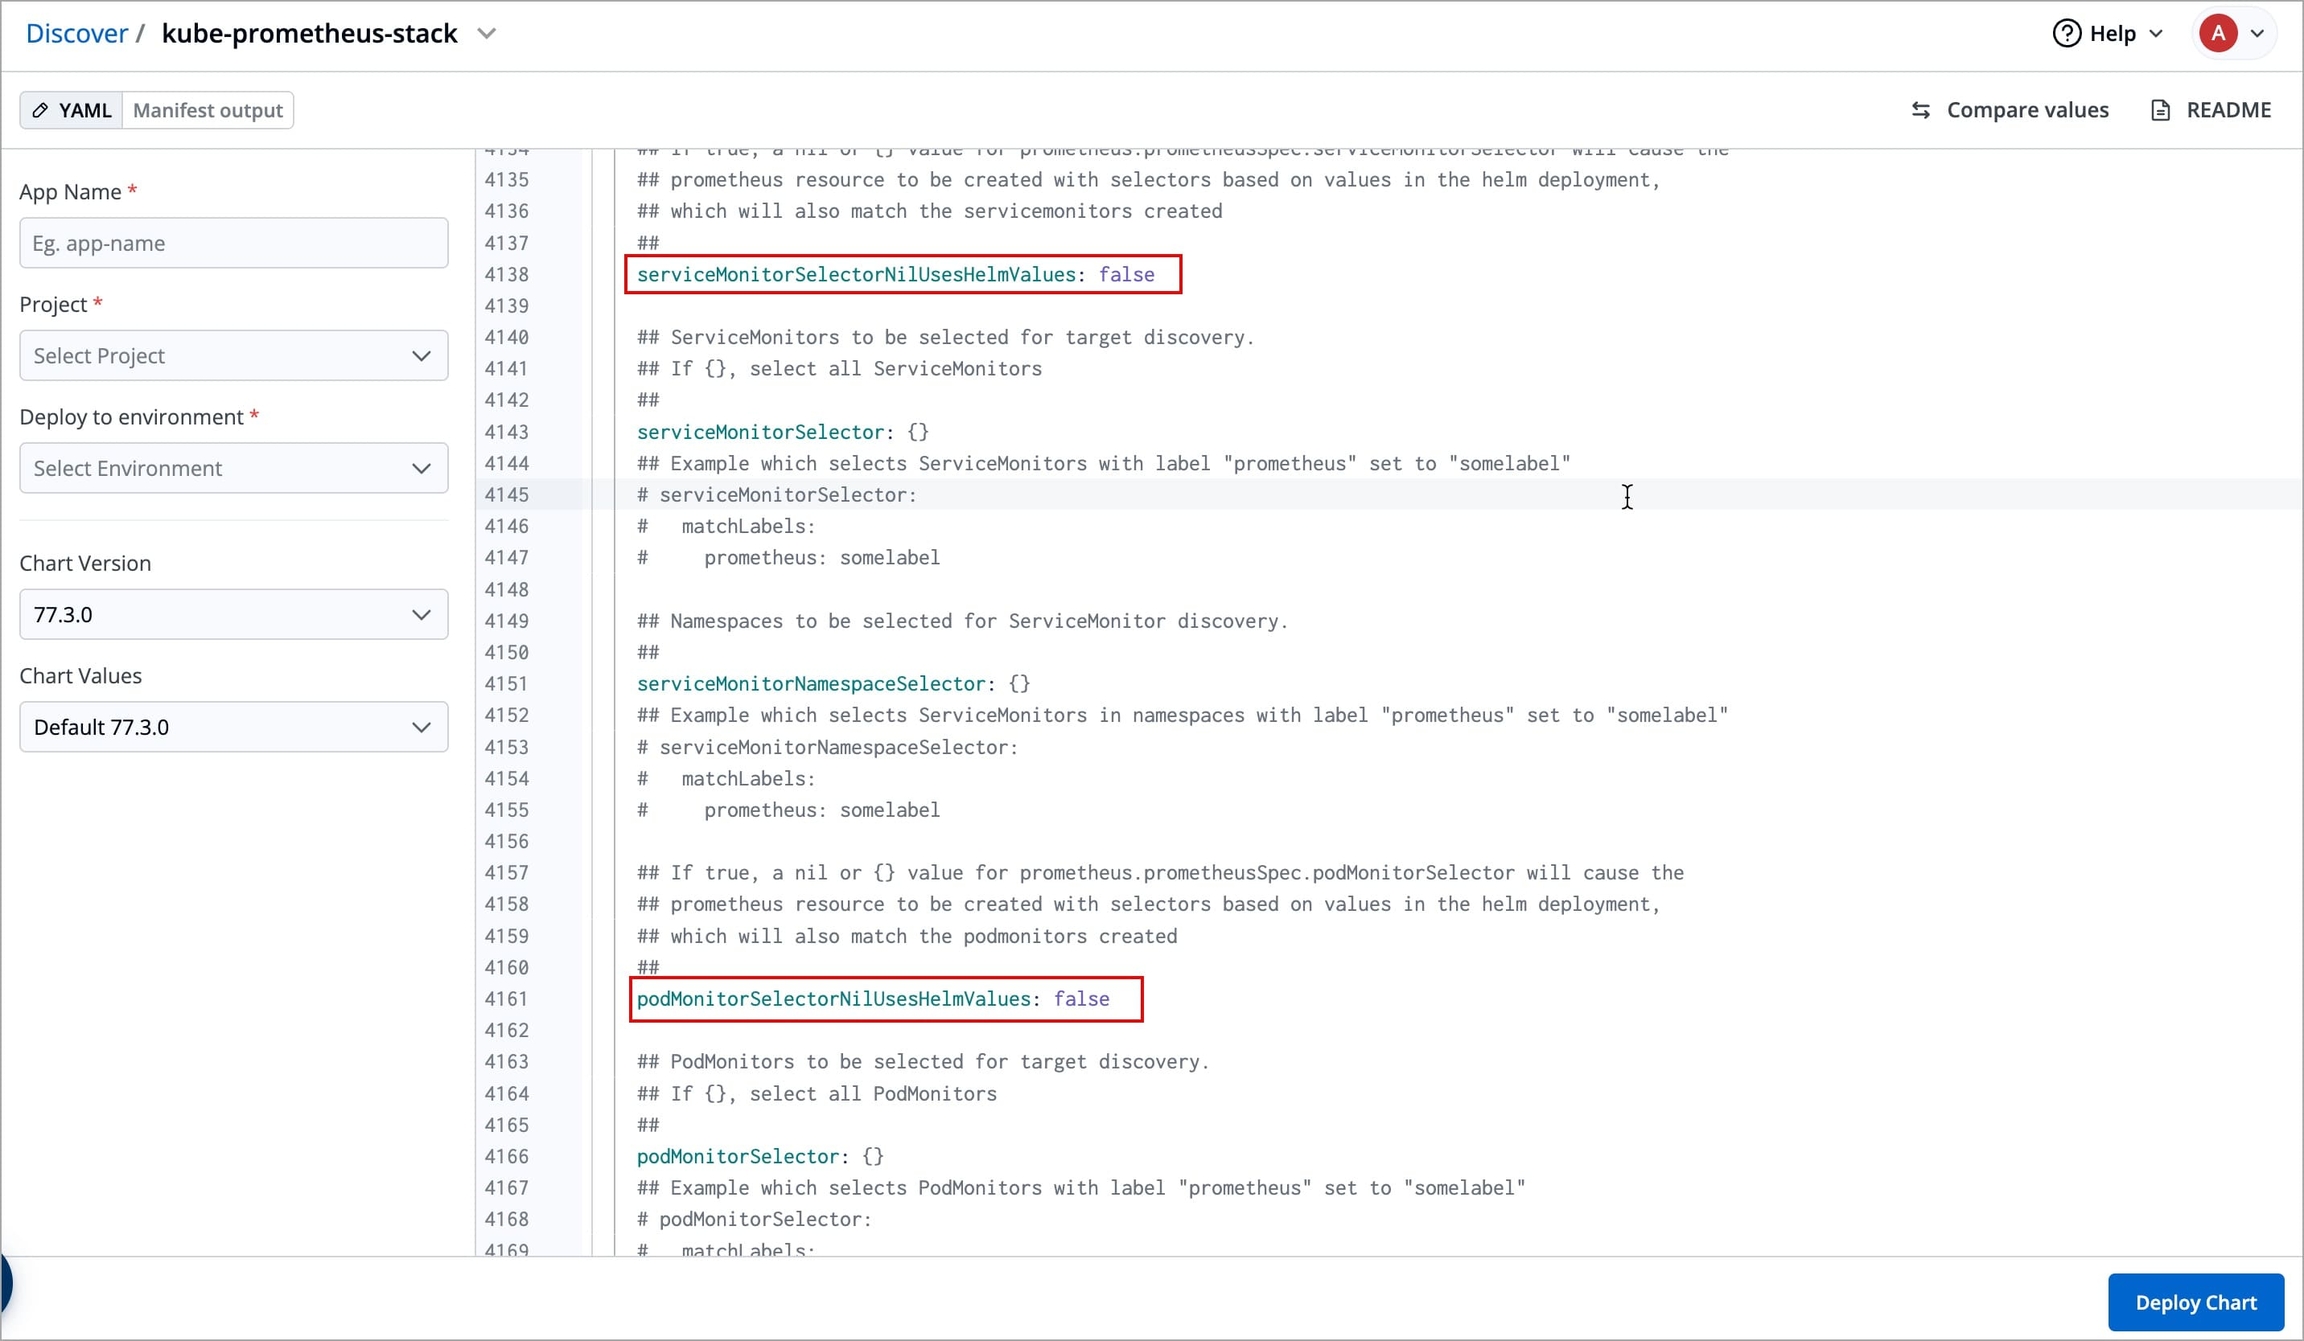
Figure 3b: Prometheus Chart Configuration (cont.) Enable
upgradeJobparameter to install CRDs:Since Helm does not automatically apply CRDs, you need to enable the
upgradeJobparameter in the Helm chart to ensure CRDs are applied before deploying Prometheus.In the Prometheus Helm chart settings, locate the
upgradeJobparameter and set it totrueif it isfalse.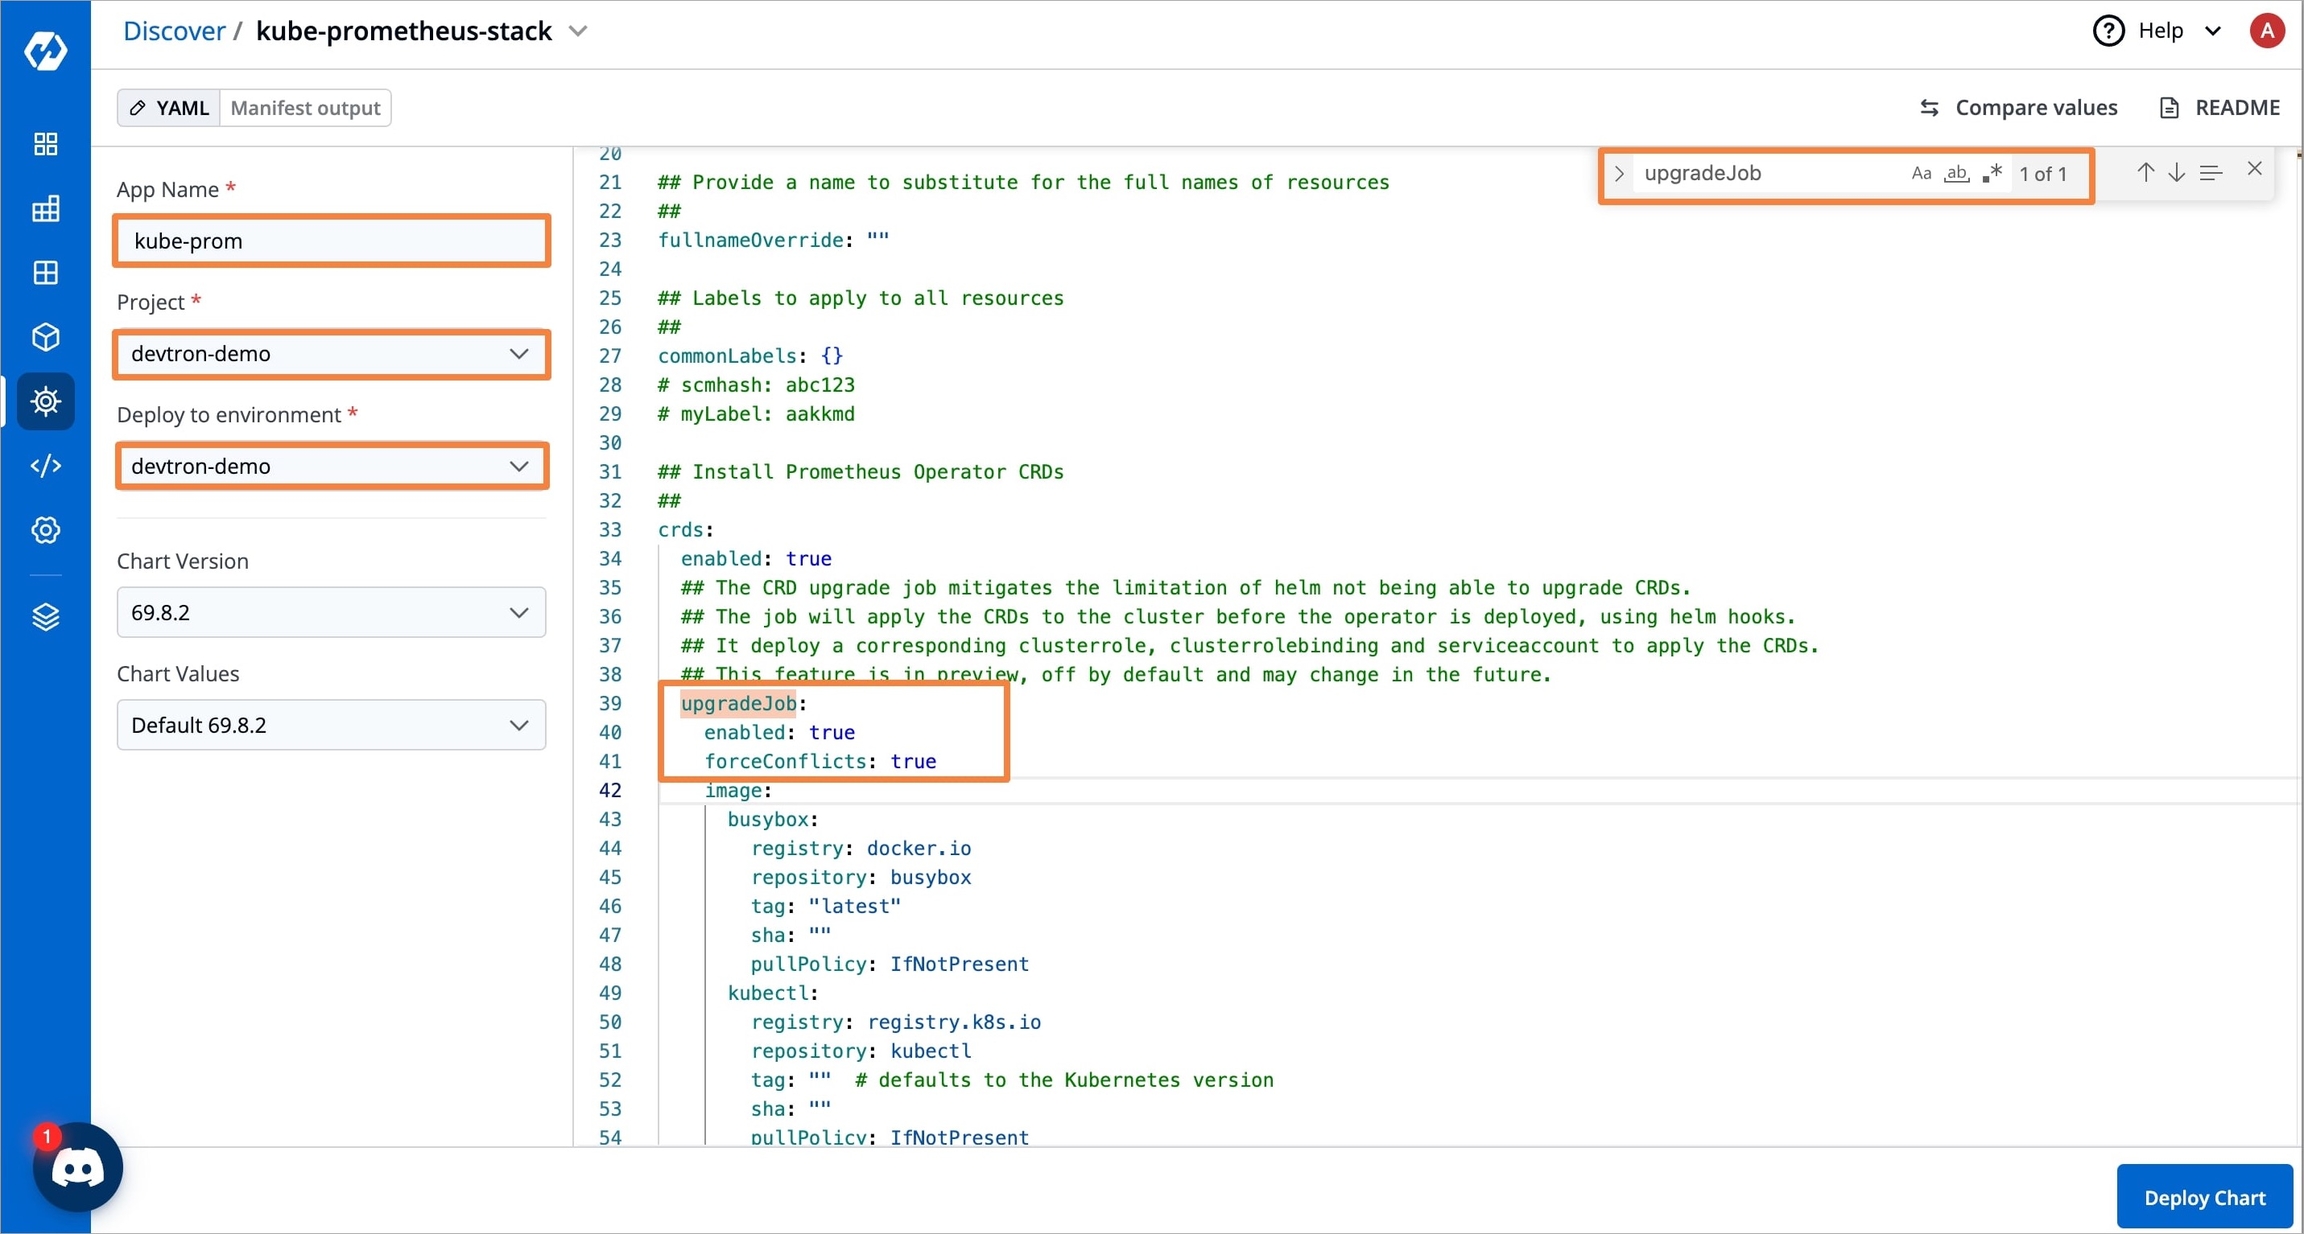
Figure 4: upgradeJob Parameter After enabling the parameter, click Deploy Chart.
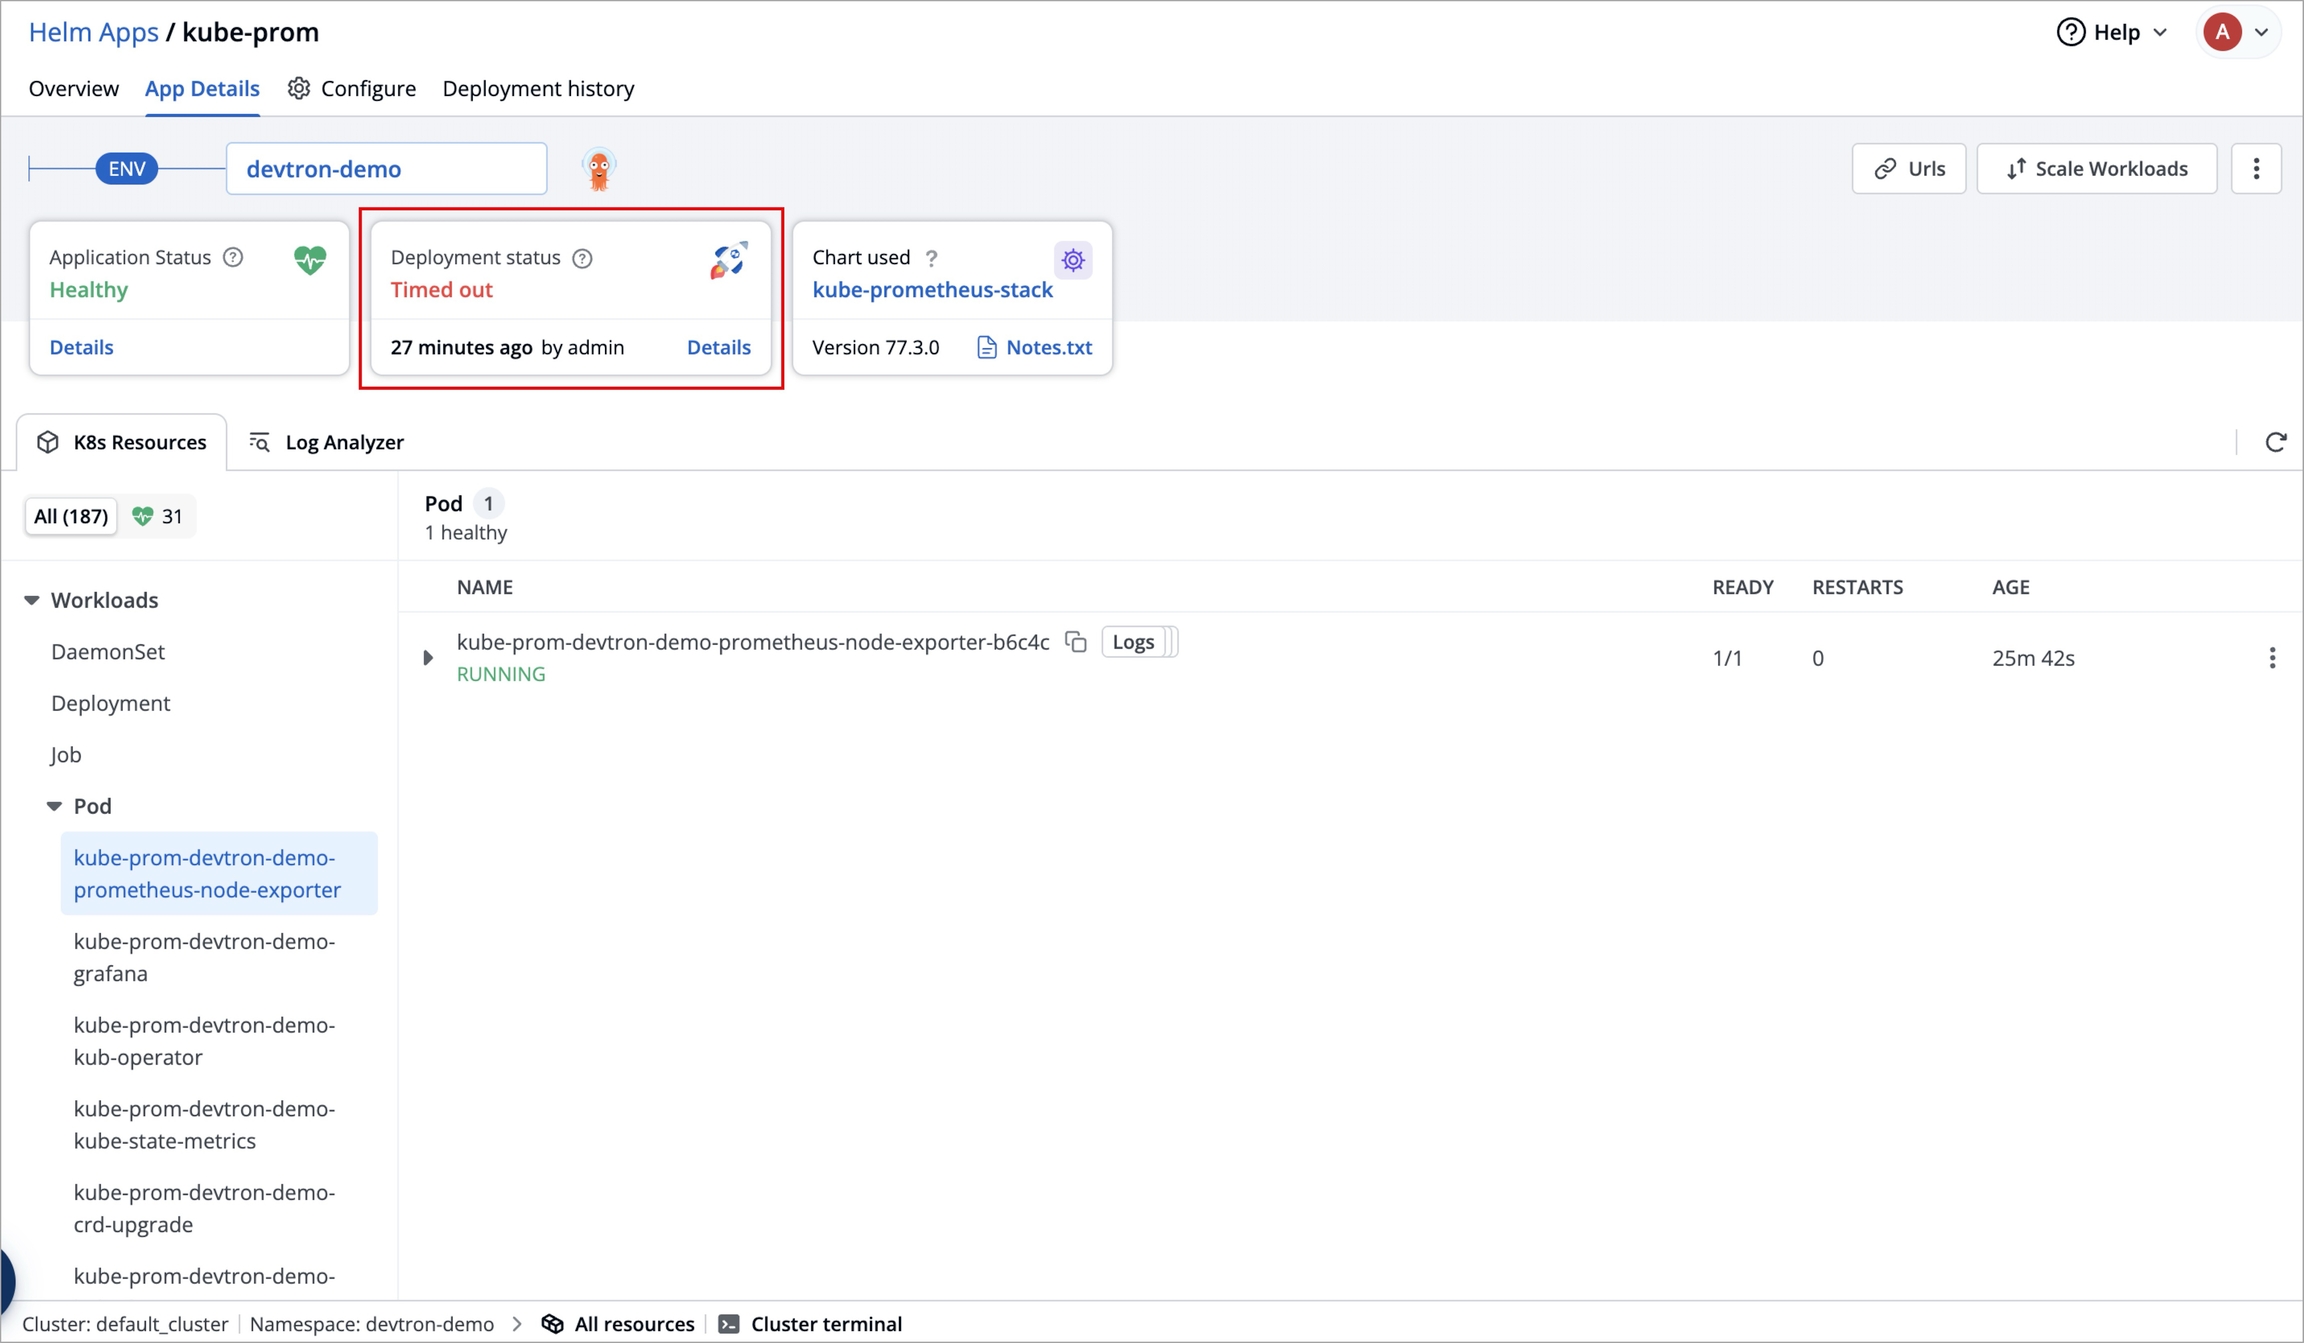
Common Pitfall: Prometheus Deployment Timeout due to Failed CRDs
While deploying kube-prometheus-stack chart, the deployment status may show as Timed out, and some CustomResourceDefinitions (CRDs) may appear as Failed.
To solve it, refer Troubleshoot Issues
Step 3: Set Up Prometheus Endpoint
Once Prometheus is installed, go to its App Details and navigate to Networking → Service in the K8s resources. Expand the Prometheus server service to see the endpoints.
Copy the URL of the
kube-prometheusservice as shown in the image below.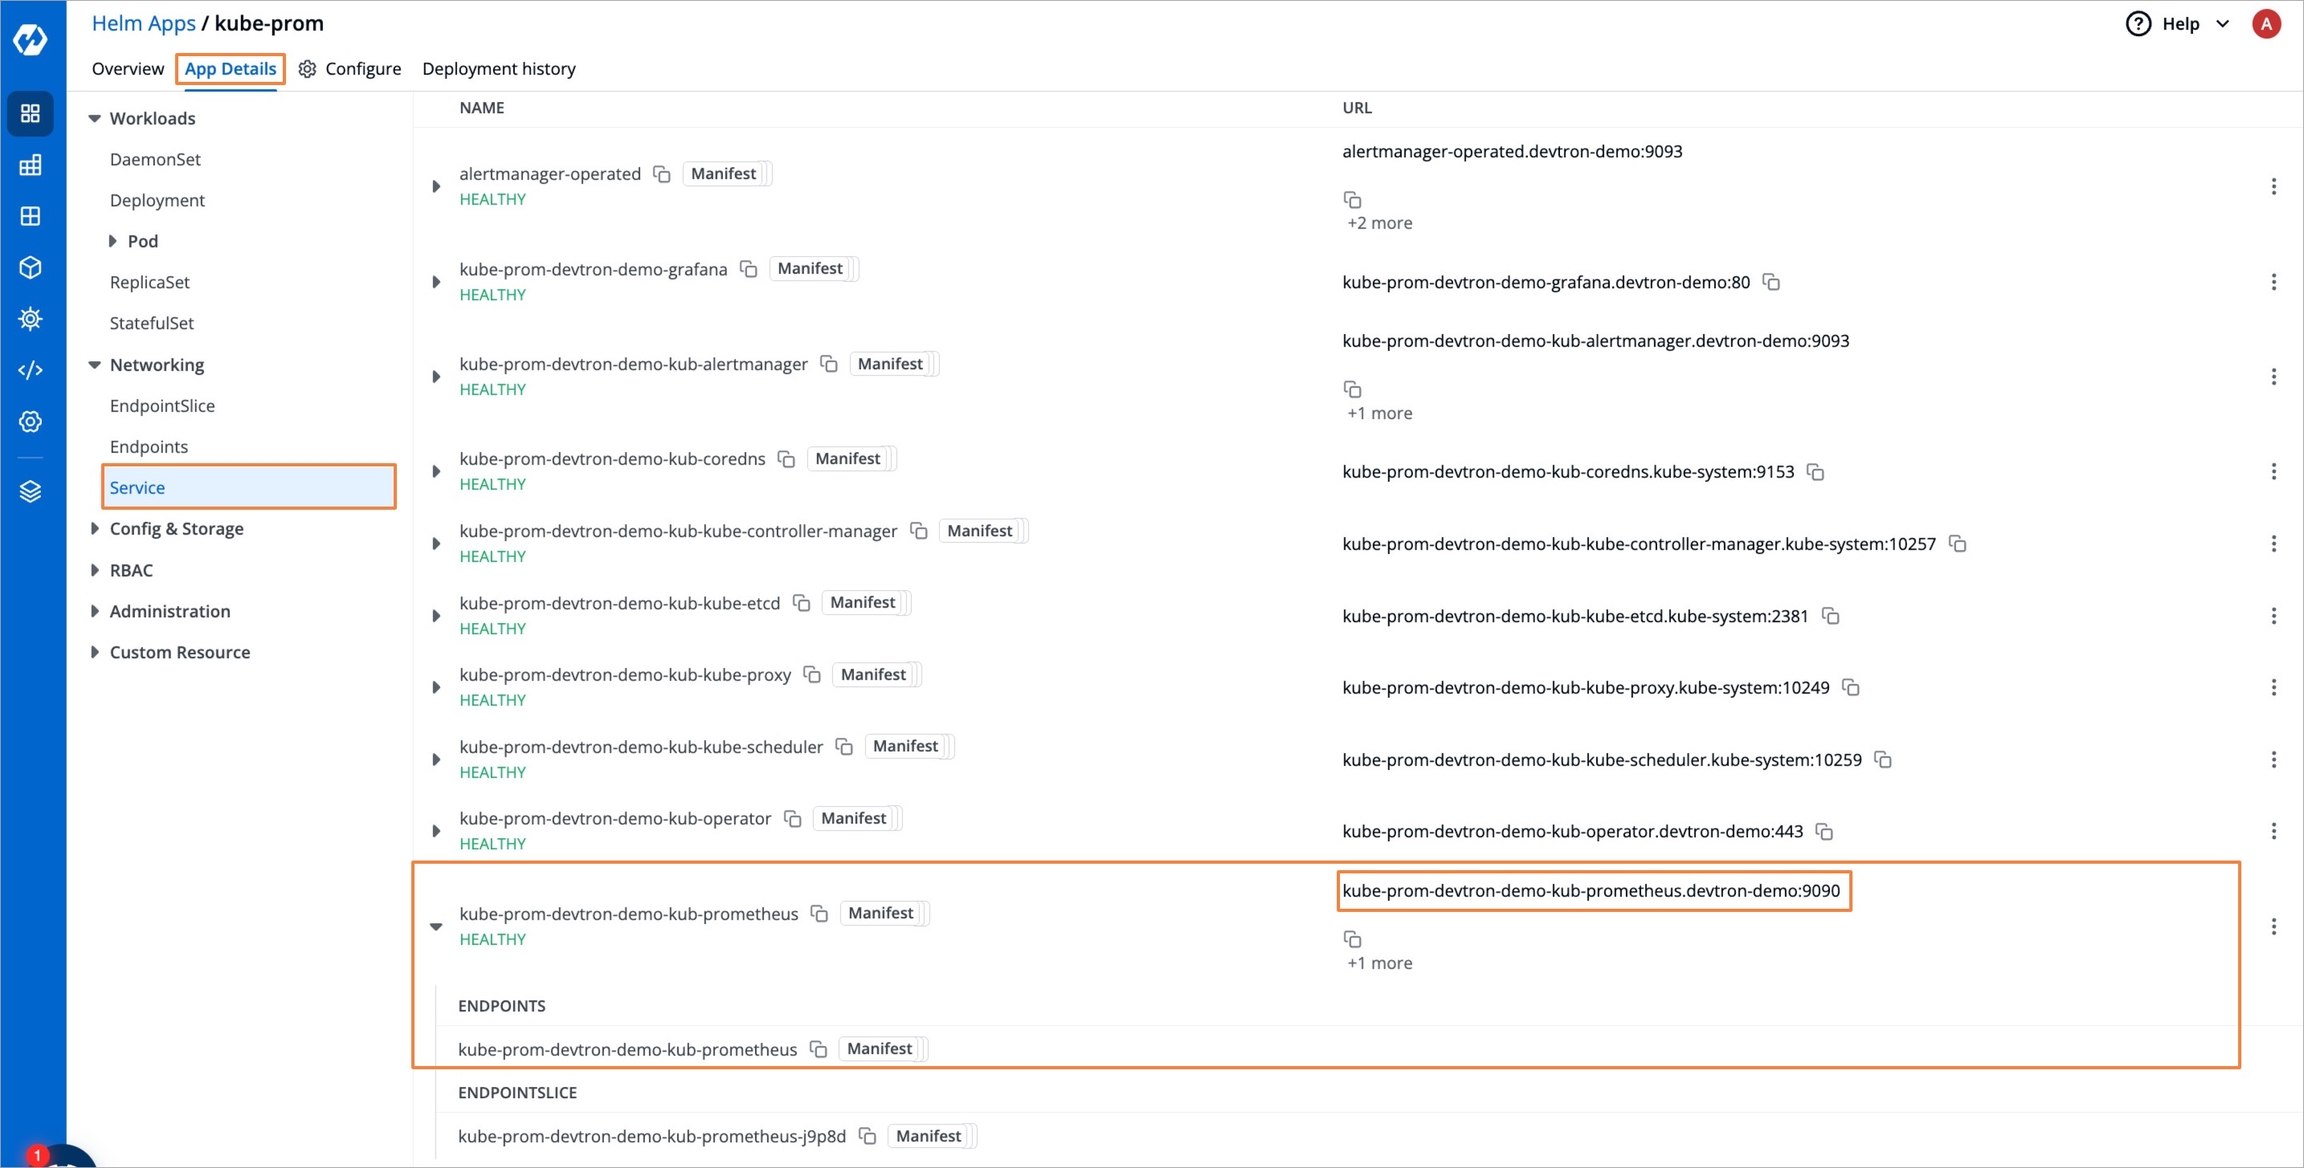
Figure 5: Prometheus Service To set Prometheus as a data source in Grafana, navigate to Global Configurations → Clusters & Environments, select your cluster, and edit its settings.
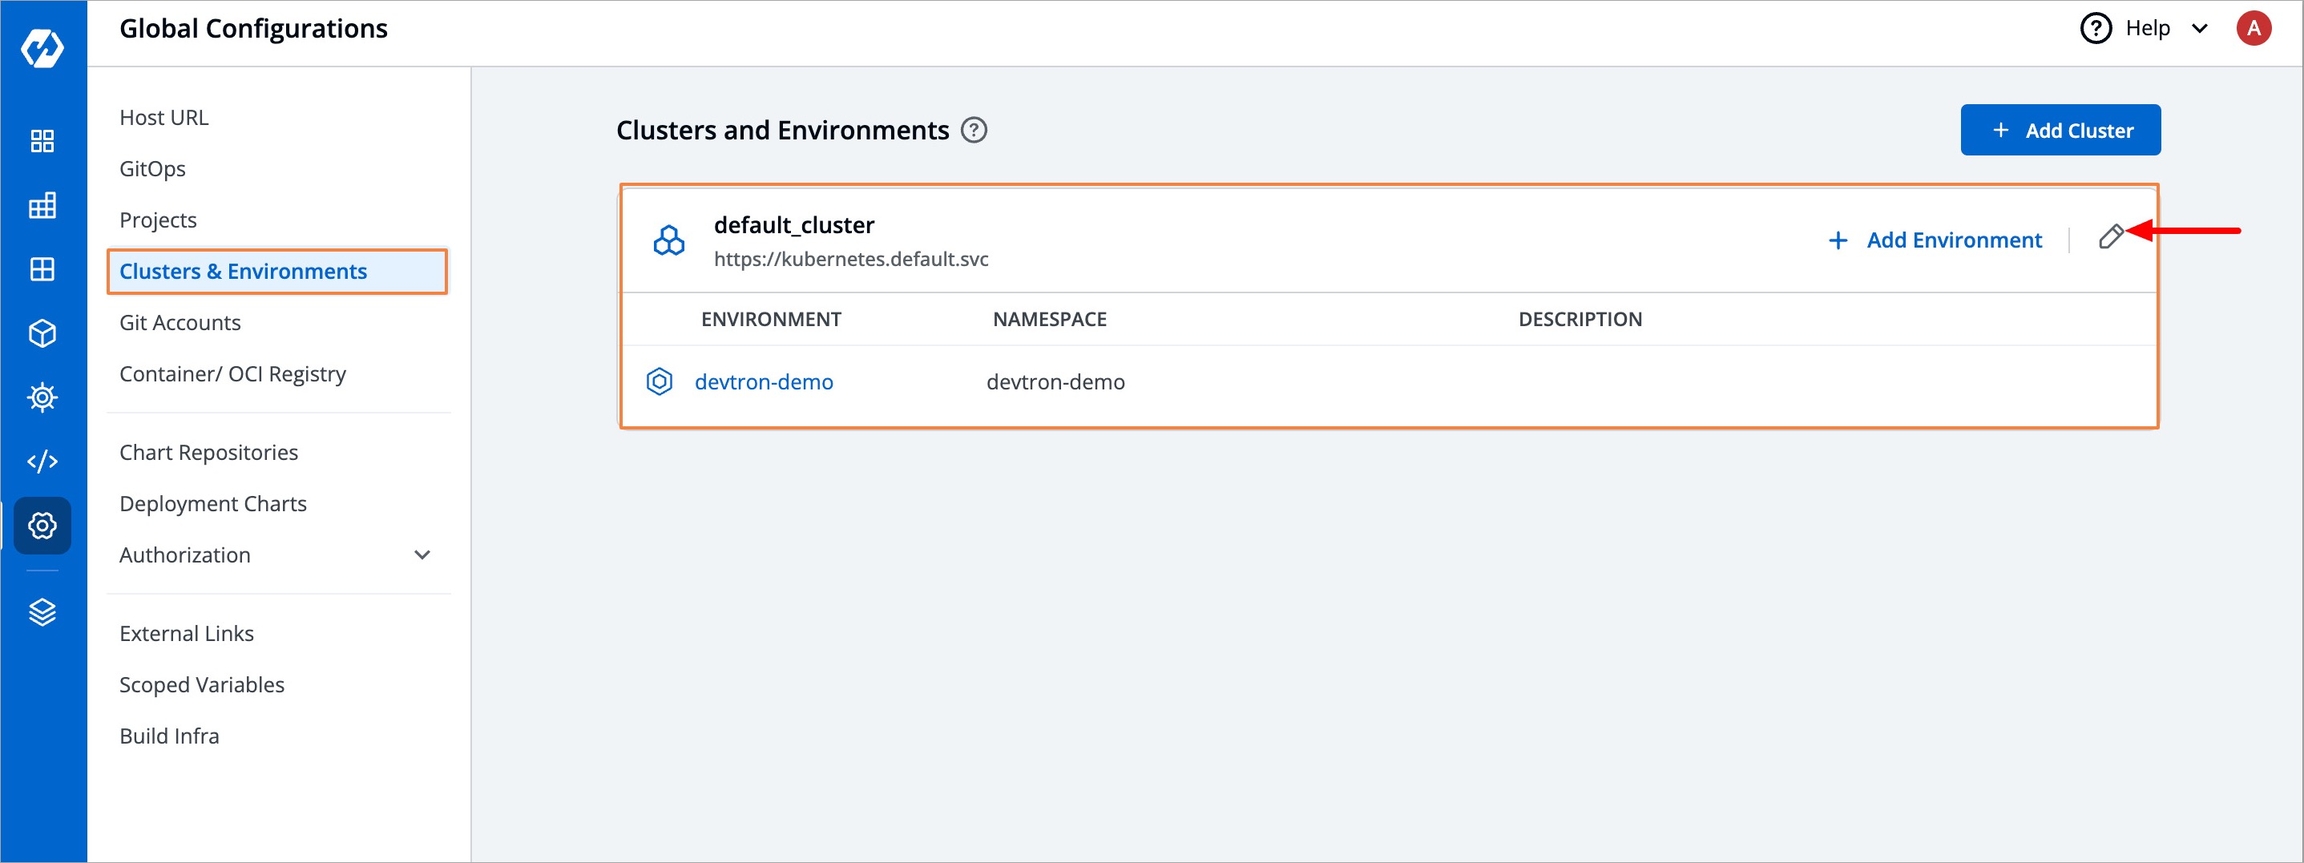
Figure 6: Clusters and Environments Now to set up the Prometheus endpoint:
Enable the
See metrics for applications in this clusteroption, as shown in the image below.Paste the copied URL into the Prometheus endpoint field, ensuring it includes
http://Click Update Cluster to save the changes.
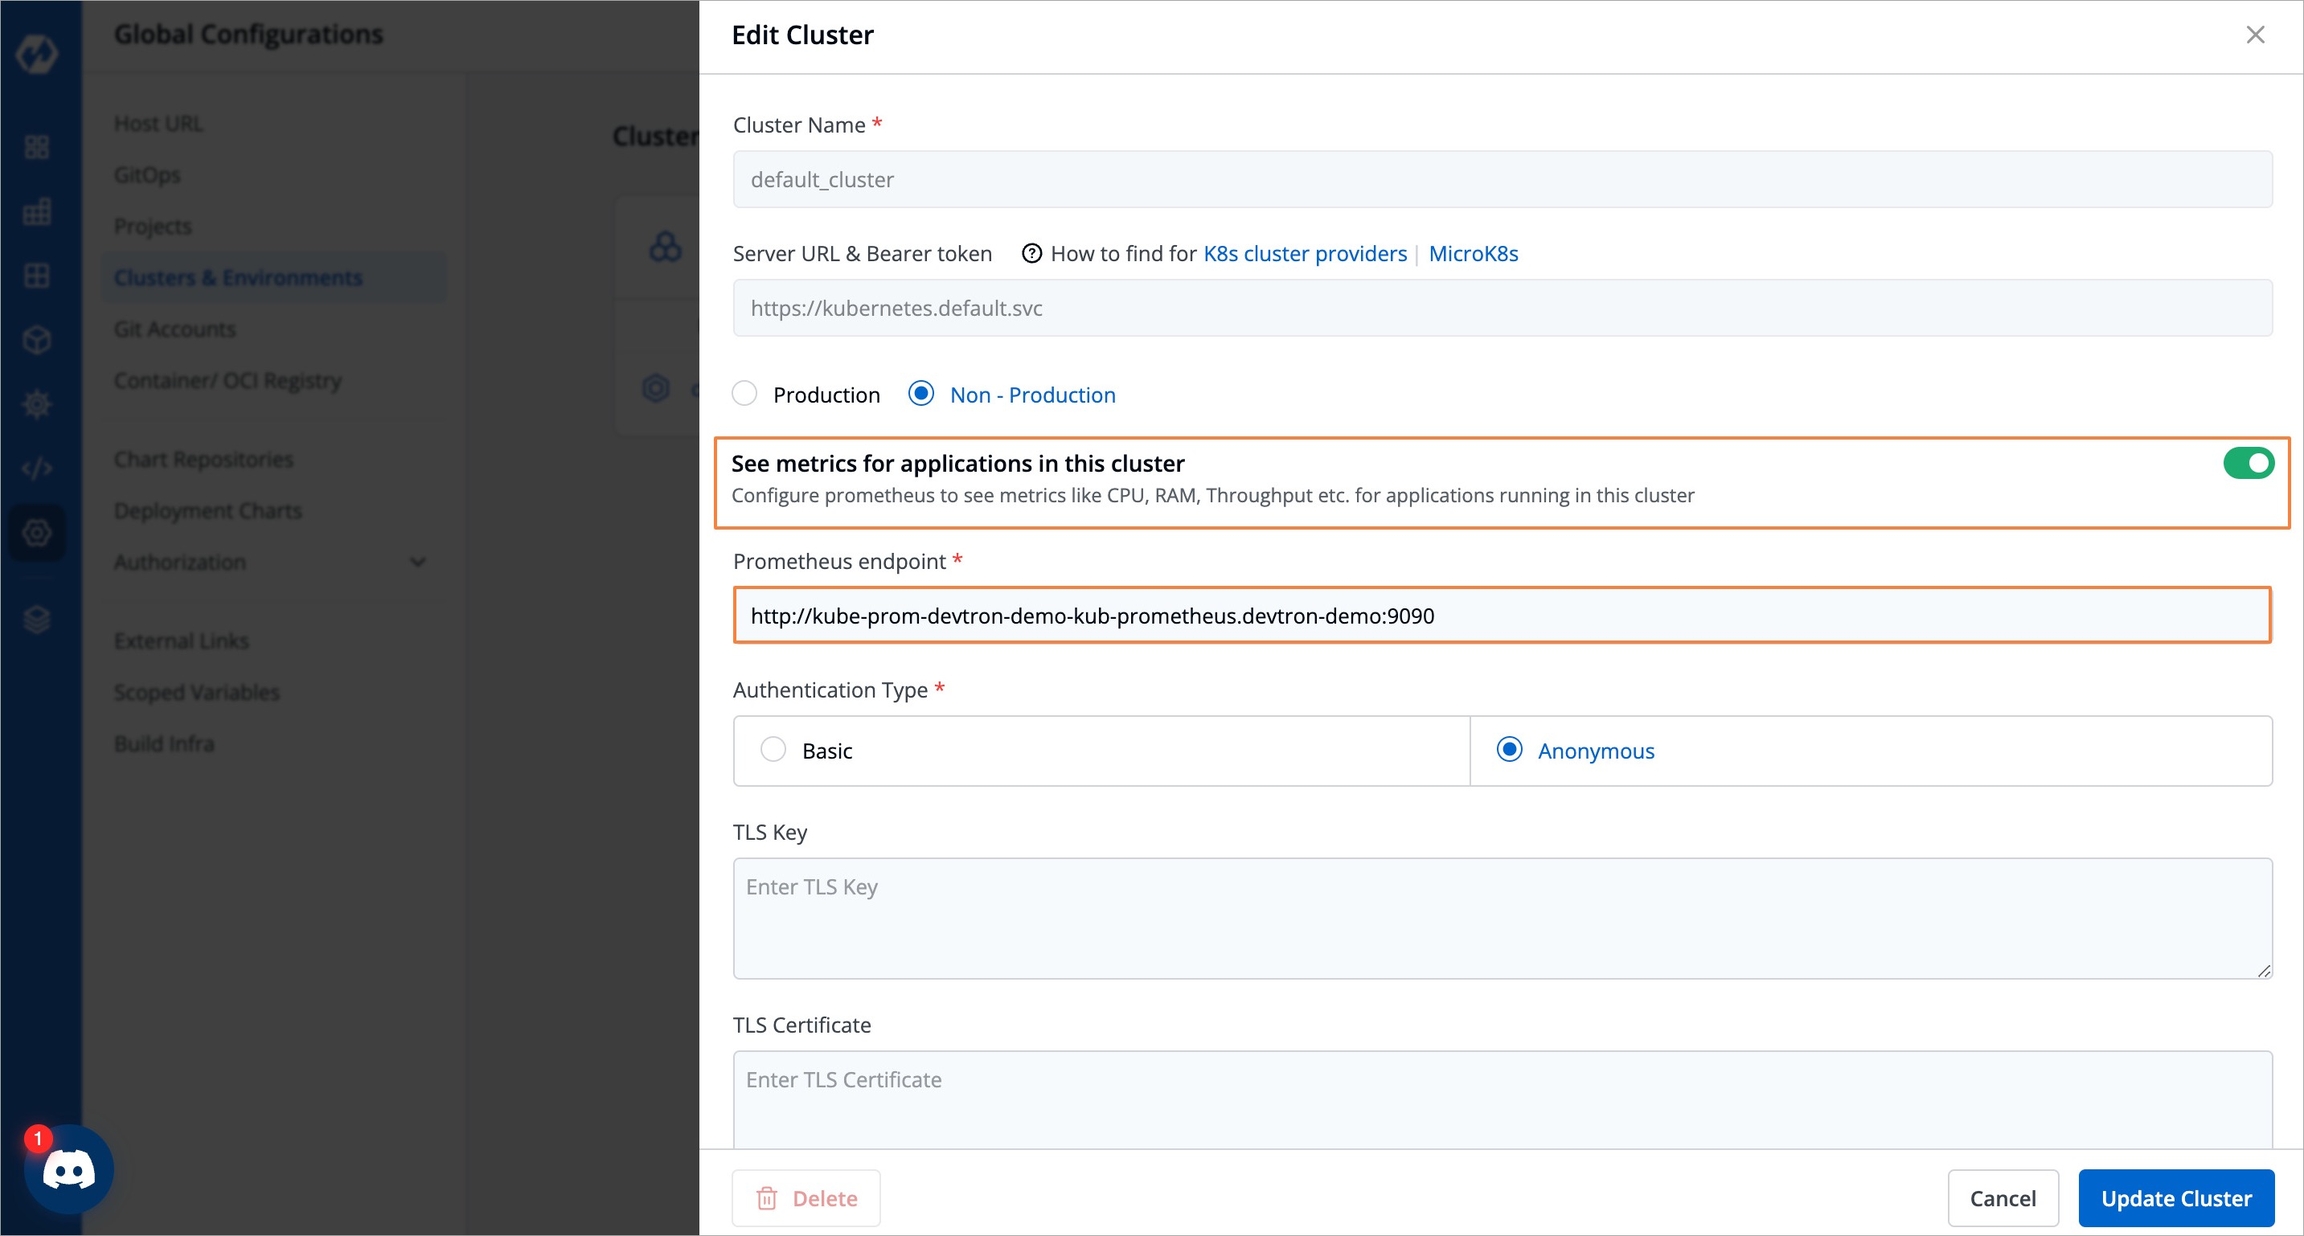
Figure 7: Prometheus Endpoint
Step 4: Enable Application Metrics
Who Can Perform This Action?
Users need to have Admin role or above to enable application metrics.
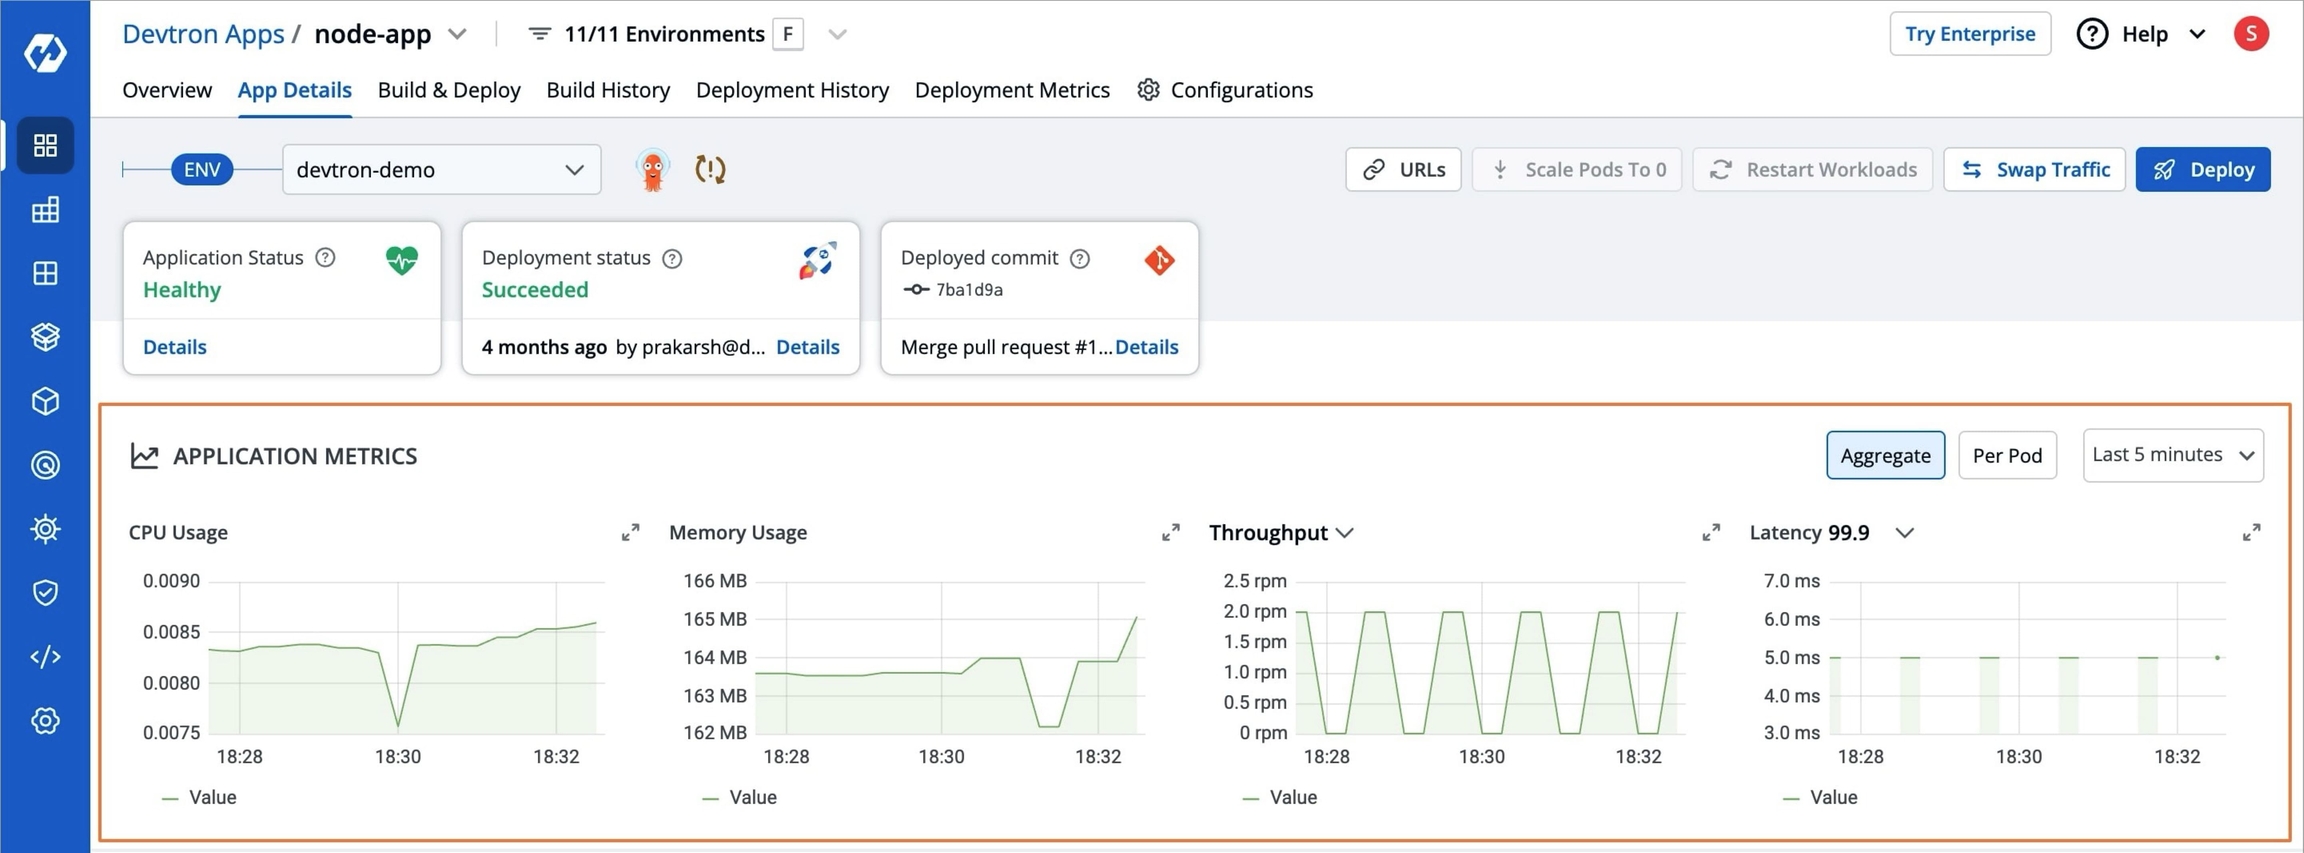
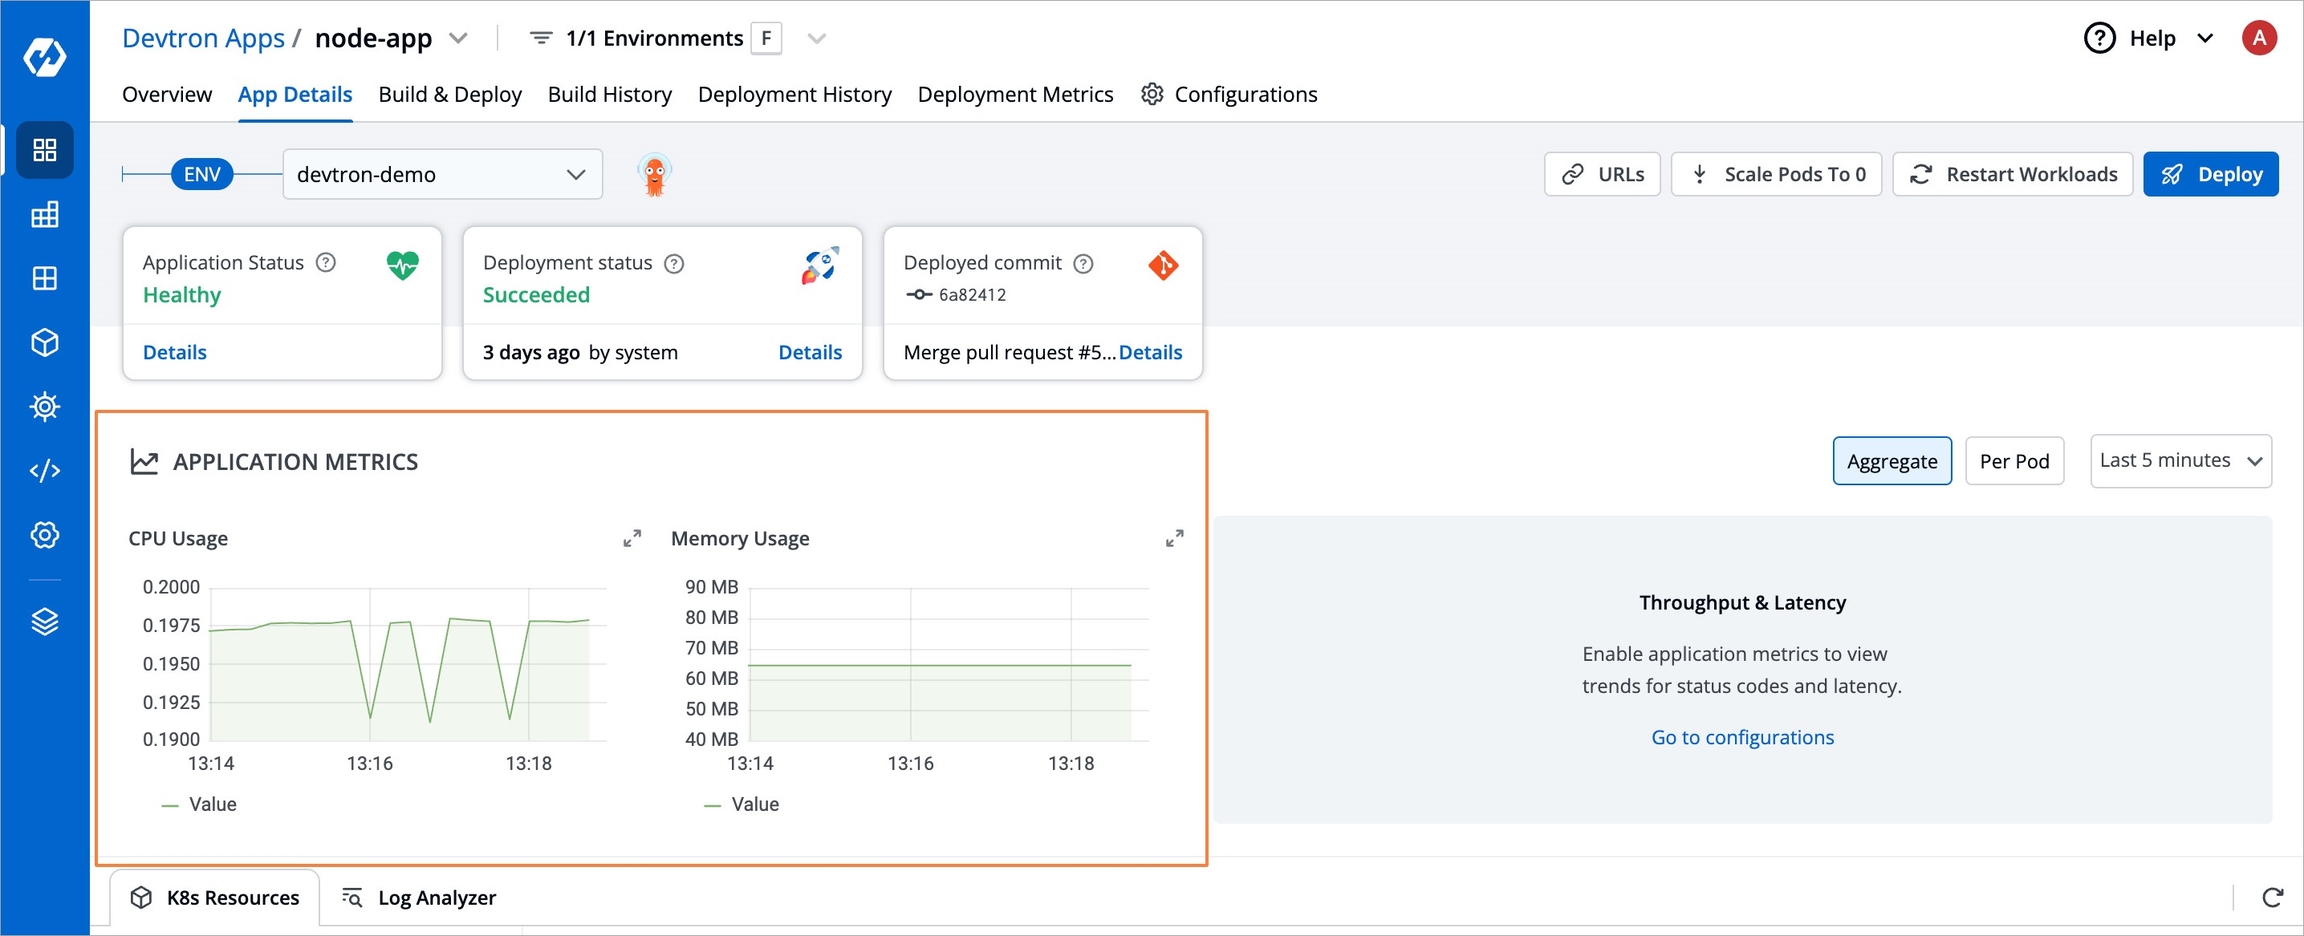
After adding the endpoint in your preferred cluster, CPU usage and Memory usage metrics will be visible in the App Details page for all the Devtron apps in that cluster (it may take a few minutes).
To enable Throughput and Latency metrics in Devtron, follow these steps:
Note
Throughput and Latency metrics will only display data if there is active traffic (i.e., incoming requests) to your application. If there is no traffic, these metrics will show No data.
Open your Devtron app.
Go to Configurations → Base Configurations → Deployment Template.
Enable Application Metrics in the Deployment Template as shown below and save the changes.
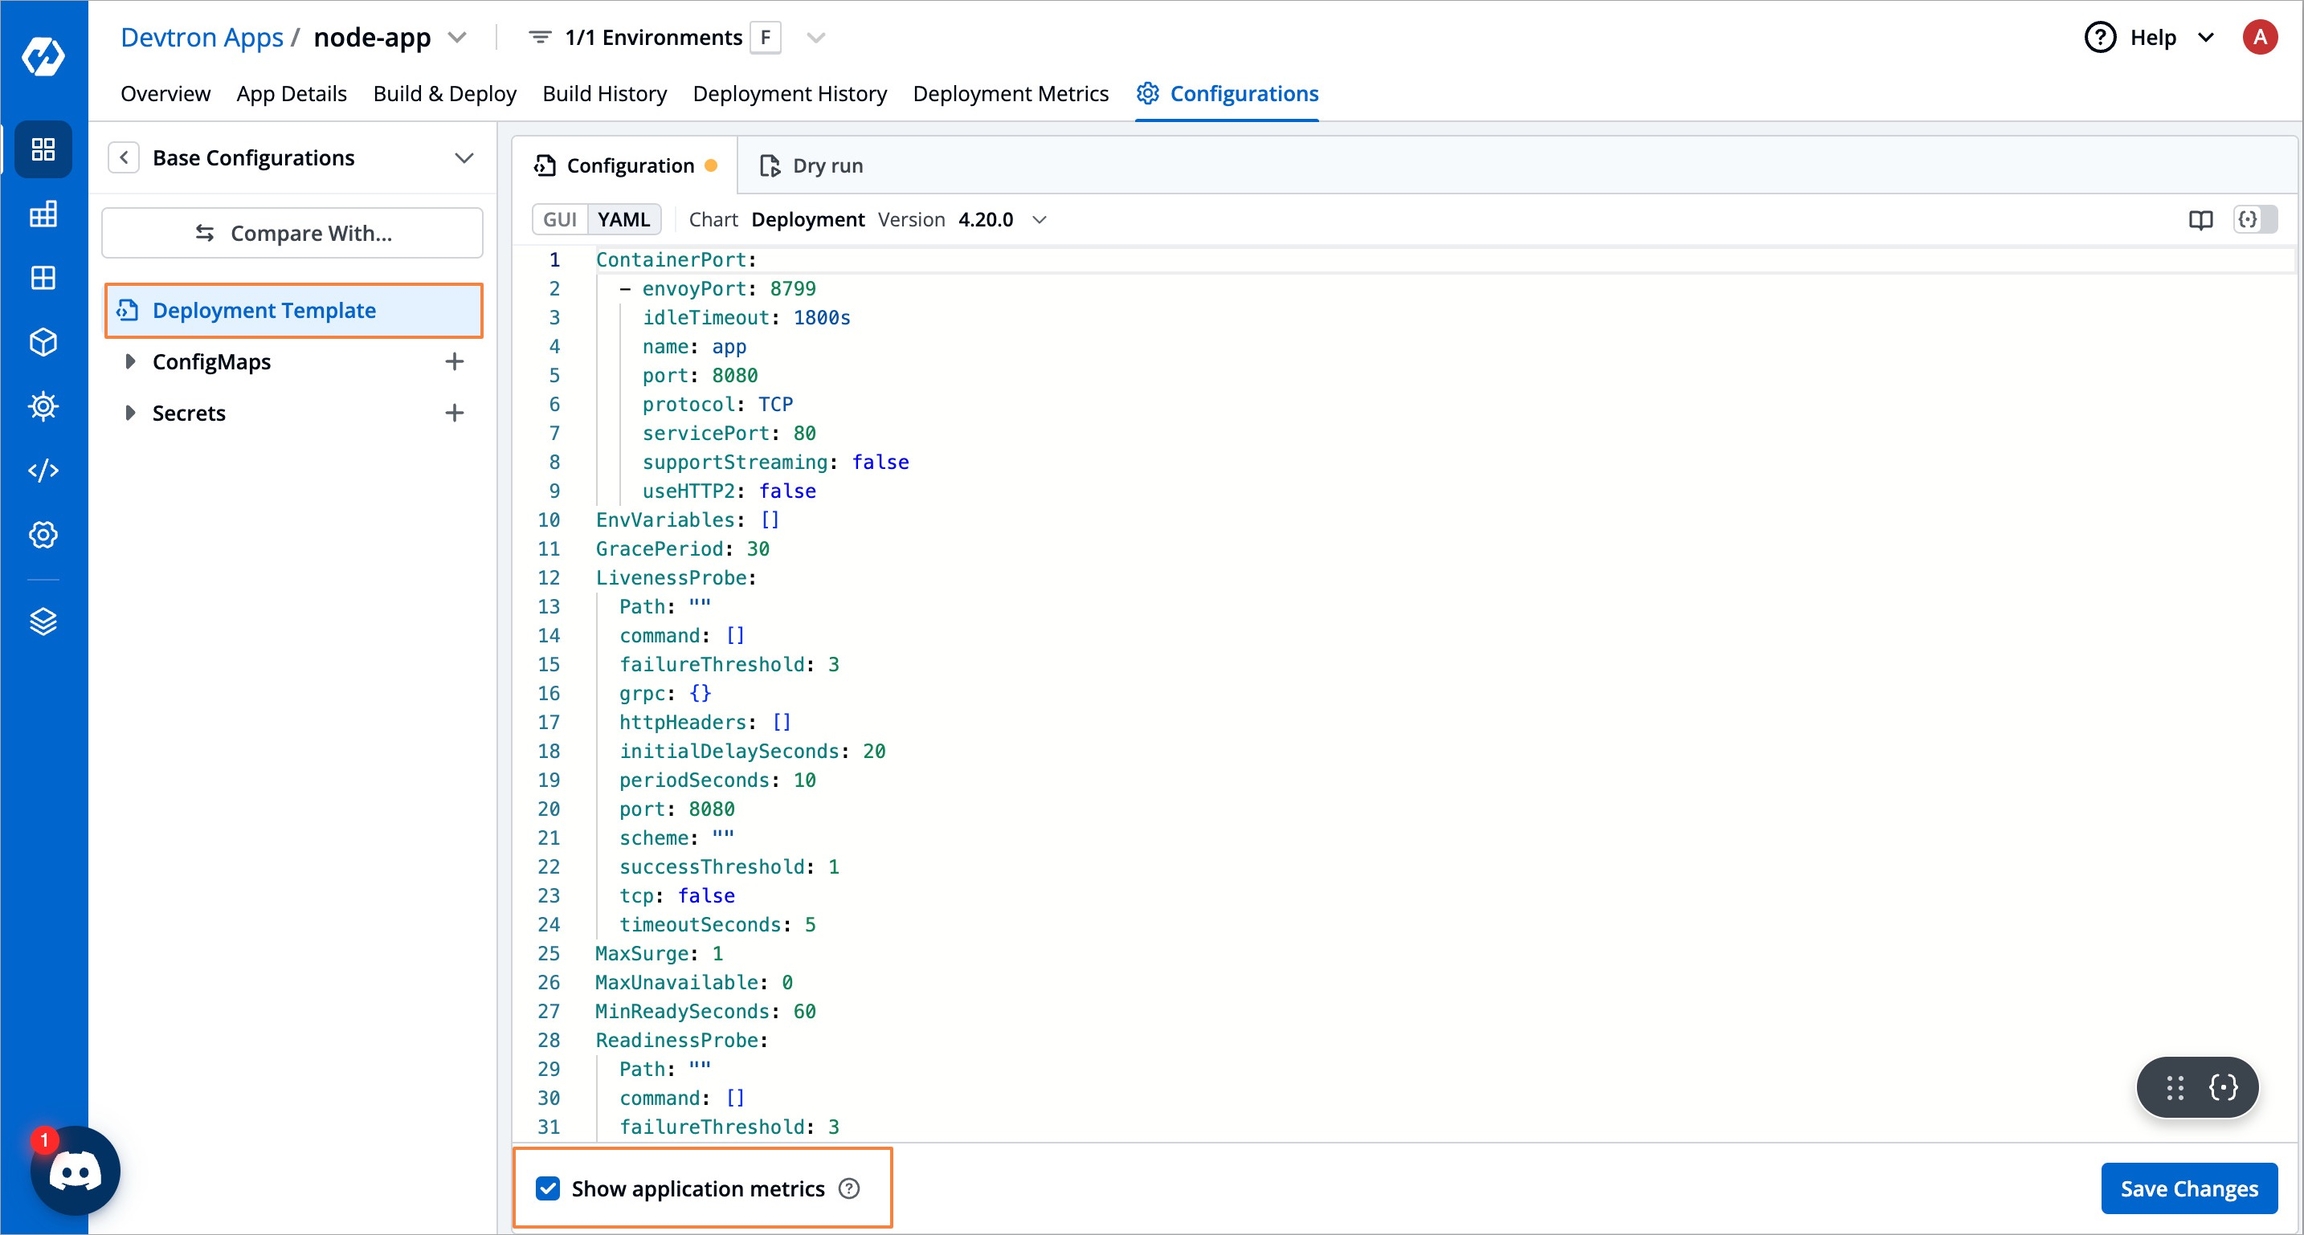
Figure 9: Enable Application Metrics Now, you can track all your application metrics by navigating to Applications and going to the App Details page of your Devtron App as shown below.
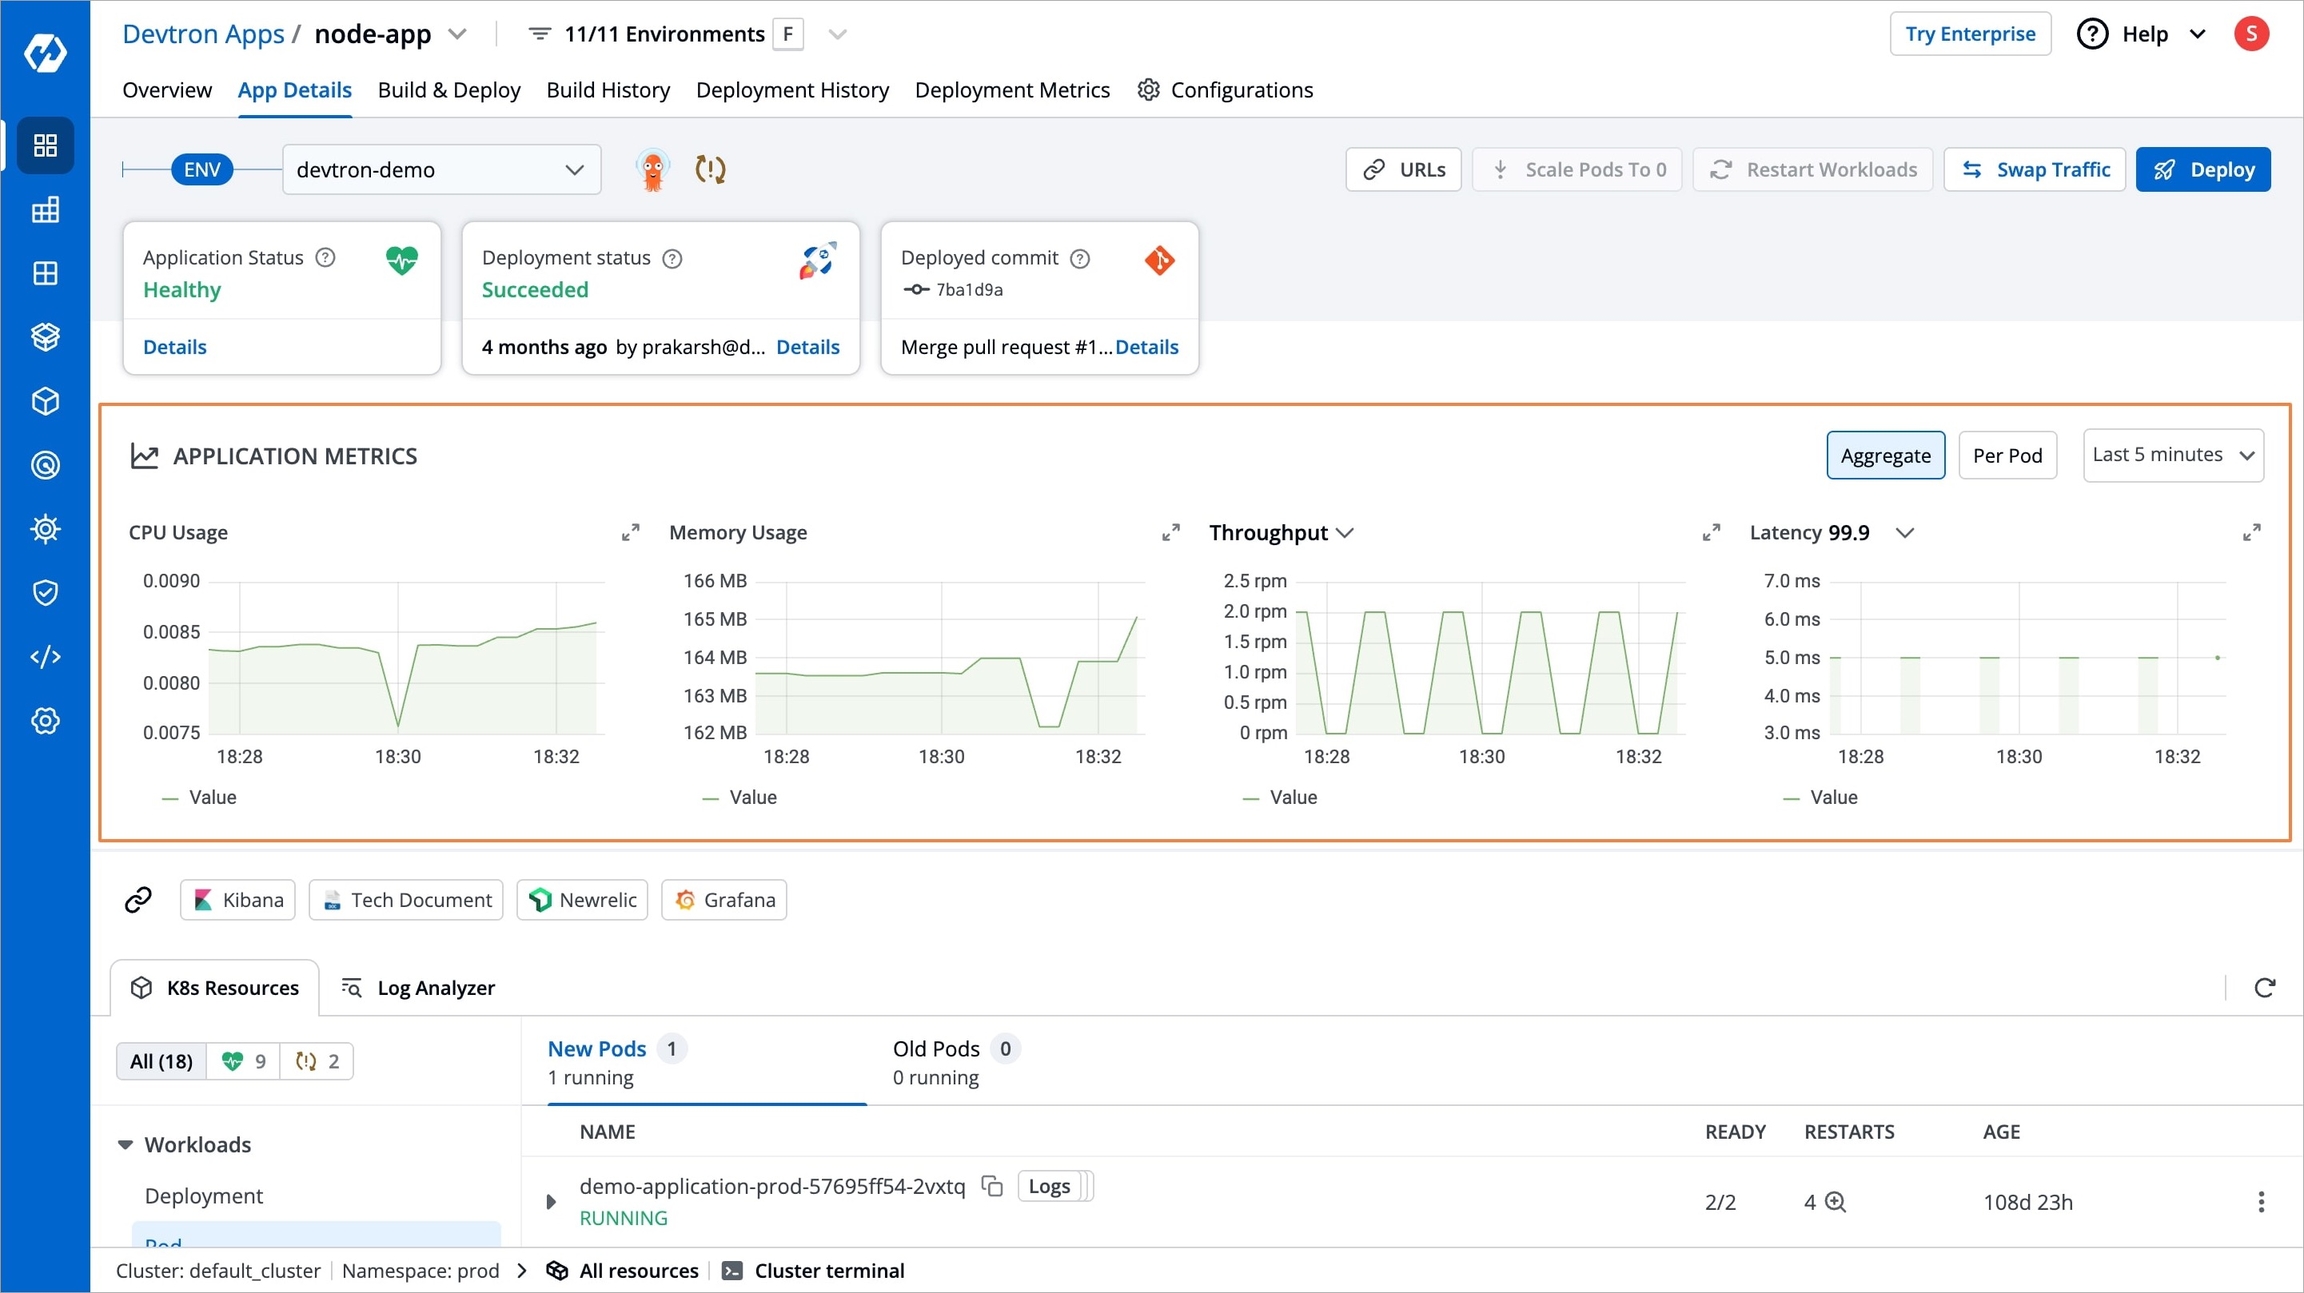
Figure 10: Application Metrics
Note
If your environment is Overridden, you need to enable the Application Metrics at the environment override deployment template instead of the base deployment template.
Troubleshoot Issues
Facing Prometheus Deployment Timeout due to Failed CRDs
While deploying kube-prometheus-stack chart, the deployment status may show as Timed out, and some CustomResourceDefinitions (CRDs) may appear as Failed.
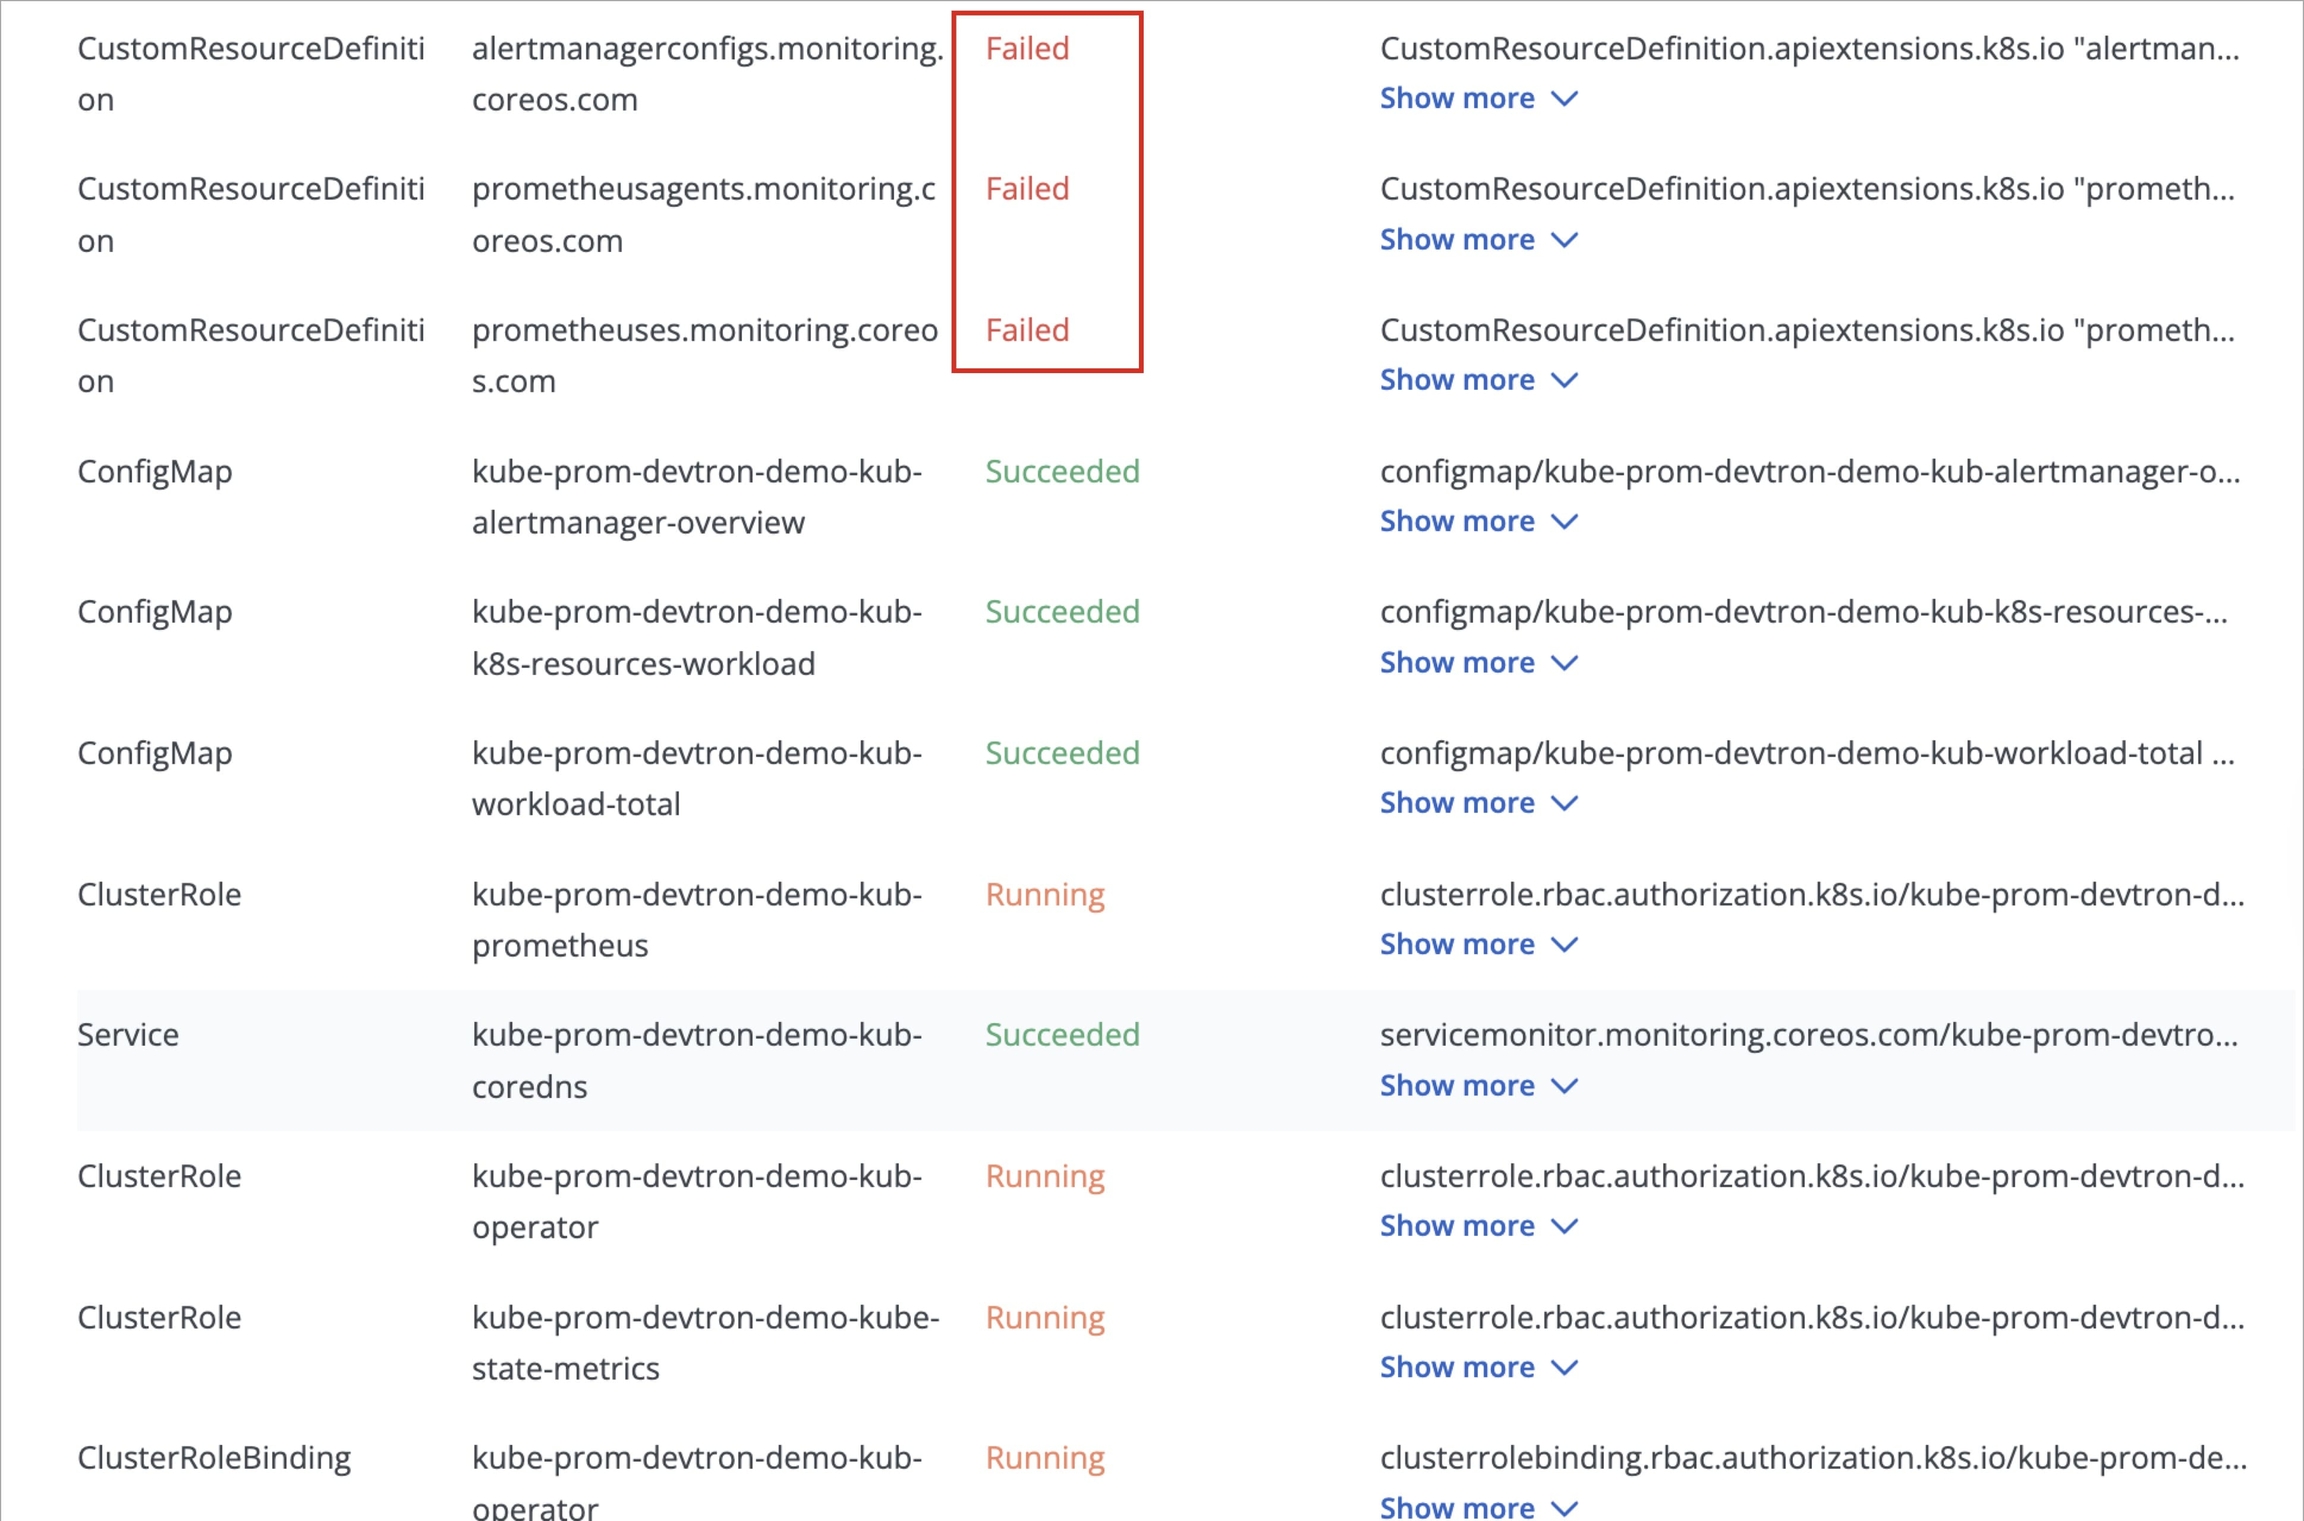
This behavior is expected and do not require any action from you.
This occurs because certain Prometheus CRDs are large in size, which can lead to temporary sync issues during deployment, but, this does not impact the functionality of the Prometheus components.
ArgoCD handles such cases automatically and the kube-prometheus-stack will continue to function as expected.
Last updated
Was this helpful?