Configurations
The Configurations page lets you manage configurations for Cost Visibility in Devtron. You can:
- Set the default currency for all cost-related data.
- Enable or disable cost tracking for your connected clusters.
Currency (Default)
You can select your preferred currency as default.
Enable Cost Tracking
To enable cost visibility for a cluster, follow the below steps:
-
Choose your preferred cluster, and click on Off/Enabled. An Edit Cluster modal window will open.
-
Enable the toggle next to Enable cost tracking.
-
Select the cloud provider in which you have created your cluster.
-
Based on the cloud provider you need to do the following configurations:
- GCP
- Azure
- AWS
To enable cost visibility for Google Cloud in Devtron, you need to generate an API key and use it to connect Devtron with your GCP account.
-
Generate the API key using standard Google Cloud API key documentation.
-
Now go back to the Edit cluster modal window, and enter the API key in the Cloud Provider API Key field.
If you face any issues while enabling or configuring the Cost Visibility module, reach out to Devtron Support Team for assistance.
To enable cost visibility for your Azure clusters in Devtron, you need to allow Devtron to access your billing data securely. This requires two steps:
- Create a custom role in Azure with billing access.
- Create a service principal (an identity) that Devtron can use to fetch cost details.
Step 1: Creating Custom Role
- Open a text editor and copy the following JSON:
{
  "Name": "OpenCostRole",
  "IsCustom": true,
  "Description": "Rate Card query role",
  "Actions": [
      "Microsoft.Compute/virtualMachines/vmSizes/read",
      "Microsoft.Resources/subscriptions/locations/read",
      "Microsoft.Resources/providers/read",
      "Microsoft.ContainerService/containerServices/read",
      "Microsoft.Commerce/RateCard/read"
  ],
  "AssignableScopes": [
      "/subscriptions/YOUR_SUBSCRIPTION_ID"
  ]
}
-
Replace
YOUR_SUBSCRIPTION_IDwith your actual subscription ID. -
Save the file as
myrole.json. -
Run the following command in your terminal:
az role definition create --verbose --role-definition @myrole.json
This creates a role called OpenCostRole with just enough access to read pricing information.
Step 2: Create a Service Principal
- Run the command below, again replacing
YOUR_SUBSCRIPTION_IDwith your subscription ID:
az ad sp create-for-rbac \
  --name "OpenCostAccess" \
  --role "OpenCostRole" \
  --scope "/subscriptions/YOUR_SUBSCRIPTION_ID" \
  --output json
- You’ll get an output like this:
{
   "appId": "1d9b1532-abe4-4e08-b172-adfa5384da1",
   "displayName": "OpenCostAccess",
   "password": "3XxxxxxxxxxxxxxxxxxxX3",
   "tenant": "aee9b2ed-7ecc-4cb2-bfed-60d71c0e957"
}
- Note this information as you need to enter this in Devtron.
Step 3: Enter Details in Devtron
Now go back to the Edit cluster modal window, and fill the following fields:
- Subscription ID - Your Azure subscription ID
- App ID - Value of
appIdfrom the output - Display Name - Value of
displayNamefrom the output - Password - Value of
passwordfrom the output - Tenant - Value of
tenantfrom the output - Billing Account - Optional (fill if available)
- Offer ID - Optional (fill if available)
If you face any issues while enabling or configuring the Cost Visibility module, reach out to Devtron Support Team for assistance.
If you have spot node instances in your AWS cluster, then only you need to do the below additional configurations for your AWS cluster, else you can skip the below configurations
Step 1: Set up a Spot Instance Data Feed
-
Create an S3 bucket
-
Assign full access permissions to the AWS Spot Data Feed service
{
  "Version": "2012-10-17",
  "Statement": [
    {
      "Effect": "Allow",
      "Principal": {
        "Service": "spot.amazonaws.com"
      },
      "Action": "*",
      "Resource": "arn:aws:s3:::devtron-spot-feed/*"
    },
    {
      "Effect": "Allow",
      "Principal": {
        "Service": "spot.amazonaws.com"
      },
      "Action": "*",
      "Resource": "arn:aws:s3:::devtron-spot-feed"
    }
  ]
}
- Run the following command to subscribe to the data feed using the AWS CLI
aws ec2 create-spot-datafeed-subscription \
  --bucket devtron-spot-feed --prefix cost
You can subscribe to the Spot Data Feed for only one S3 bucket at a time. Running the command again updates the feed to the latest bucket.
Step 2: Create an IAM Role or Use Access Keys
You can connect Devtron to AWS cost data using either of the following methods:
IAM Role (Recommended)
Create a Web Identity IAM role for your EKS/EC2 cluster with permissions to access the Spot Data Feed bucket. Attach the following policy (replace CHANGE-ME with your bucket name)
{
  "Version": "2012-10-17",
  "Statement": [
    {
      "Action": [
        "s3:ListAllMyBuckets",
        "s3:ListBucket",
        "s3:Get*"
      ],
      "Resource": [
        "arn:aws:s3:::CHANGE-ME",
        "arn:aws:s3:::CHANGE-ME/*"
      ],
      "Effect": "Allow"
    }
  ]
}
Access Keys (Alternative)
Provide an Access Key and Secret Key with permissions s3:ListBucket and s3:GetObject for the Spot Data Feed bucket.
Step 3: Configure in Devtron
Now go back to the Edit cluster modal window, and fill the following fields:
- Spot Data Bucket - Name of the S3 bucket storing Spot Instance Data Feed
- Spot Data Region - AWS region of the Spot Data Feed
- Spot Data Prefix - Prefix (if any) used for the Spot Data Feed
- Project ID - Your AWS Account ID
- Access Key - (Optional) AWS Access Key with S3 read permissions
- Secret Access Key - (Optional) AWS Secret Access Key with S3 read permissions
- IAM Role - (Recommended) IAM role ARN assigned to the EKS/EC2 cluster for bucket access
- Enter Prometheus endpoint of your cluster. Refer Fetching Prometheus Endpoint to learn more.
Prometheus endpoint should be publicly exposed for the cost visibility to work.
- Click Save, cost visibility will be enabled for the cluster.
After enabling cost visibility, you will see your cluster information after 1 hour in cost visibility module.
Fetching Prometheus Endpoint
Ensure GitOps is configured before deploying Prometheus. If not, Prometheus will default to being deployed via Helm.
Installing Prometheus
-
Go to the Chart Store and search for
prometheus. Use the Prometheus community'skube-prometheus-stackchart to deploy Prometheus.
Figure 1: Chart Store -
After selecting the chart, configure these values as needed before deployment.
kube-state-metrics:
    metricLabelsAllowlist:
    - pods=[*]
serviceMonitorSelectorNilUsesHelmValues: false
podMonitorSelectorNilUsesHelmValues: false
Search for the above parameters, and update them as shown (or customize as needed).

Figure 2a: Prometheus Chart Configuration 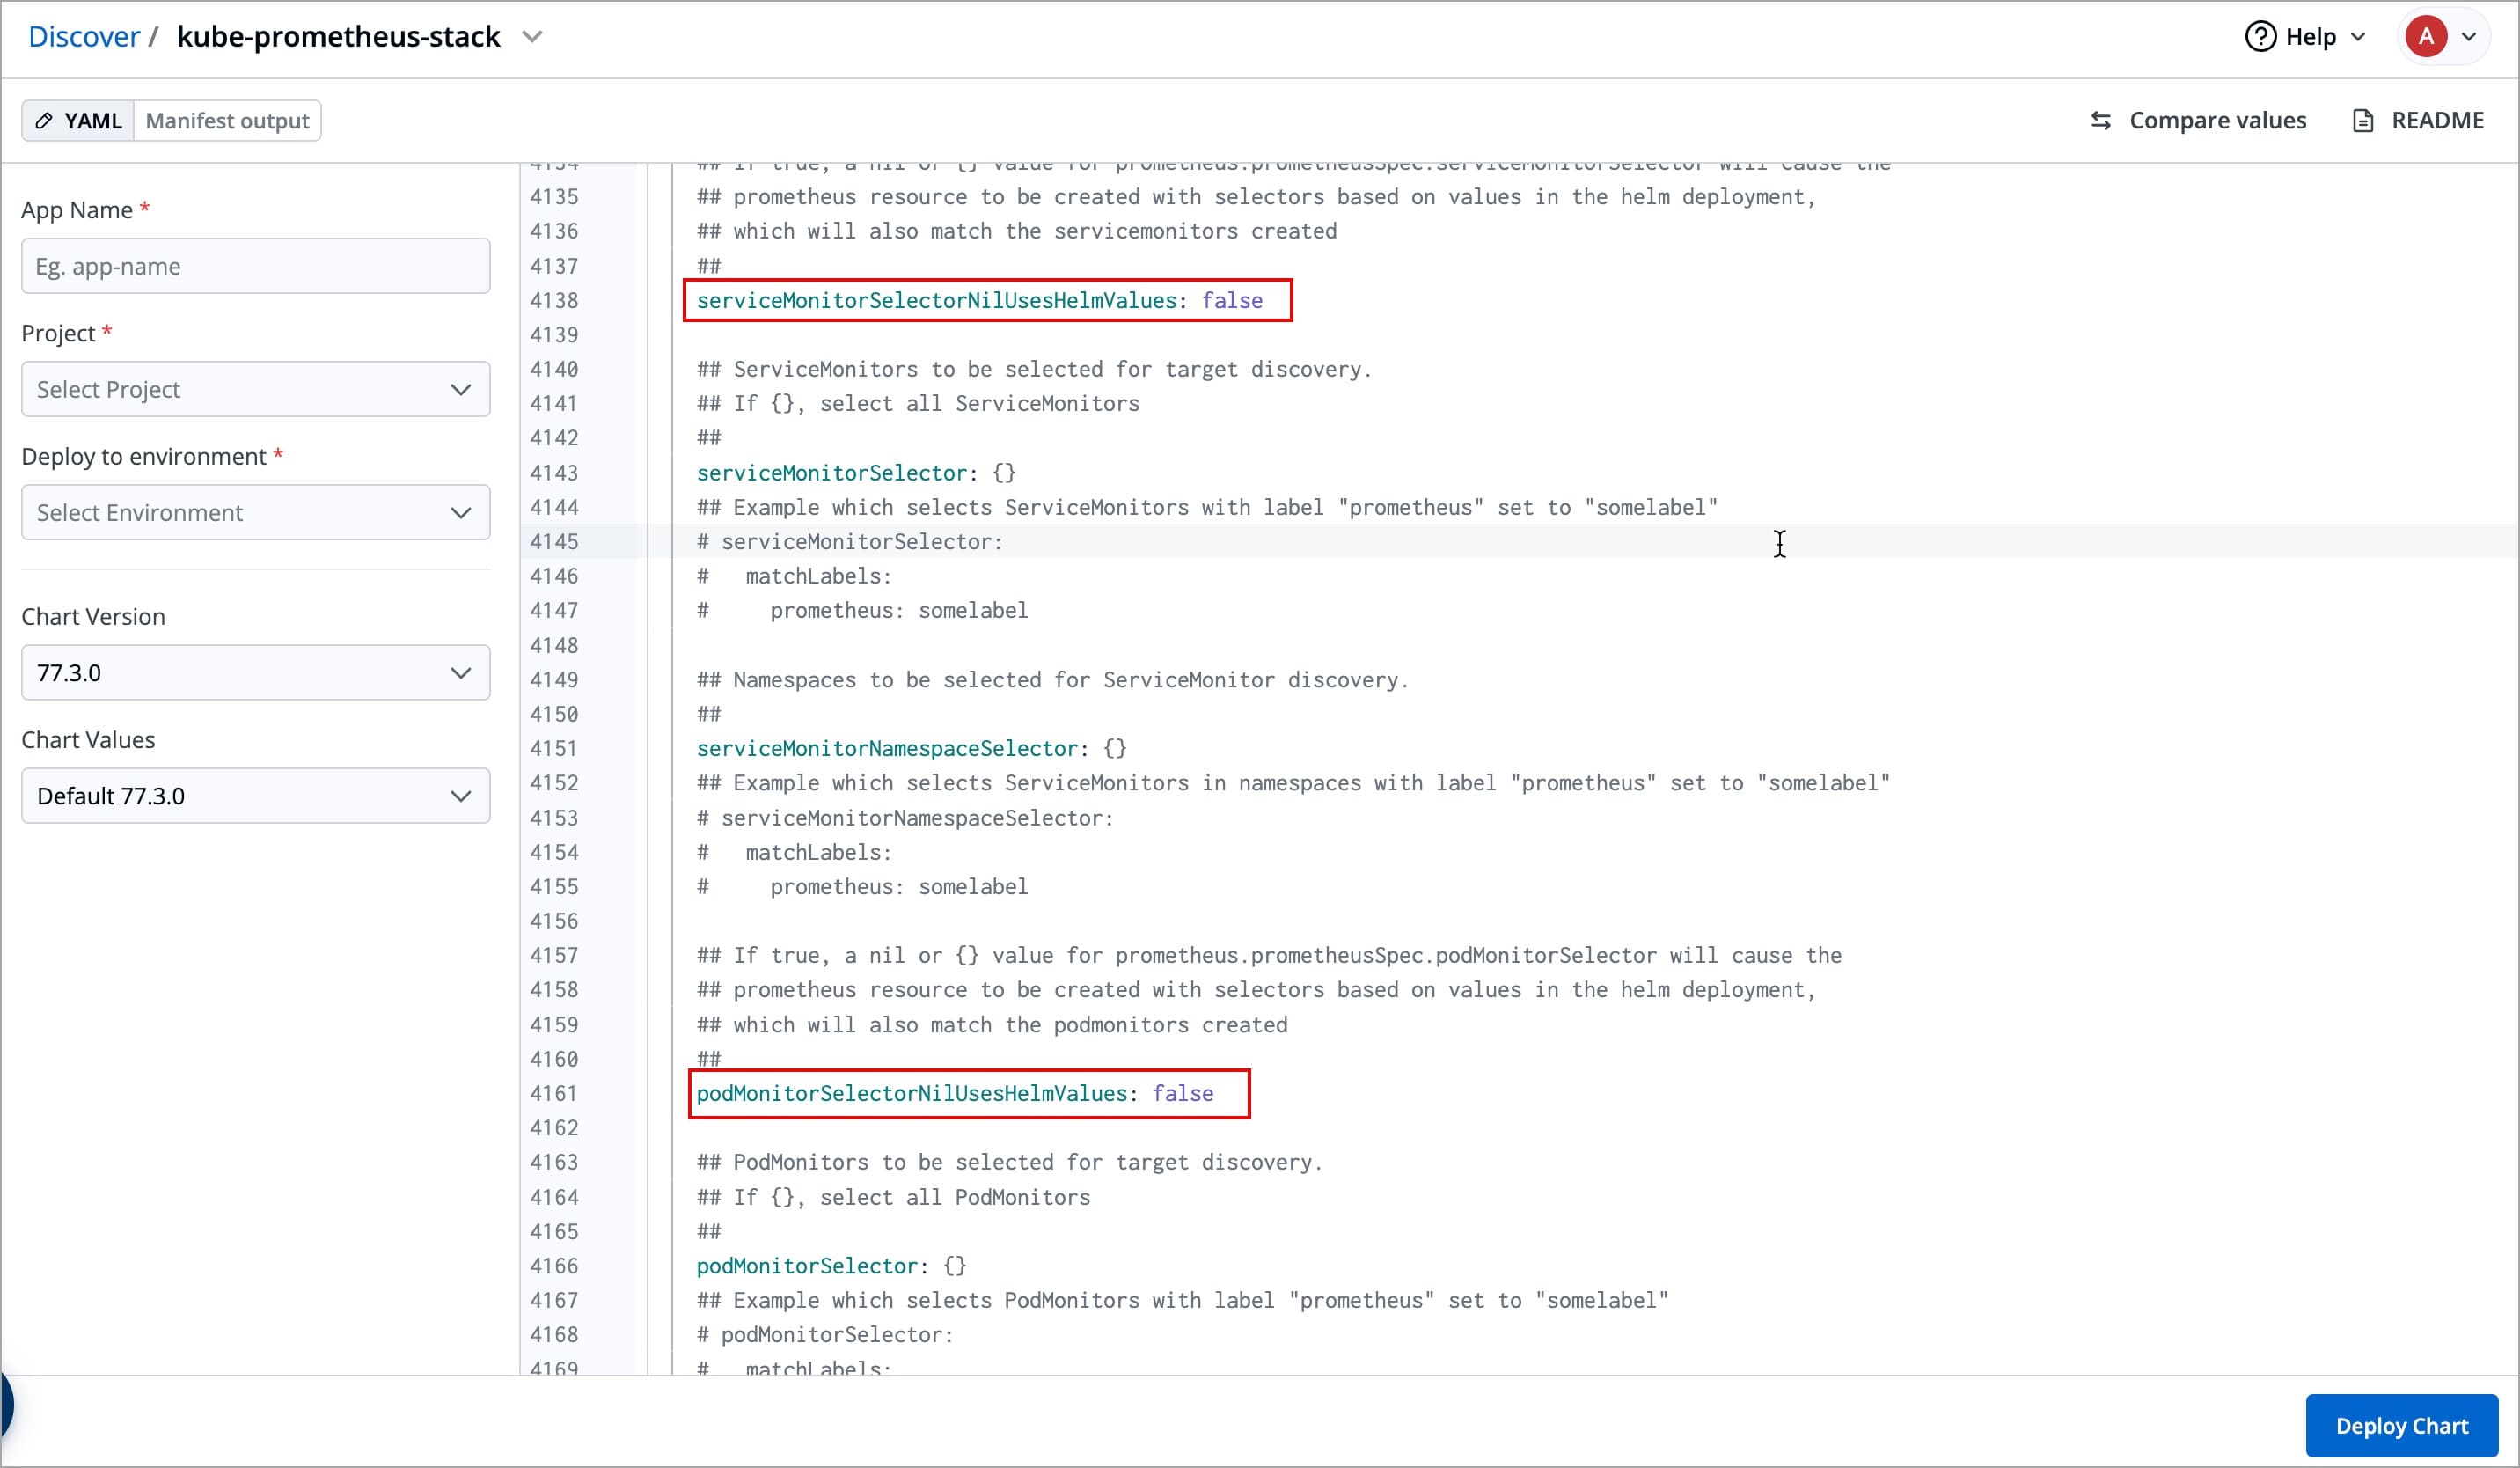
Figure 2b: Prometheus Chart Configuration (cont.) -
Enable
upgradeJobparameter to install CRDs:Since Helm does not automatically apply CRDs, you need to enable the
upgradeJobparameter in the Helm chart to ensure CRDs are applied before deploying Prometheus.In the Prometheus Helm chart settings, locate the
upgradeJobparameter and set it totrueif it isfalse.
Figure 3: upgradeJob Parameter -
After enabling the parameter, click Deploy Chart.
While deploying kube-prometheus-stack chart, the deployment status may show as Timed out, and some CustomResourceDefinitions (CRDs) may appear as Failed. This behavior is expected and does not require any action from you.
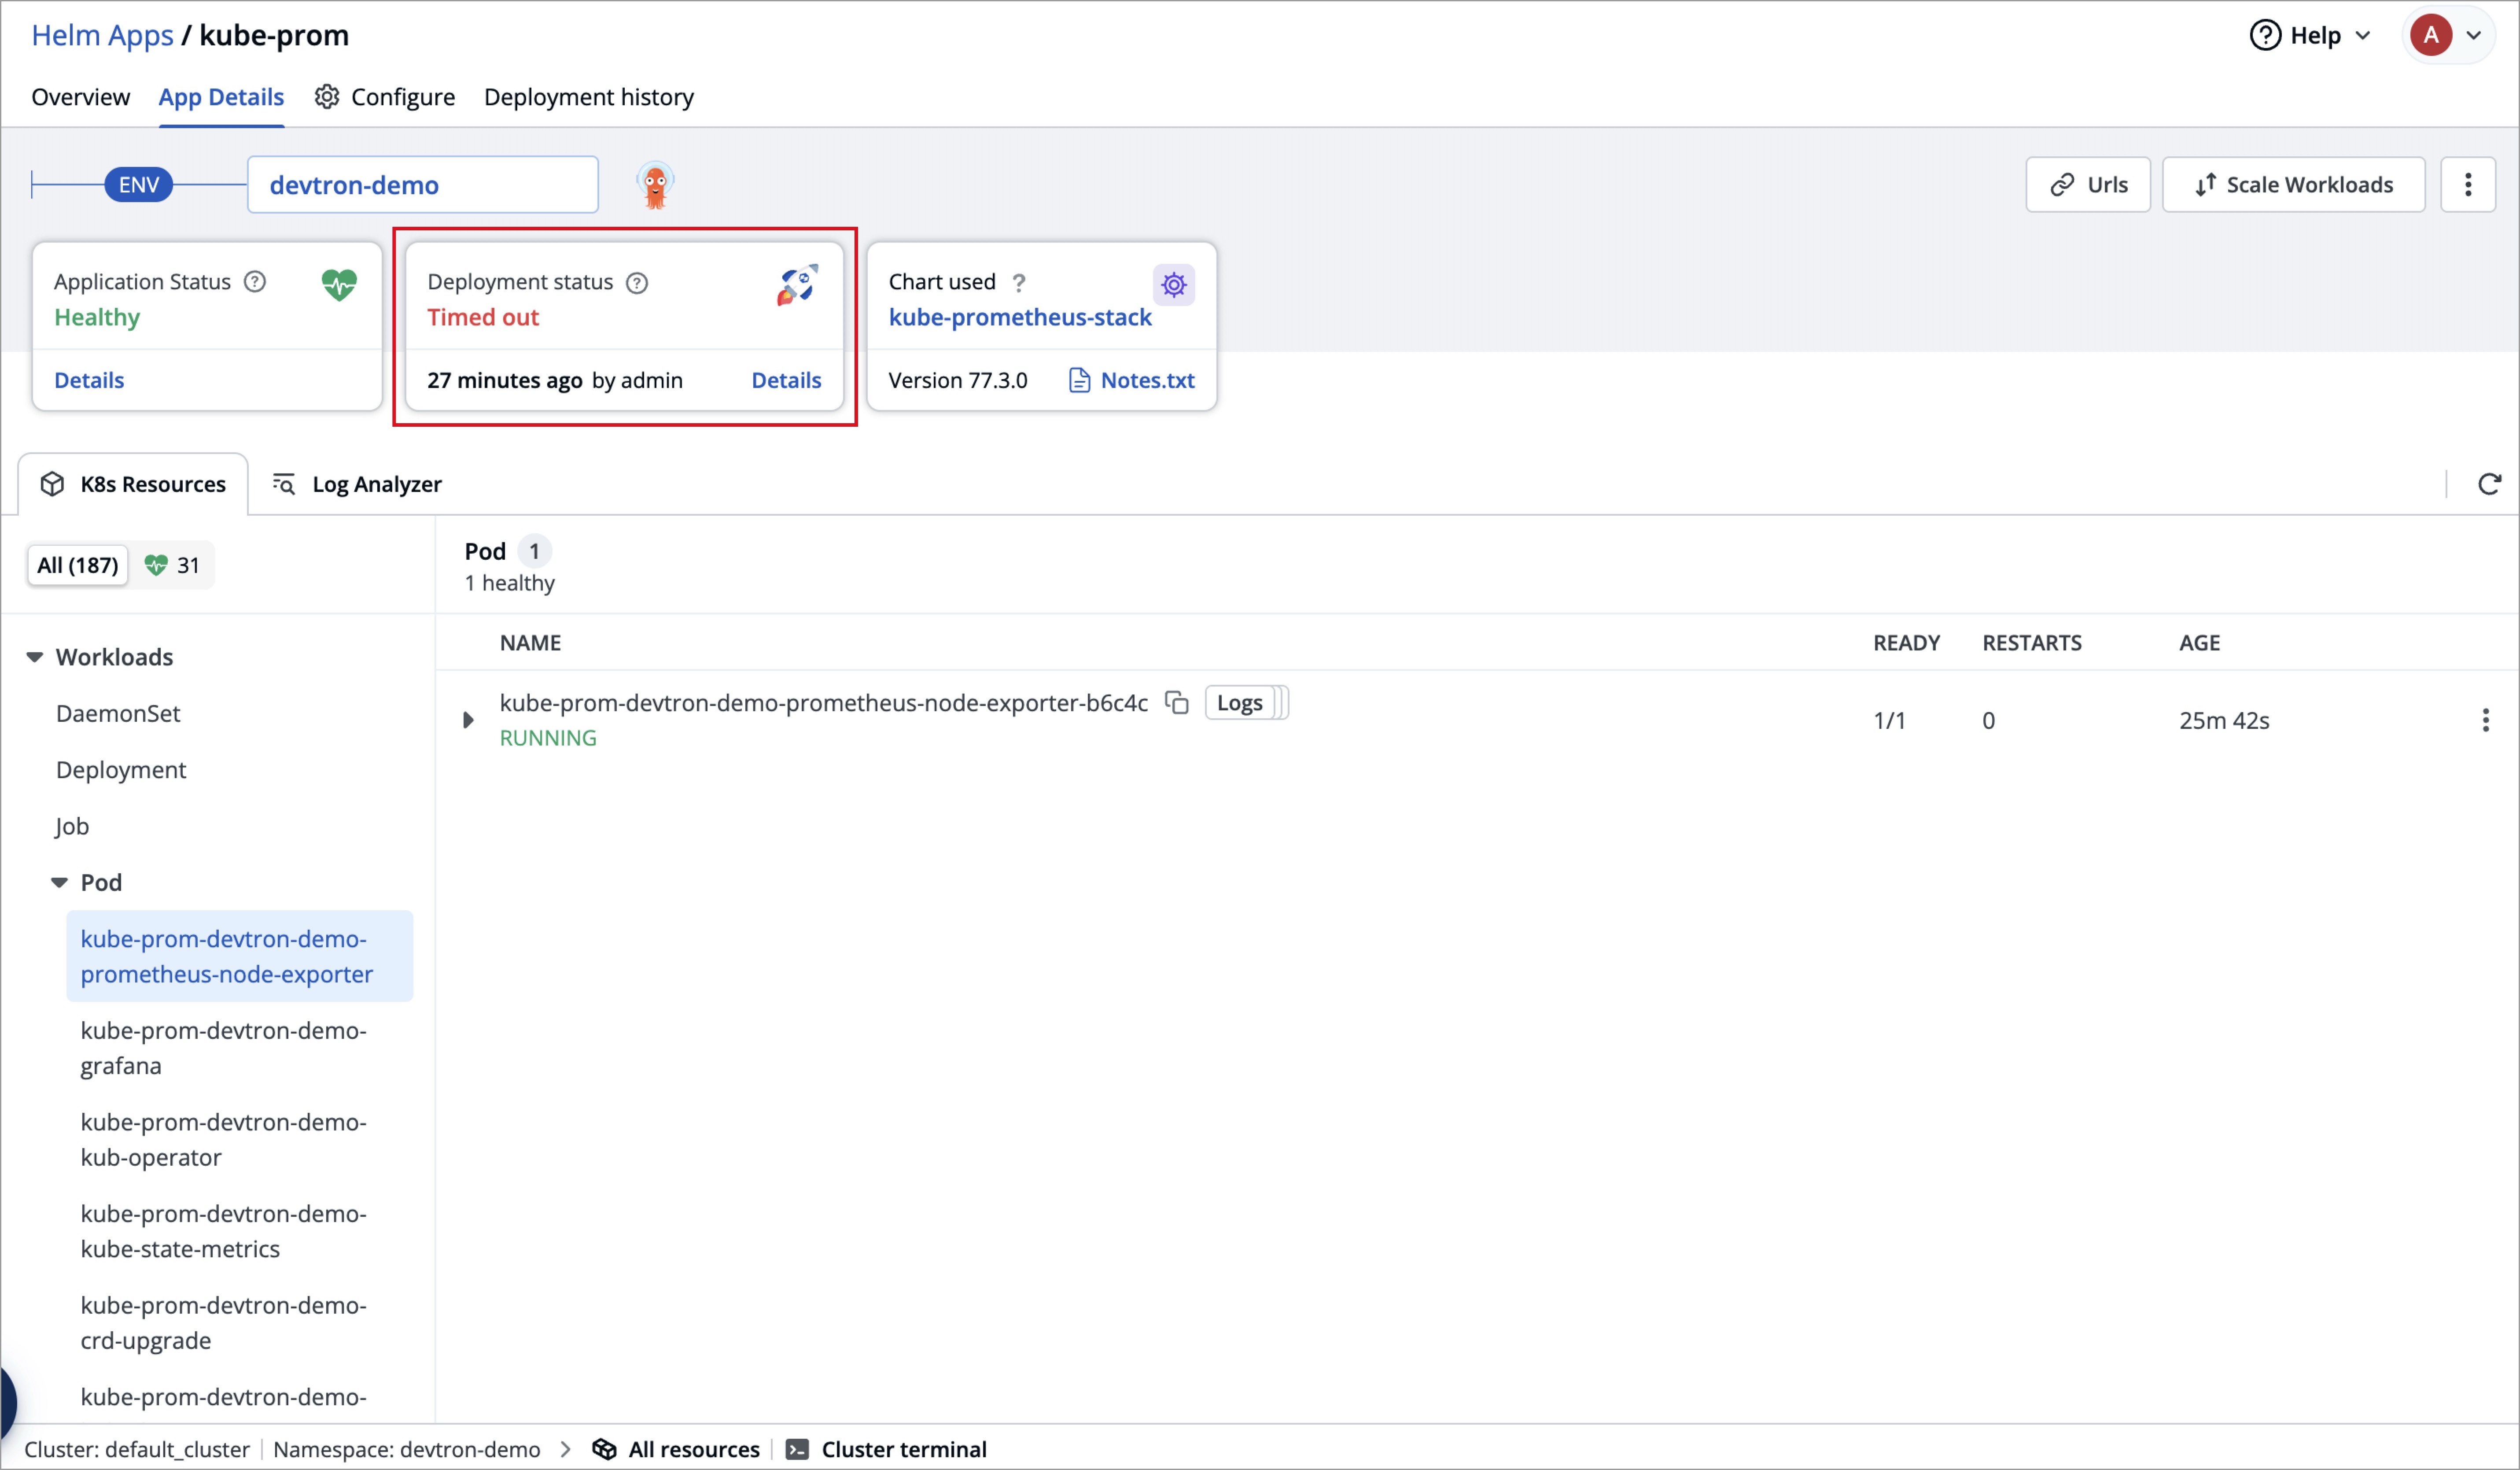
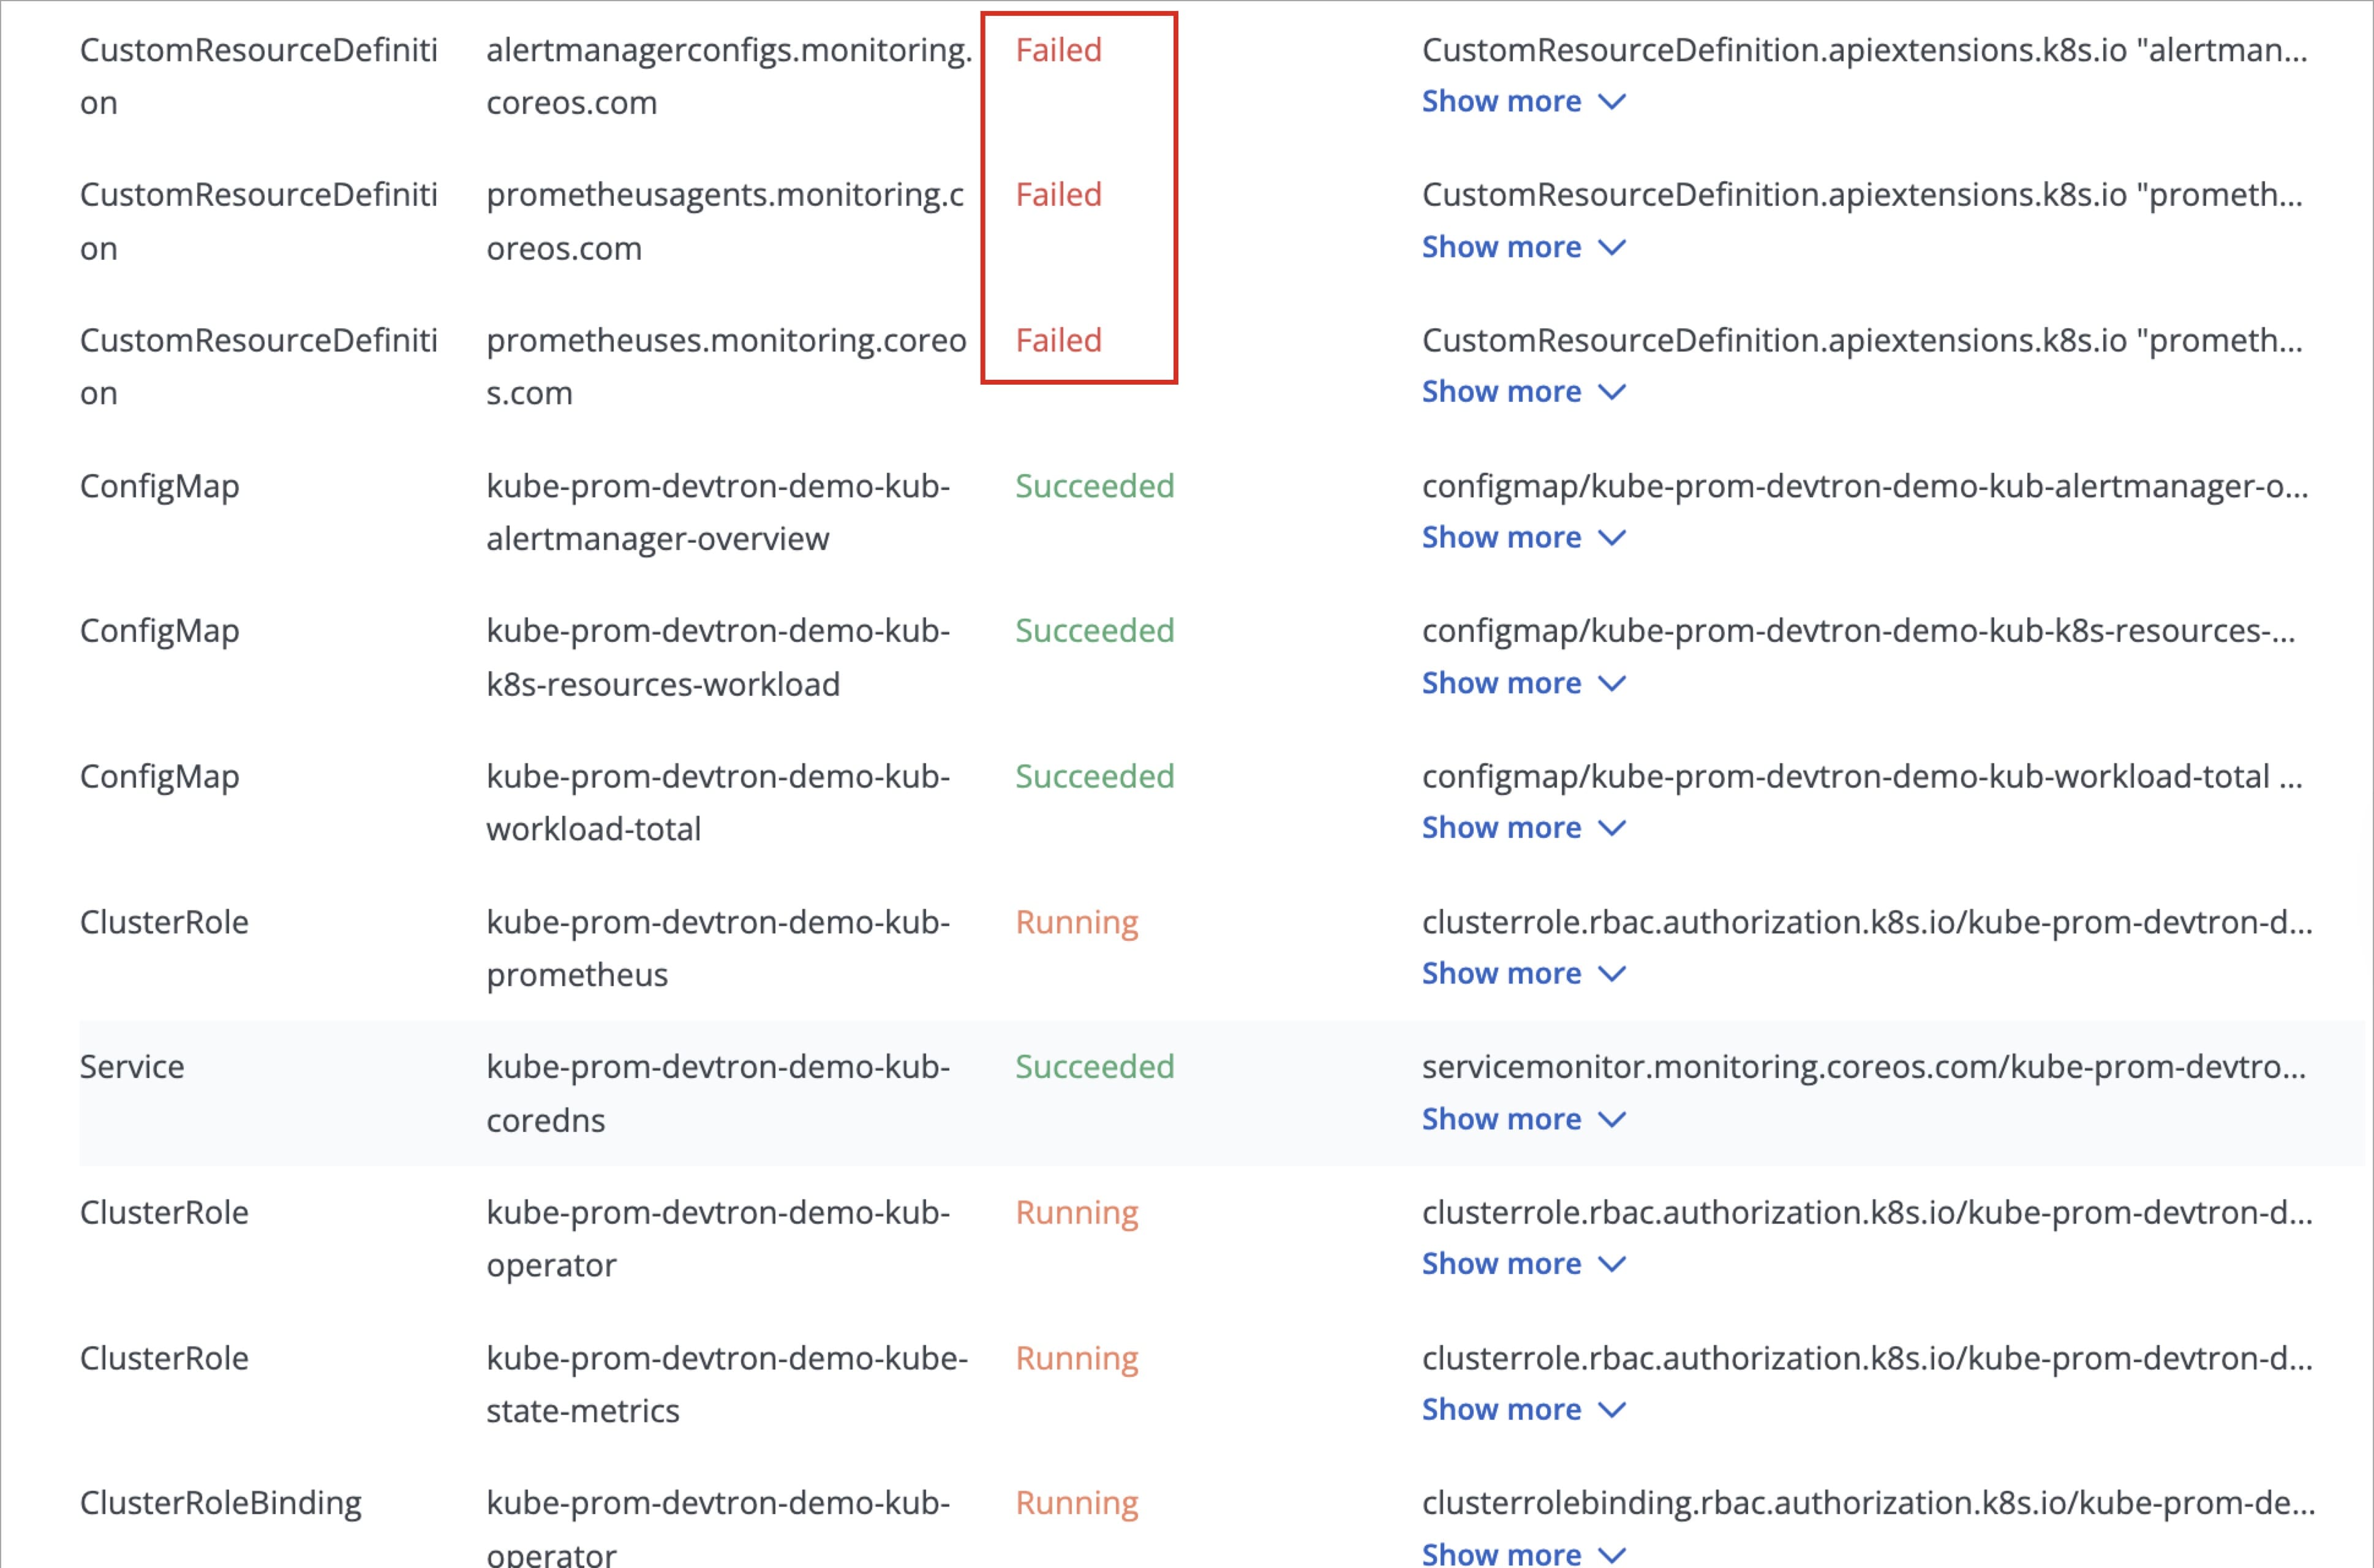
This occurs because certain Prometheus CRDs are large in size, which can lead to temporary sync issues during deployment, but, this does not impact the functionality of the Prometheus components.
ArgoCD handles such cases automatically and the kube-prometheus-stack will continue to function as expected.
- After the chart is deployed successfully, you need to expose the Prometheus endpoint publicly.
If you face any issues while enabling or configuring the Cost Visibility module, please contact the Devtron Support Team for assistance.