Security Overview
The Security Overview page gives you a quick summary of all vulnerabilities found across your active deployments. It helps you to:
- Monitor vulnerabilities across deployments.
- Identify which ones can be fixed immediately.
- Ensure consistent security scanning in workflows.
- Validate that automated blocking policies are working as intended.
By regularly reviewing this dashboard, you can proactively manage risks and maintain a healthy security across your clusters and environments.
At a Glance
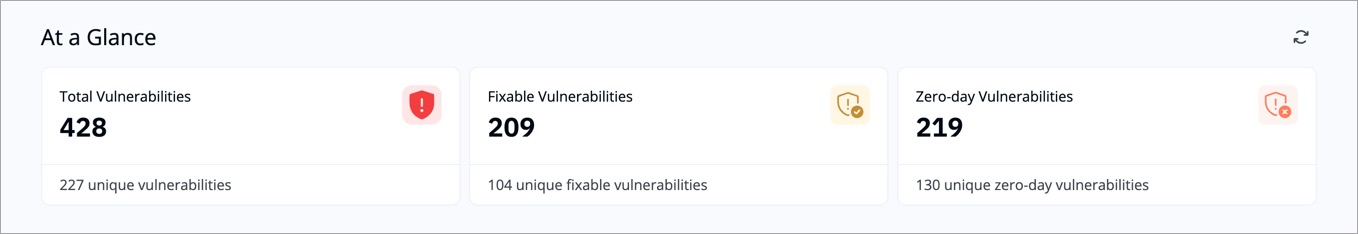
This section provides a snapshot of the key vulnerability metrics in your environment.
| Metric | Description | Example |
|---|---|---|
| Total Vulnerabilities | Total number of vulnerabilities found in active deployments. | Example: 428 vulnerabilities detected across all running apps. |
| Fixable Vulnerabilities | Vulnerabilities that already have fixes or upgrades available. | Example: 209 vulnerabilities can be fixed by updating the base image or library. |
| Zero-day Vulnerabilities | Newly discovered issues that may not yet have patches. | Example: 219 zero-day vulnerabilities were detected last week. |
Use this section to understand overall exposure and prioritize fixable items first.
Severity Insights
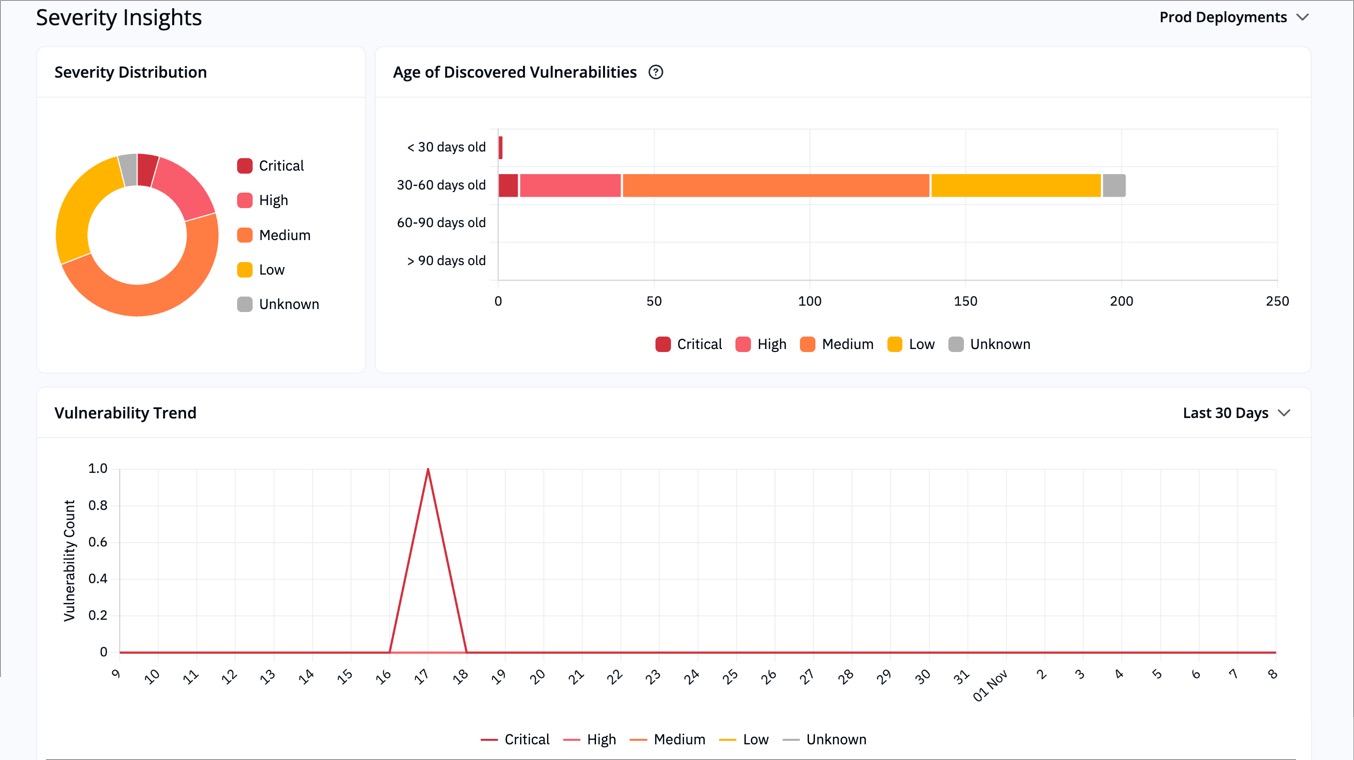
The Severity Insights section helps you understand the nature and age of vulnerabilities in prod and non-prod deployments.
-
Severity Distribution: Pie chart showing proportions of Critical, High, Medium, Low, and Unknown severity.
Example: 60% of all findings are High or Critical, suggesting an immediate need for patching. -
Age of Discovered Vulnerabilities: Groups vulnerabilities by how long they’ve existed in deployments.
Example: Most Critical issues are older than 60 days, indicating delayed remediation. -
Vulnerability Trend: Shows daily changes in vulnerability count over the selected time period (upto 90 days).
Example: A spike on 18th Oct could mean a new deployment introduced fresh vulnerabilities.
These visuals help you identify aging vulnerabilities, observe trends, and measure the impact of remediation efforts.
Deployment Security Status
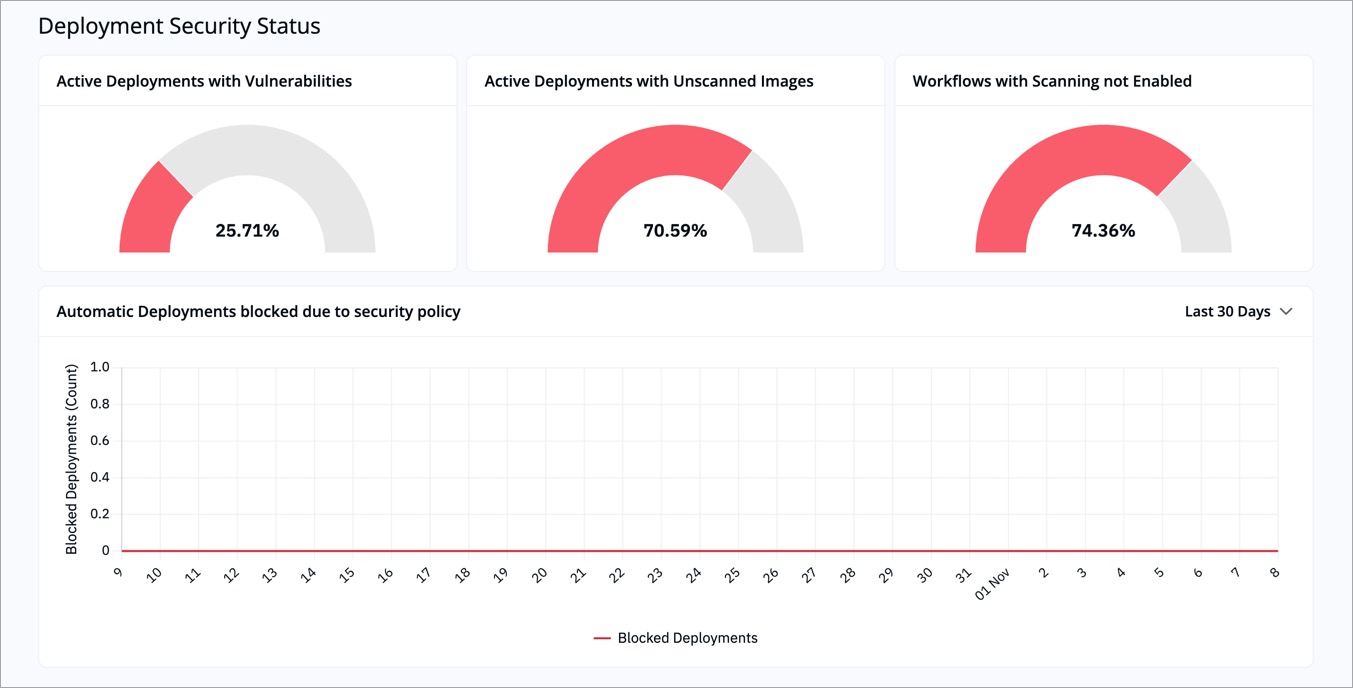
The Deployment Security Status section highlights the current security health of your active deployments and pipelines.
| Indicator | Description | Example |
|---|---|---|
| Active Deployments with Vulnerabilities | Percentage of deployments that contain at least one known vulnerability. | Example: 25.7% of all running deployments have vulnerabilities. |
| Active Deployments with Unscanned Images | Percentage of deployments where image scans have not been performed. | Example: 70.5% of deployments use unscanned images, which can hide potential risks. |
| Workflows with Scanning not Enabled | Percentage of CI/CD workflows that are missing security scanning steps. | Example: 74.3% of pipelines don’t have scanning enabled. |
| Blocked Deployments | Count of deployments automatically blocked by security policies over a period of time (upto 90 days) | Example: 1 deployment was blocked in the past 30 days due to a failed security check. |
Use these indicators to verify that scanning coverage is consistent and your automated policies are functioning as expected.
How to Use the Overview
-
Track trends
Use the charts to see if vulnerabilities are increasing or decreasing over time. -
Prioritize fixes
Focus first on Critical and High vulnerabilities that have available fixes. -
Improve scanning coverage
Reduce the number of unscanned images and workflows without scanning steps. -
Review blocking rules
If too many deployments are blocked, revisit your policy thresholds to strike the right balance between security and delivery speed.
Example Scenario
Let's say your overview page shows: 428 total vulnerabilities, 70% unscanned images, critical issues older than 60 days, you can take the following actions:
- Enable scanning for all pipelines and image registries.
- Rebuild or patch outdated base images.
- Set SLAs to ensure Critical issues are remediated within a defined timeframe.