Loading...
Loading...
Loading...
Loading...
Loading...
Loading...
Loading...
Let's assume that you are creating an application and want to use mongodb to store data of your application. You can deploy mongodb using stable/mongodb-replicaset Helm chart and connect it to your application.
This guide will introduce you to how to deploy the mongoDB's Helm chart.
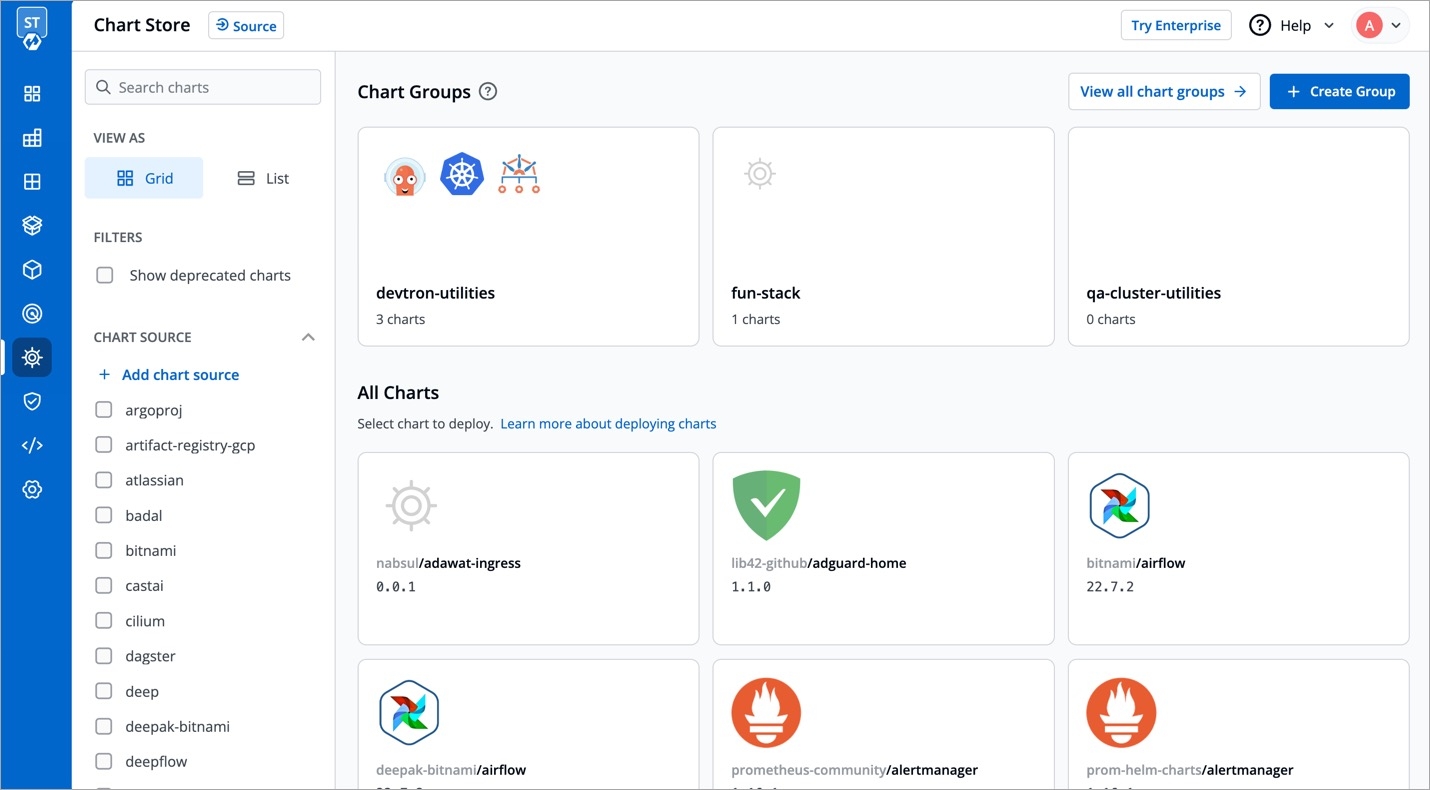
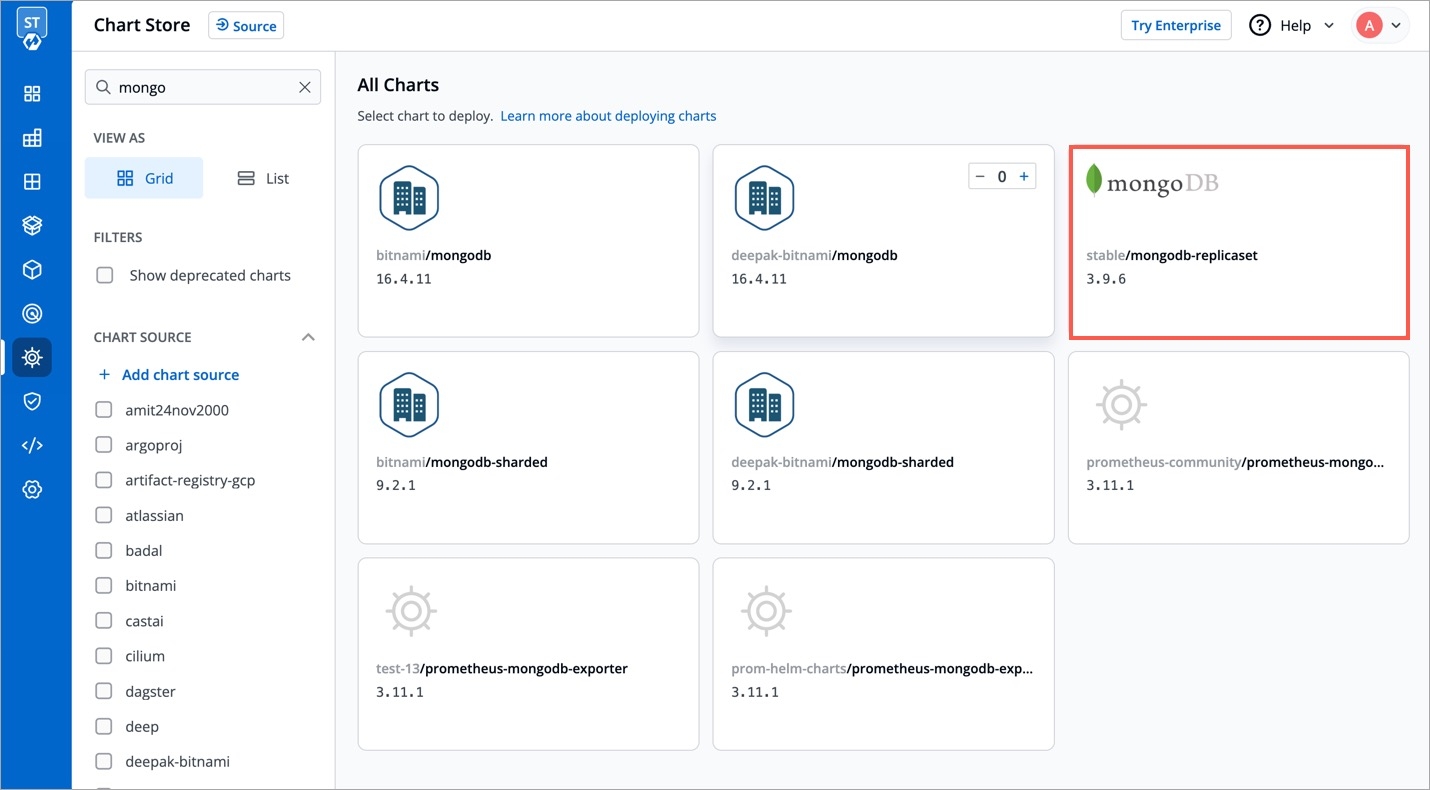
Visit the Chart Store page by clicking on Charts present on left panel and find stable/mongodb-replicaset Helm Chart. You also can search mongodb chart using the search bar.
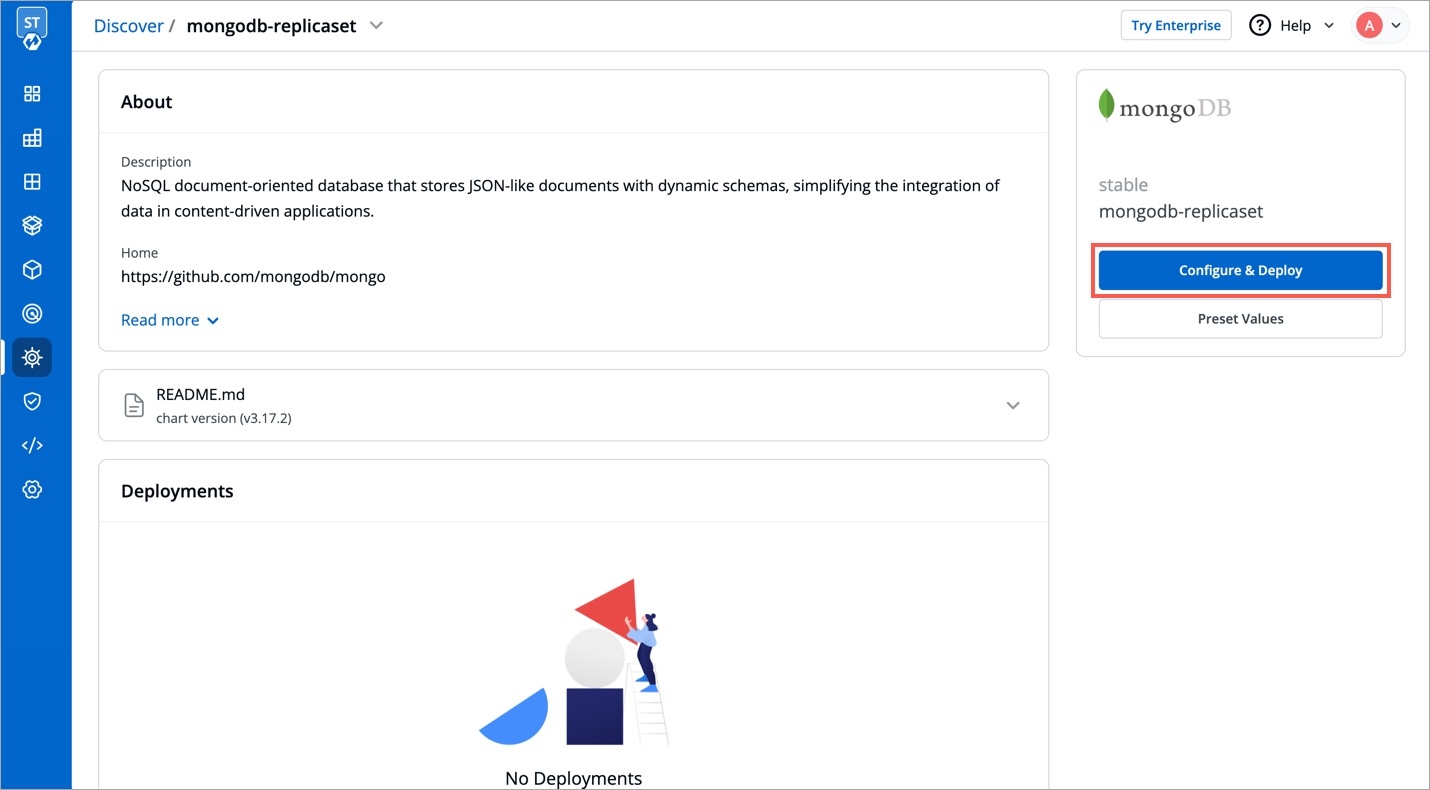
After selecting the stable/mongodb Helm chart, click on Deploy.
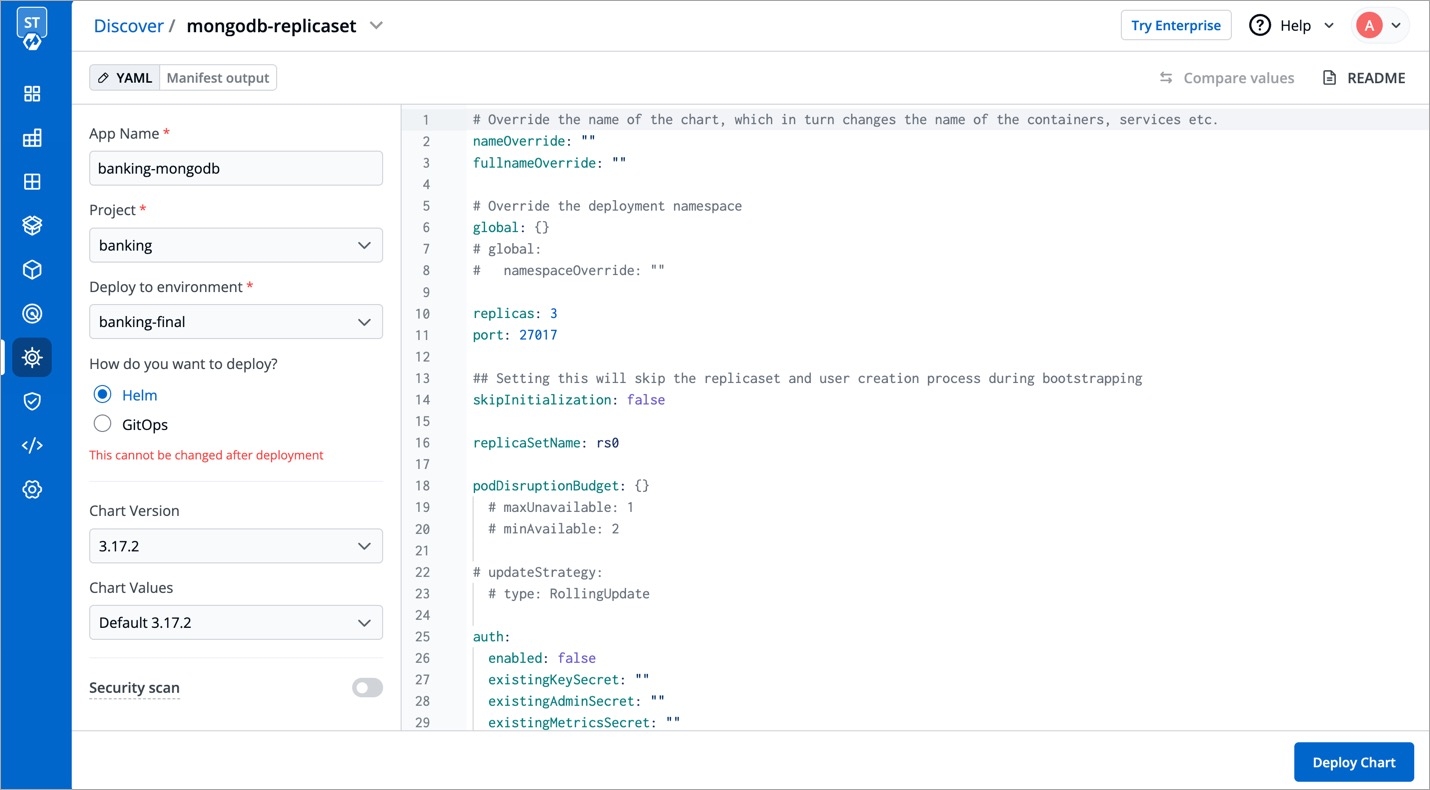
Enter the following details before deploying the mongoDB chart:
values.yamlYou can configure the values.yaml according to your project's requirements. To learn about different parameters used in the chart, you can check Documentation of mongodb Helm chart
Click on Deploy Chart once you have finished configuring the chart.
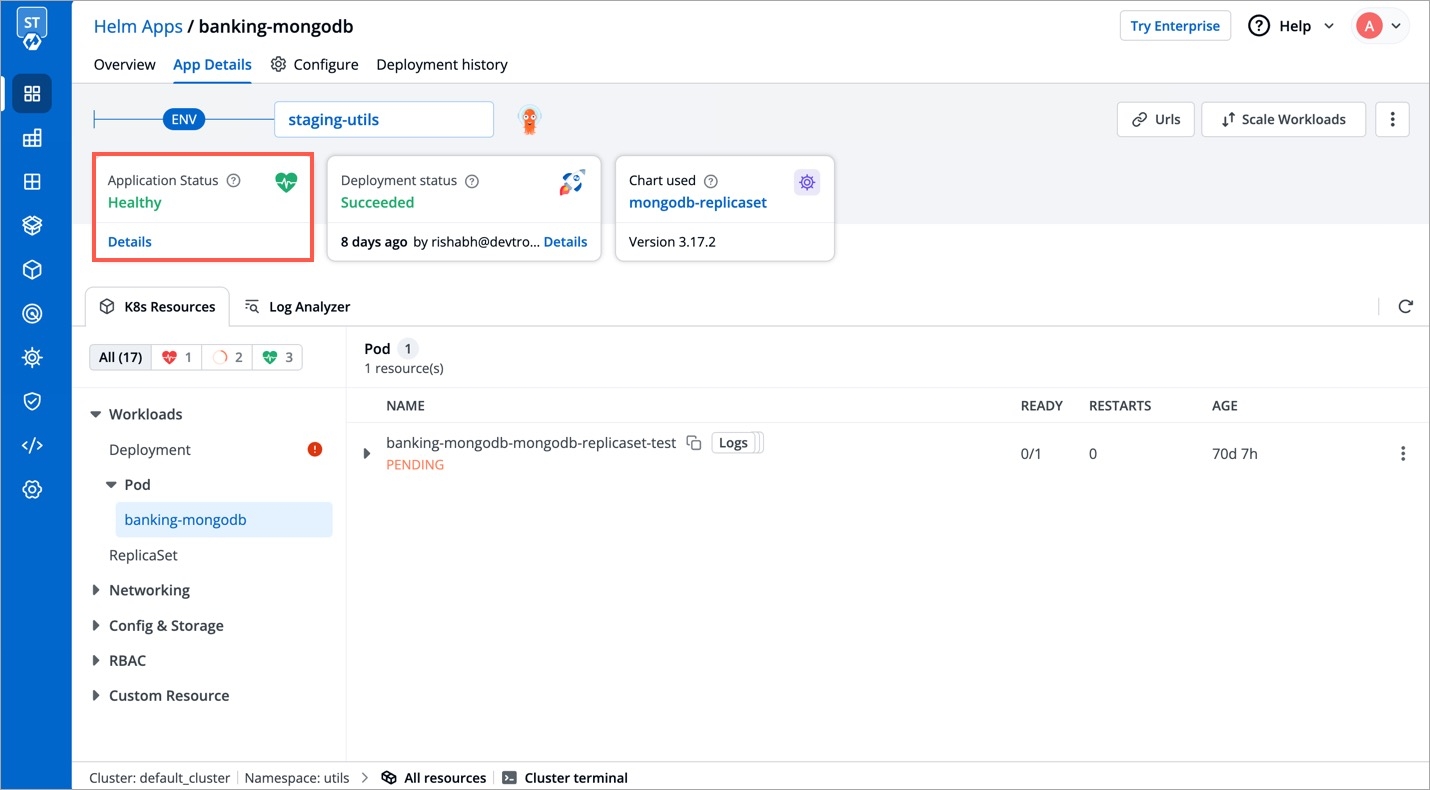
After clicking on Deploy Chart, you will be redirected to App Details page that shows the deployment status of the chart. The Status of the chart should be Healthy. It might take few seconds after initiating the deployment.
In case the status of the deployment is Degraded or takes a long time to get deployed, click on Status or check the logs of the pods to debug the issue.
Copy the service name, it will be used to connect your application to mongoDB.
Using Devtron UI, one or more Helm charts can be grouped and deployed together with a single click.
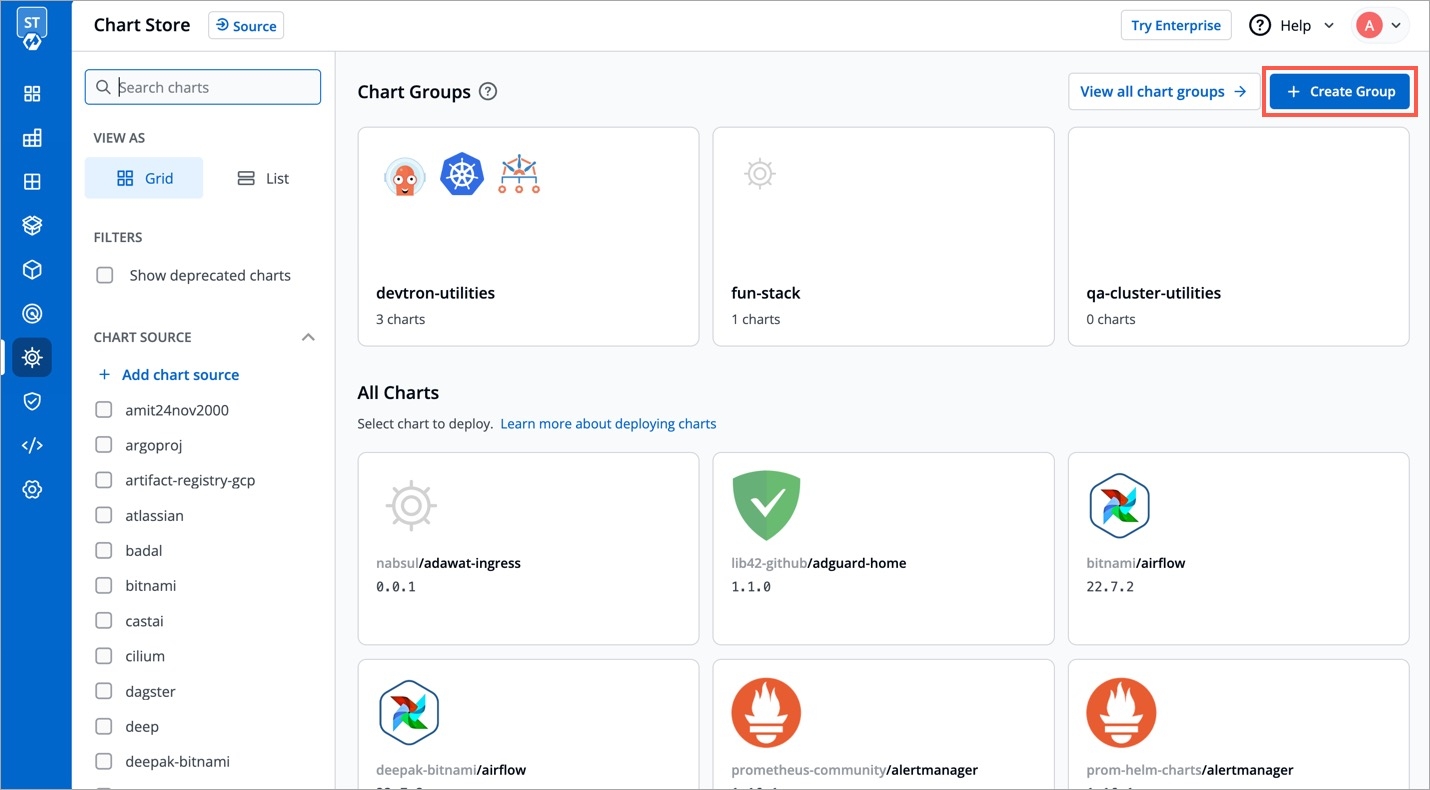
In the left pane, select Charts.
On the Chart Store page, select Create Group from the upper-right corner.
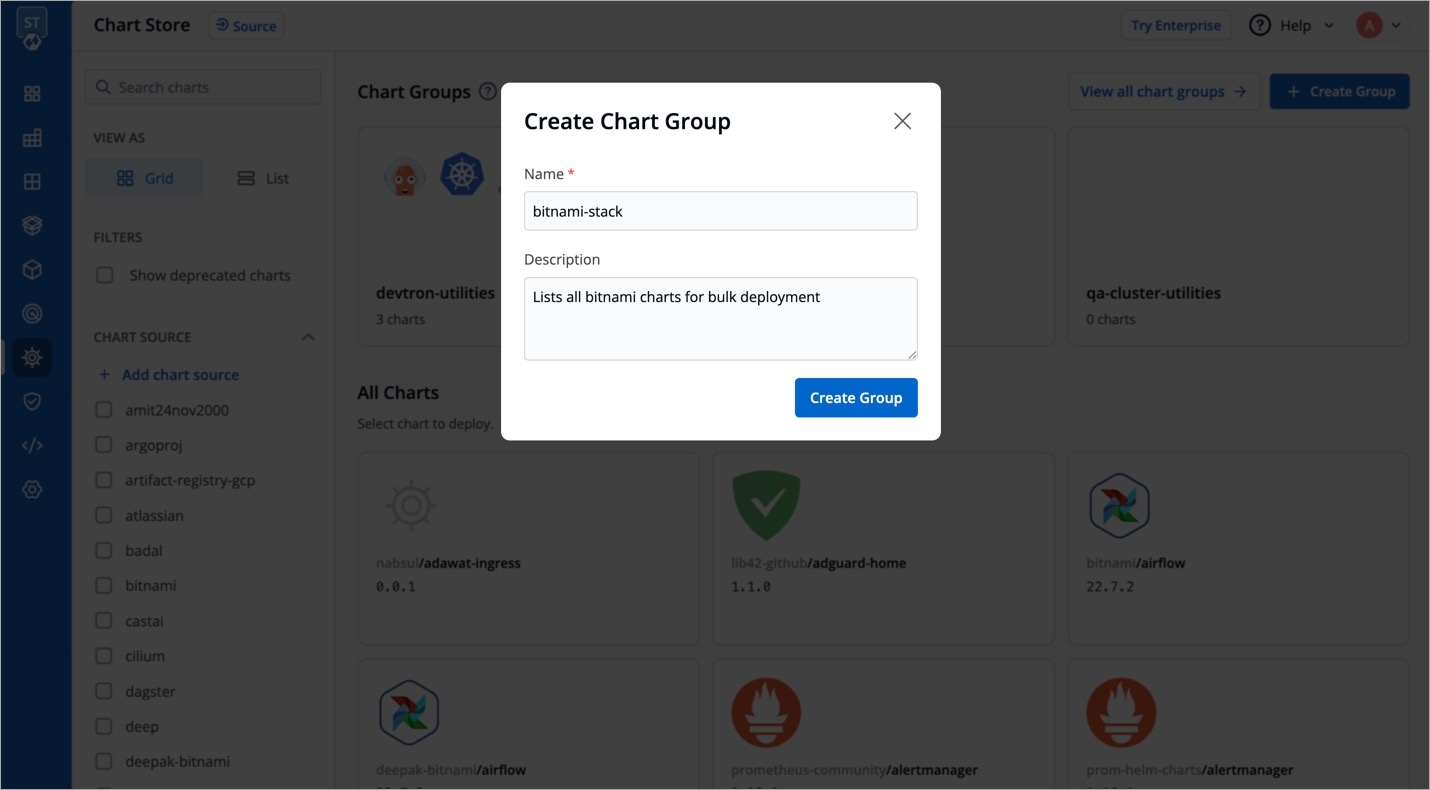
In the Create Chart Group screen, enter name and description(optional) for the chart group, and then select Create Group.
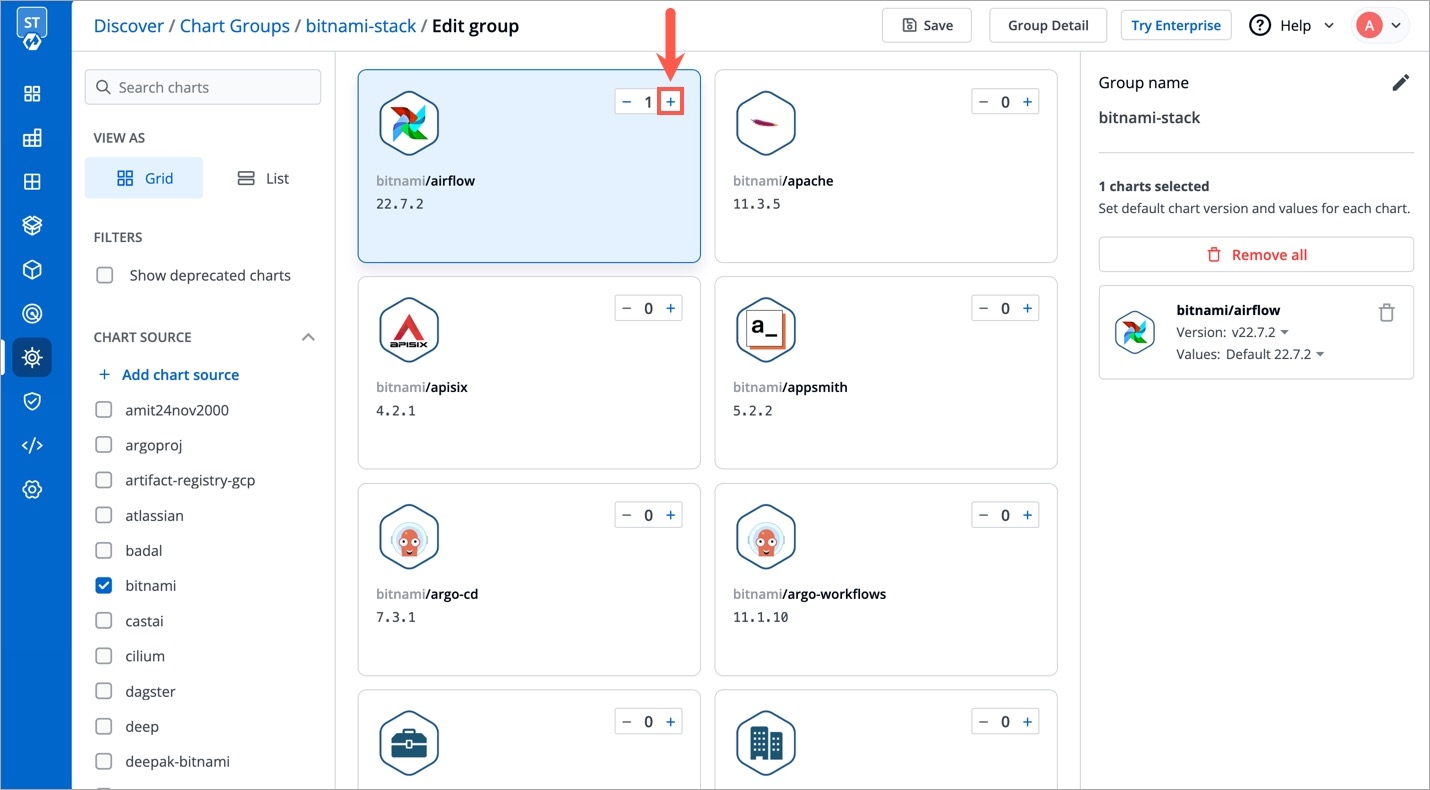
Once you create the group, you can now select and add the charts to this chart group.
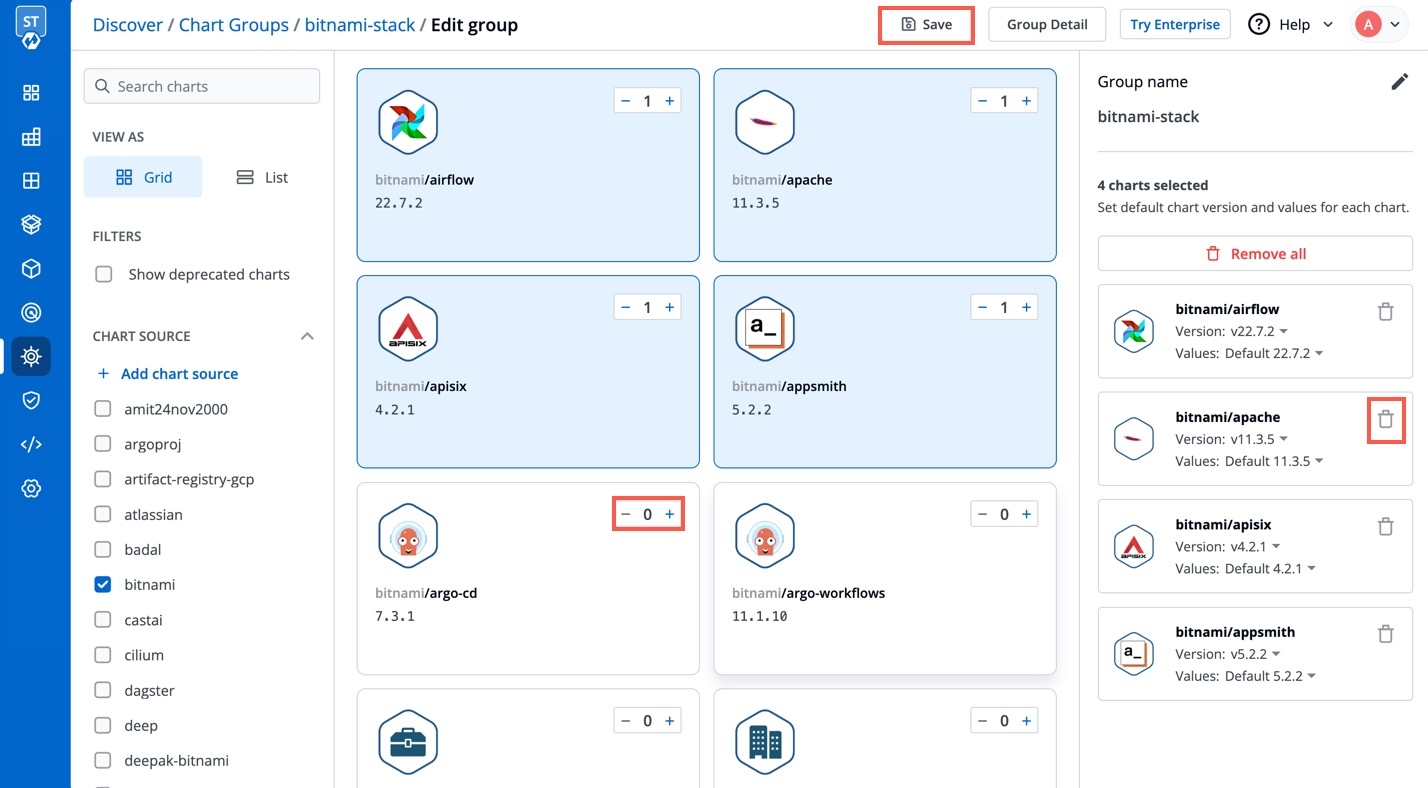
To add a chart to the group, click the + sign at the top-right corner of a chart, and then select Save.
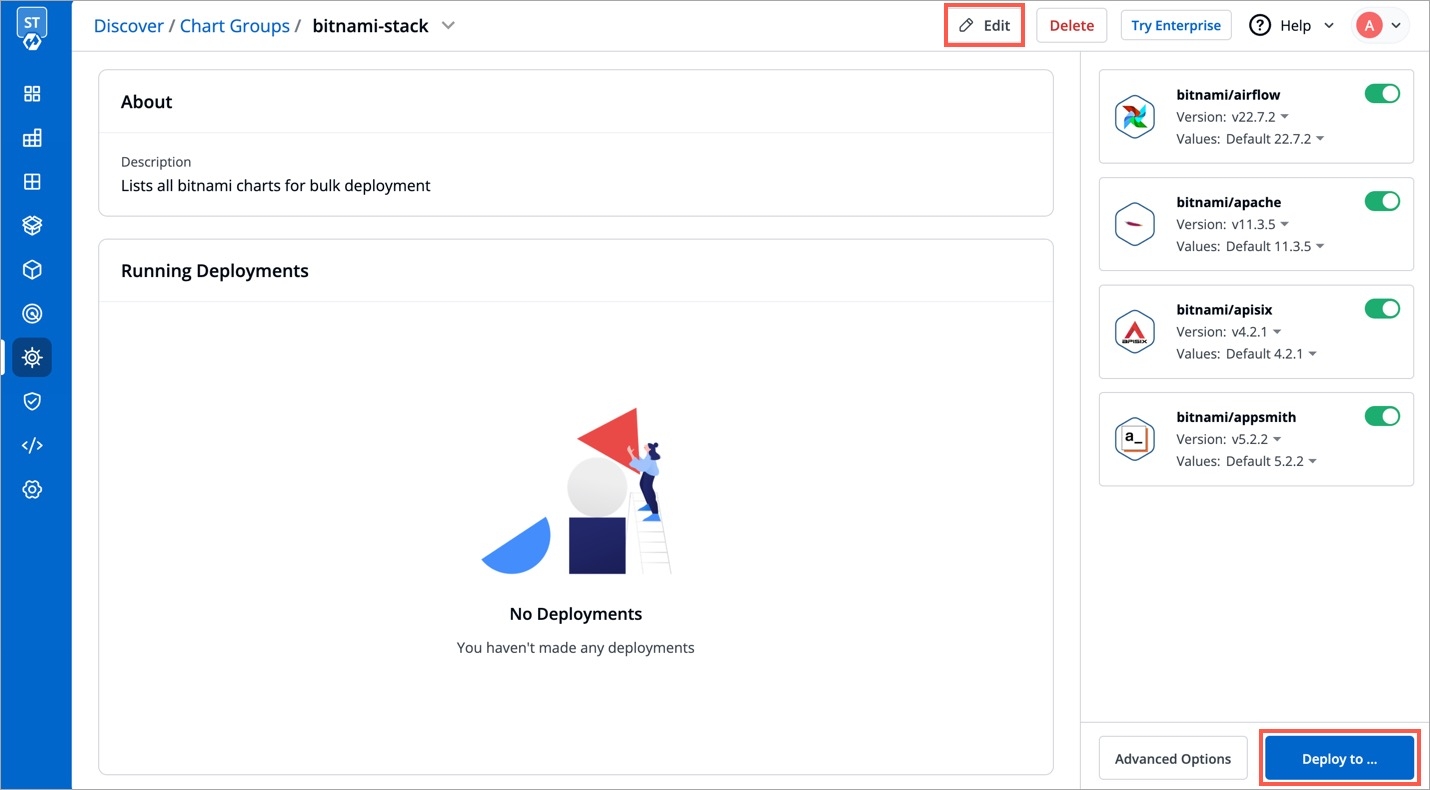
Click on Group Detail to see all the running instances and group details. You can also edit the chart group from here.
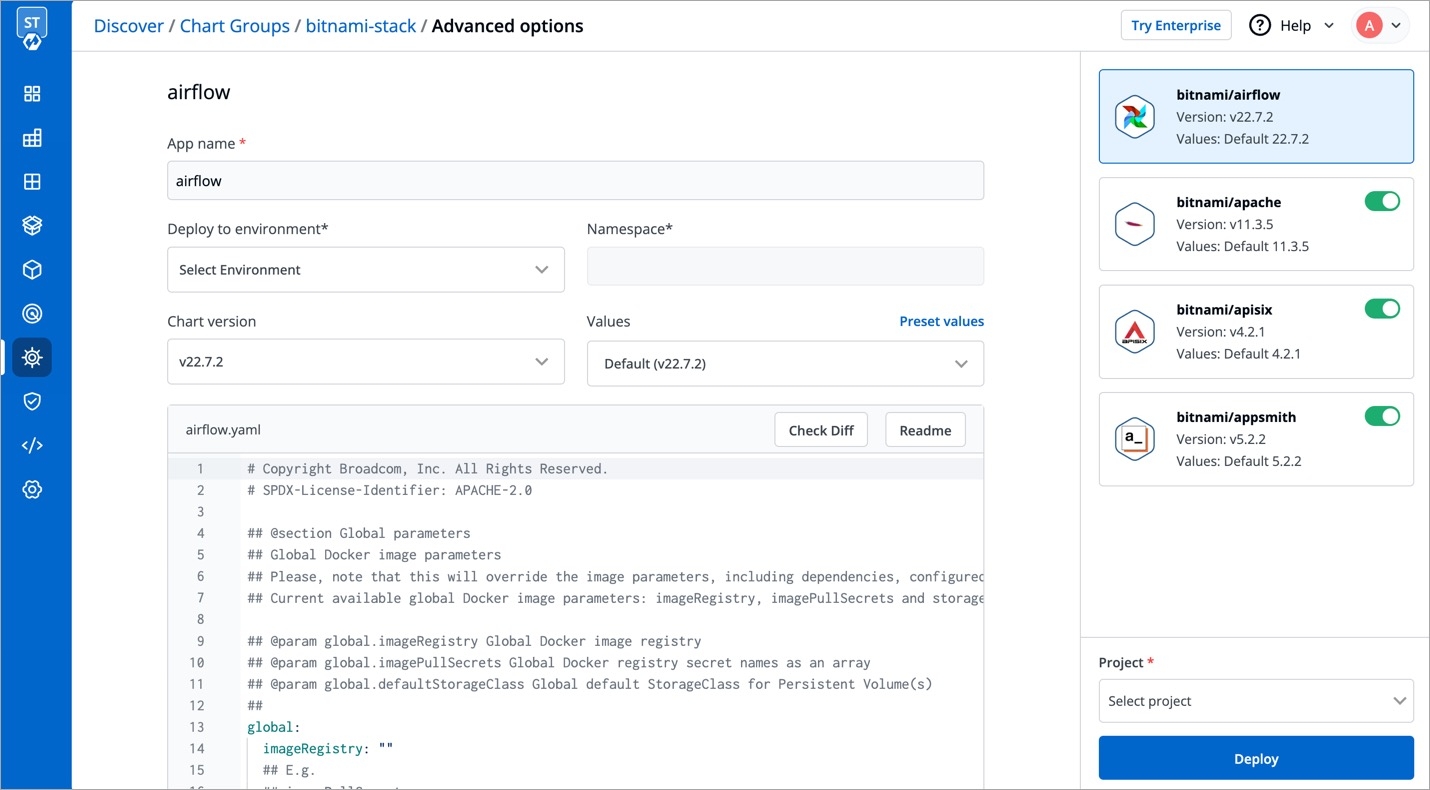
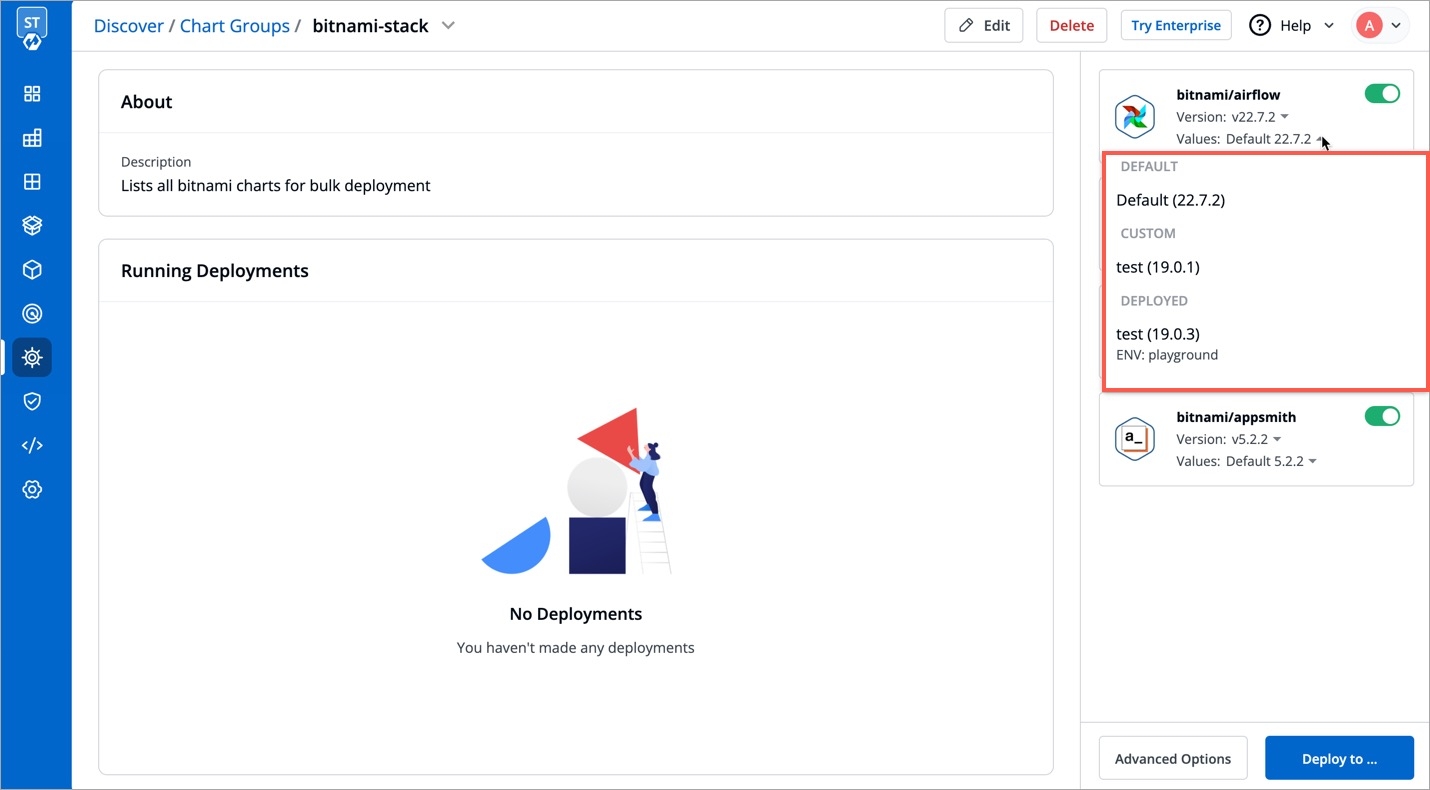
You can see all the charts in the chart group in the right panel.
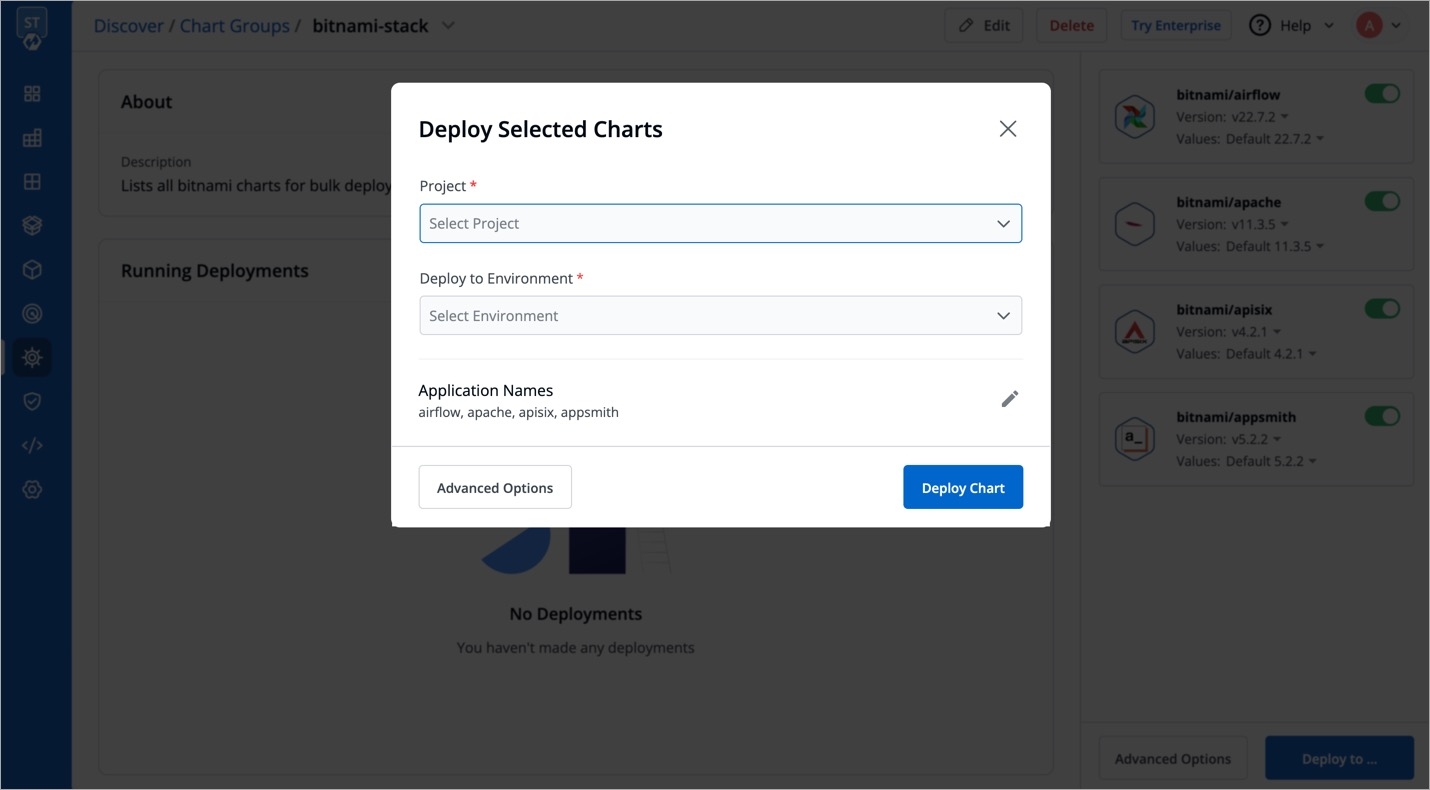
Select Deploy to...
In the Deploy Selected Charts, select the Project and Deploy to Environment values where you want to deploy the chart group.
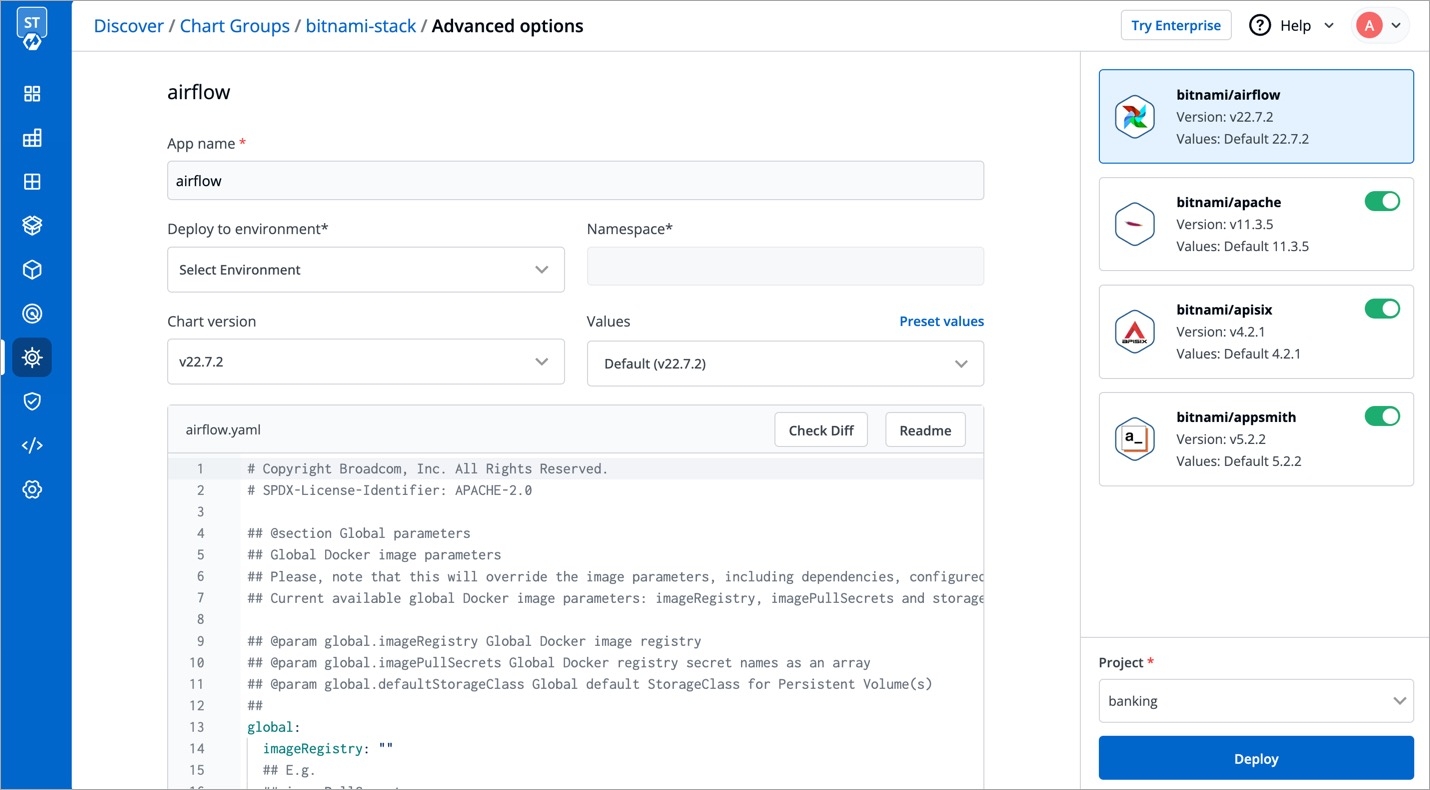
Select Advanced Options for more deploy options, such as editing the values.yaml or changing the Environment and Project for each chart.
| Key | Description |
|---|---|
App Name
Name of the Chart
Project
Select the name of your Project in which you want to deploy the chart
Environment
Select the environment in which you want to deploy the chart
Chart Version
Select the latest Chart Version
Chart Value
Select the latest default value or create a custom value
This Documentation guides you to Deploy different Helm Charts available on Devtron.
Parts of Documentation
stable/mysql Helm chart bootstraps a single node MySQL deployment on a Kubernetes cluster using the Helm package manager.
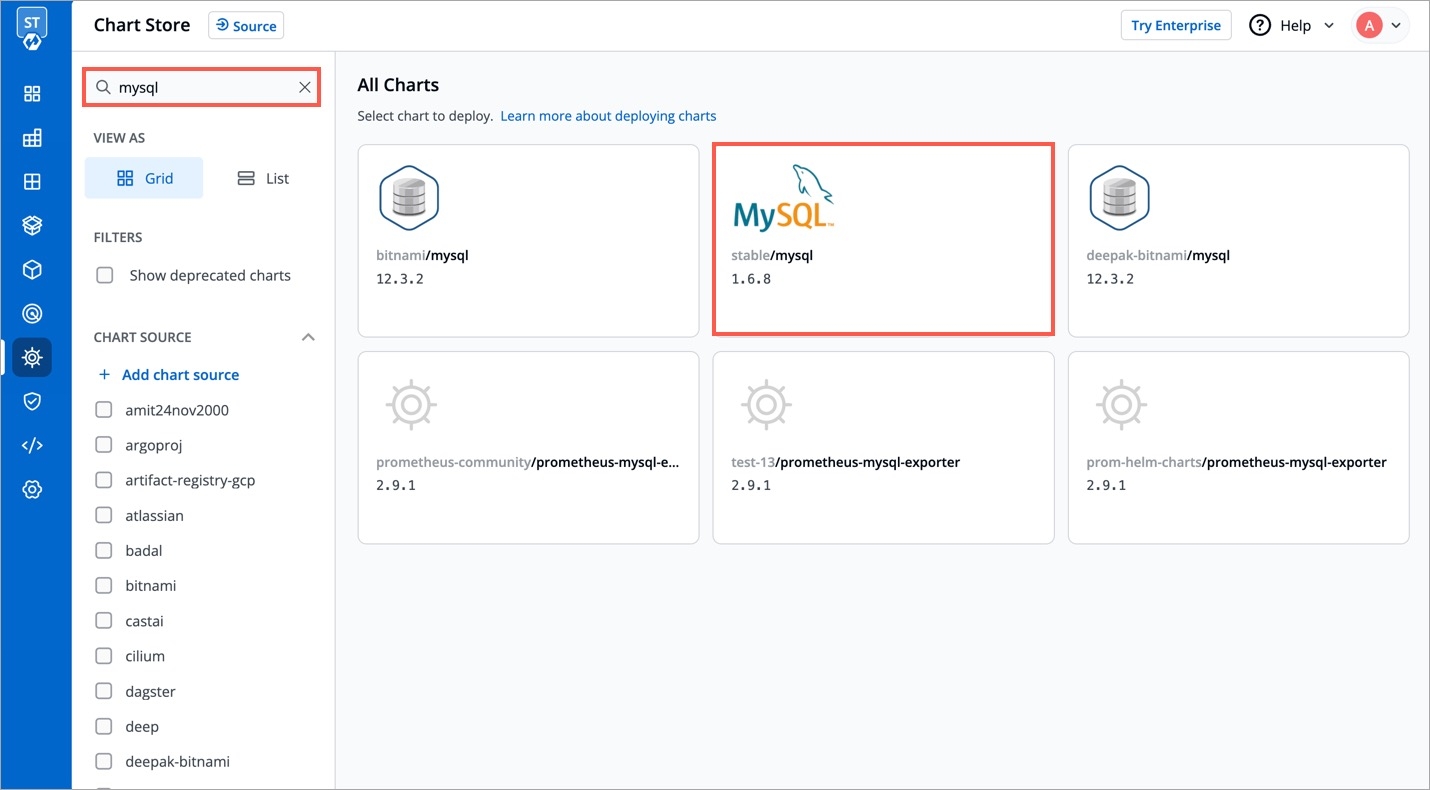
Select Charts from the left panel to visit the Chart Store page. You will see numerous of charts on the page from which you have to find stable/mysql chart. You also can use the search bar to search the MySQL chart.
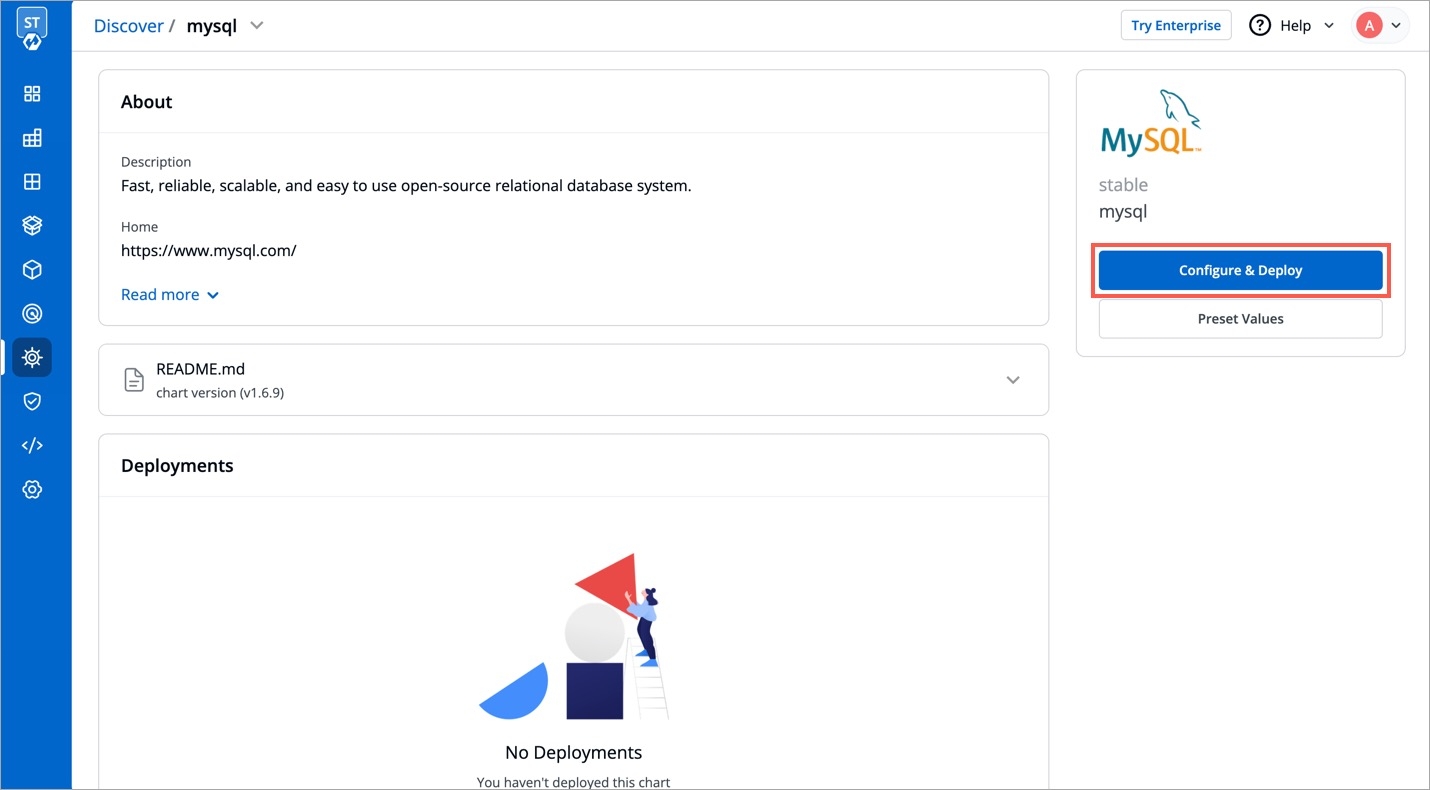
After selecting the stable/mysql Helm chart, click on Deploy.
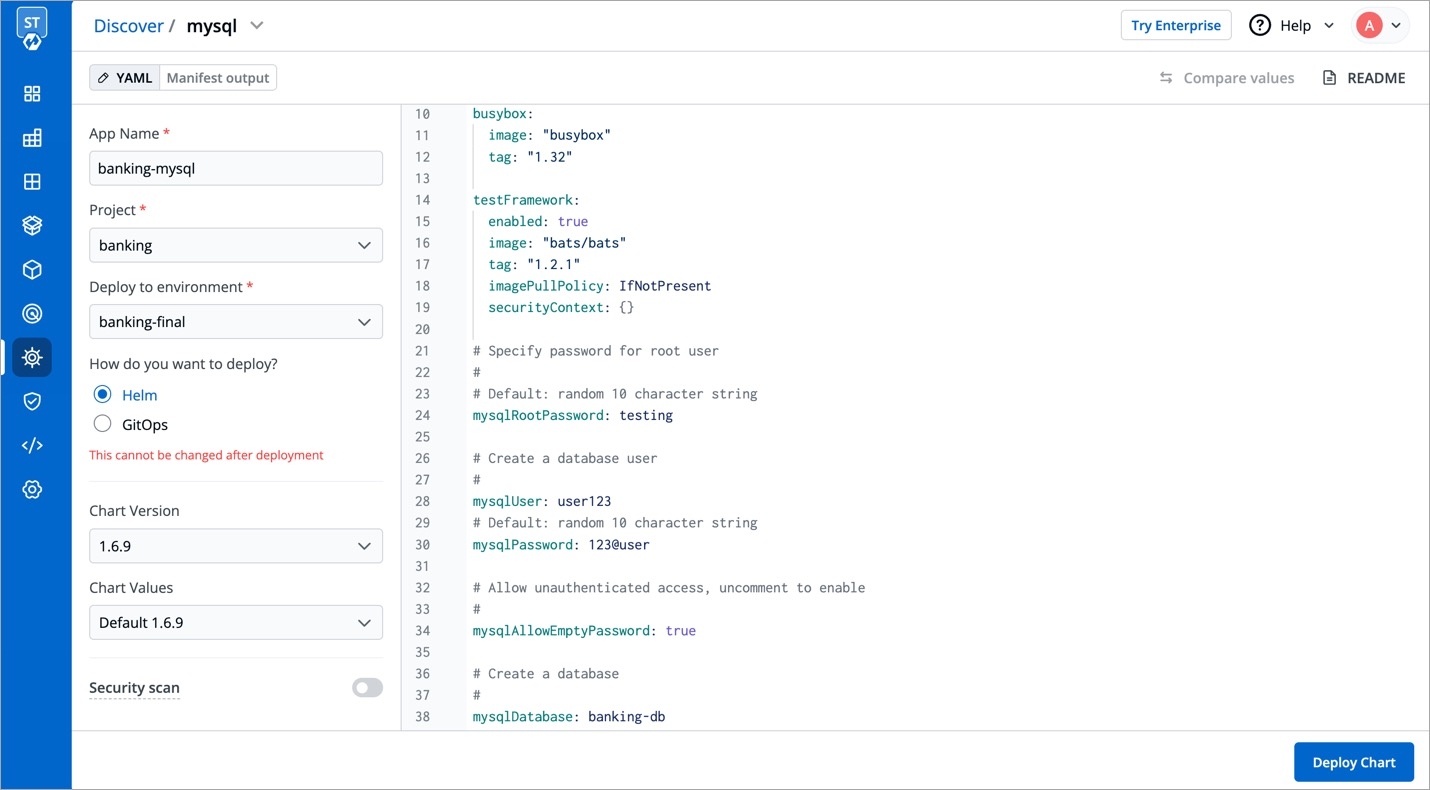
Enter the following details, to deploy MySQL chart:
values.yamlSet the following parameters in the chart, to be later used to connect MySQL with your Django Application.
Click on Deploy Chart to deploy the Chart.
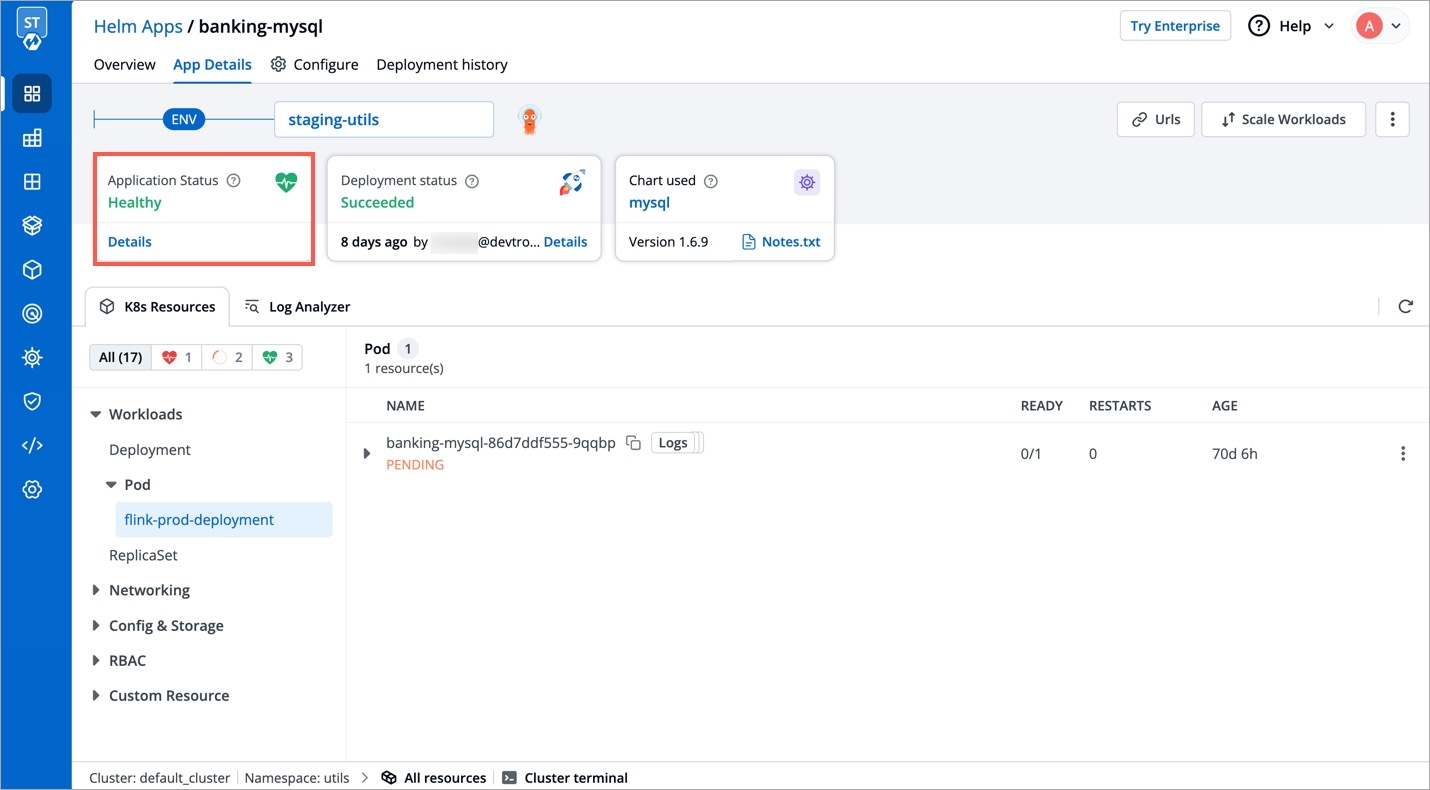
After clicking on Deploy you will be redirected to app details page where you can see deployment status of the chart. The Status of the chart should be Healthy. It might take few seconds after initiating the deployment of the chart.
In case the Status, of the deployment is Degraded or takes a long time to get deployed. Click on the Status or check the logs of the pods to debug the issue.
Copy the service name, it will be used to connect your application to MySQL.
Discover, Create, Deploy, Update, Upgrade, Delete charts.
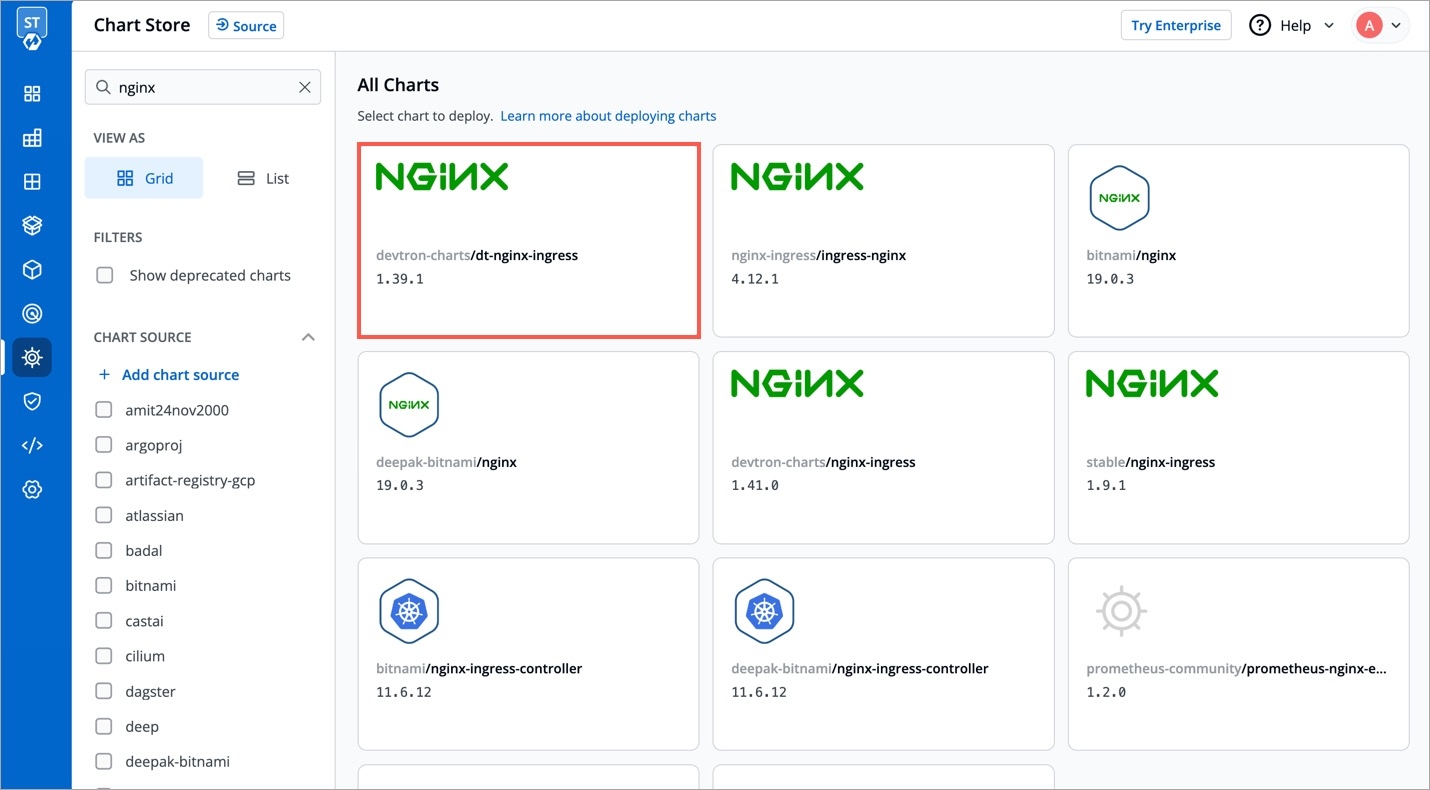
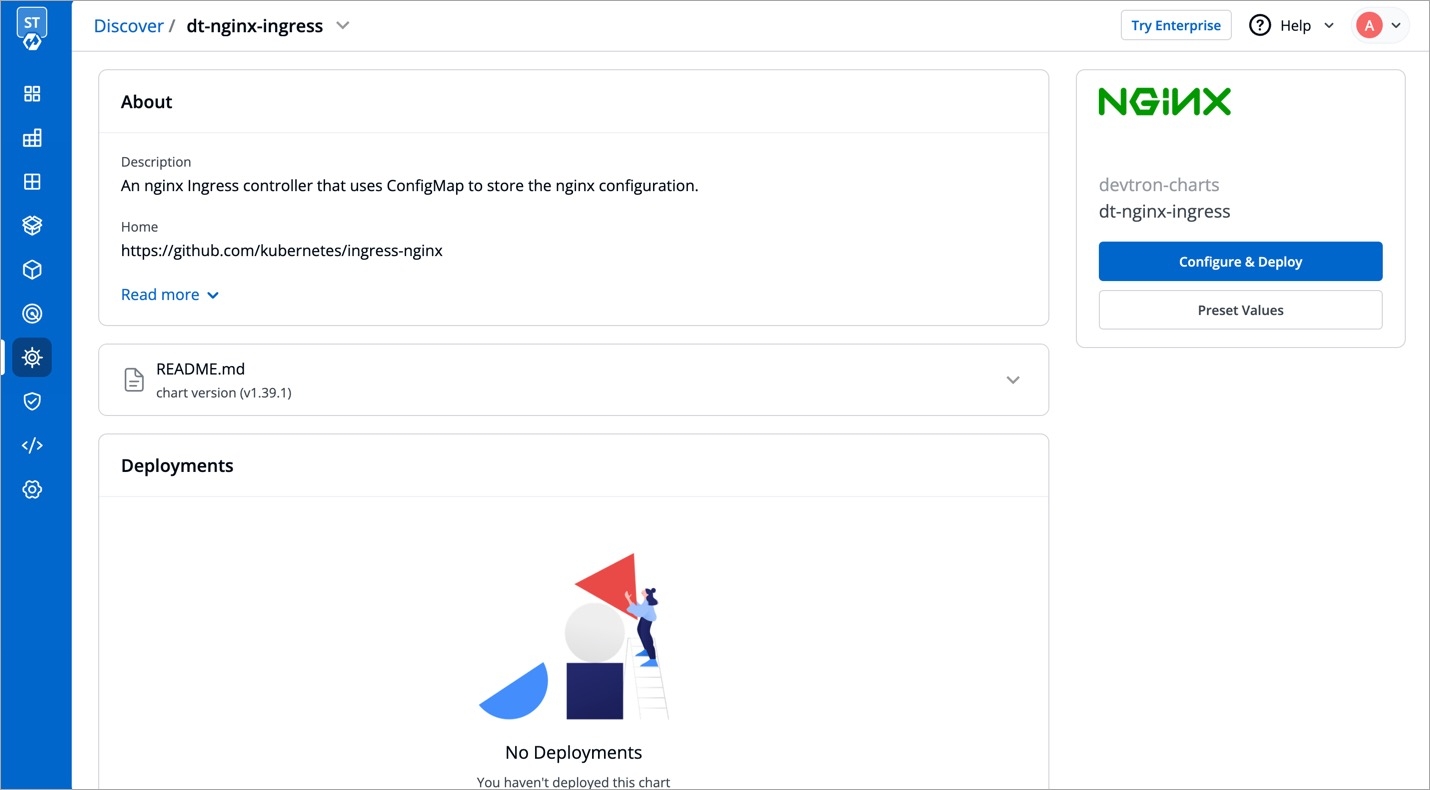
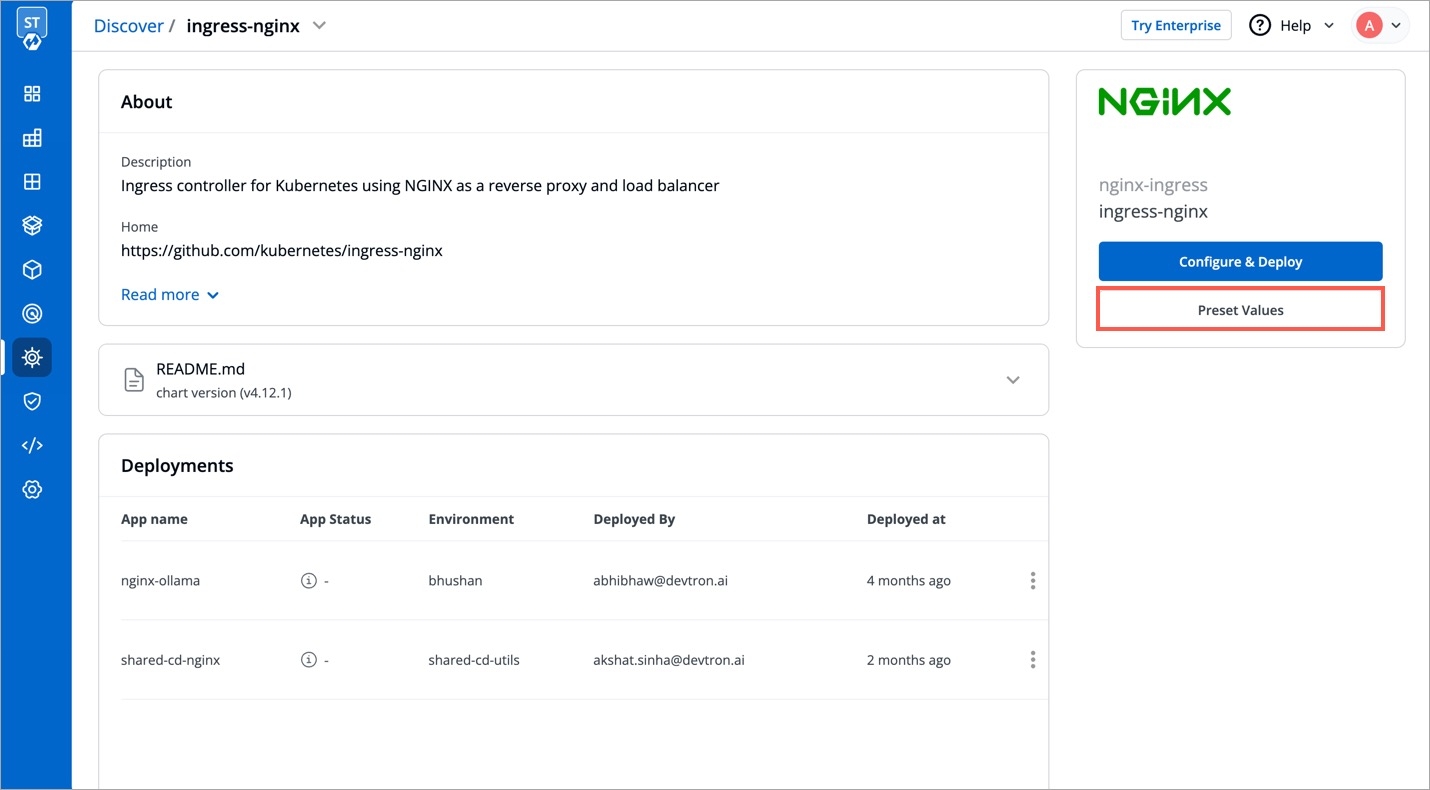
Select the Charts section from the left pane, you will be landed to the Chart Store page. Search nginx or any other charts in search filter.
Click on chart and it will redirect you to Chart Details page where you can see a number of instances deployed by using the same chart.
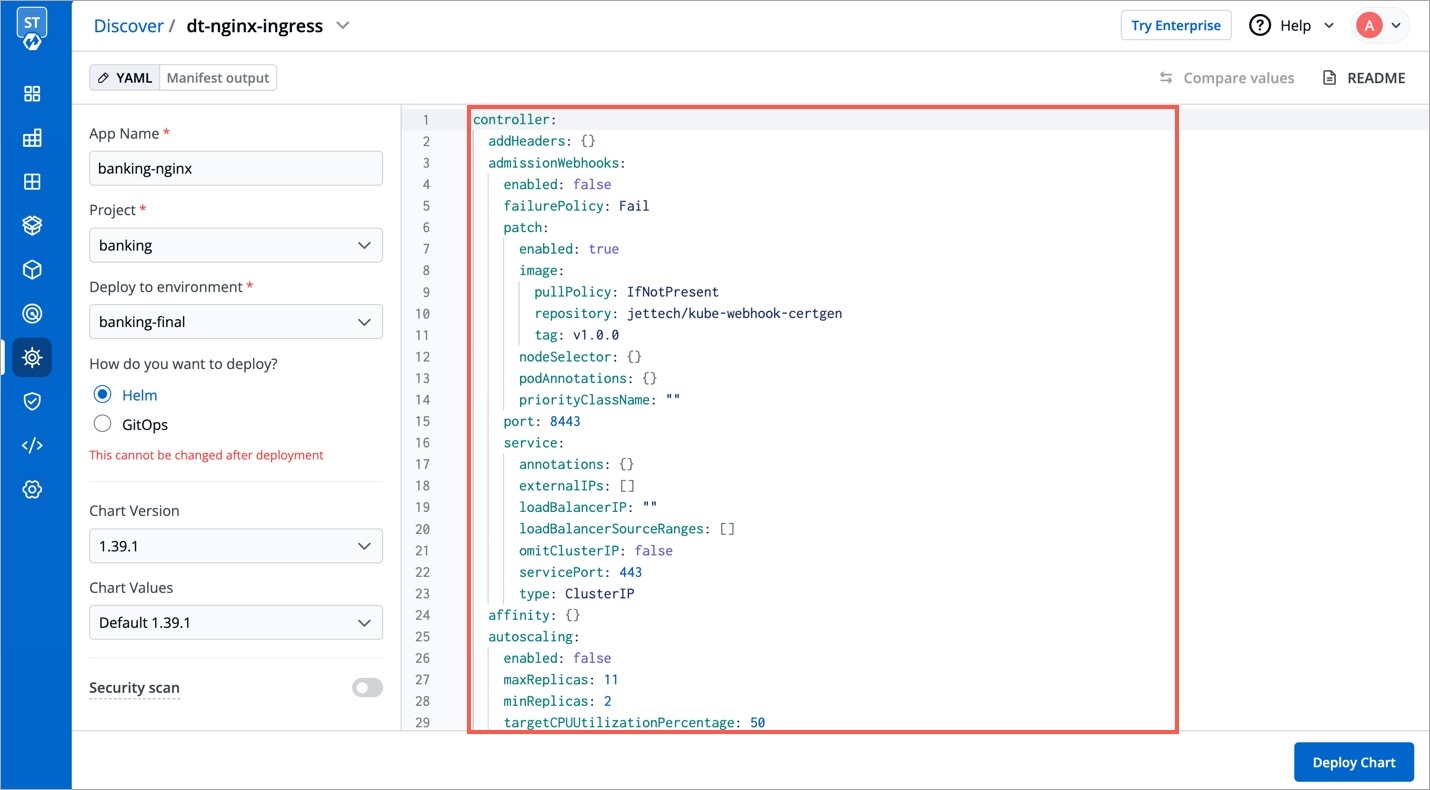
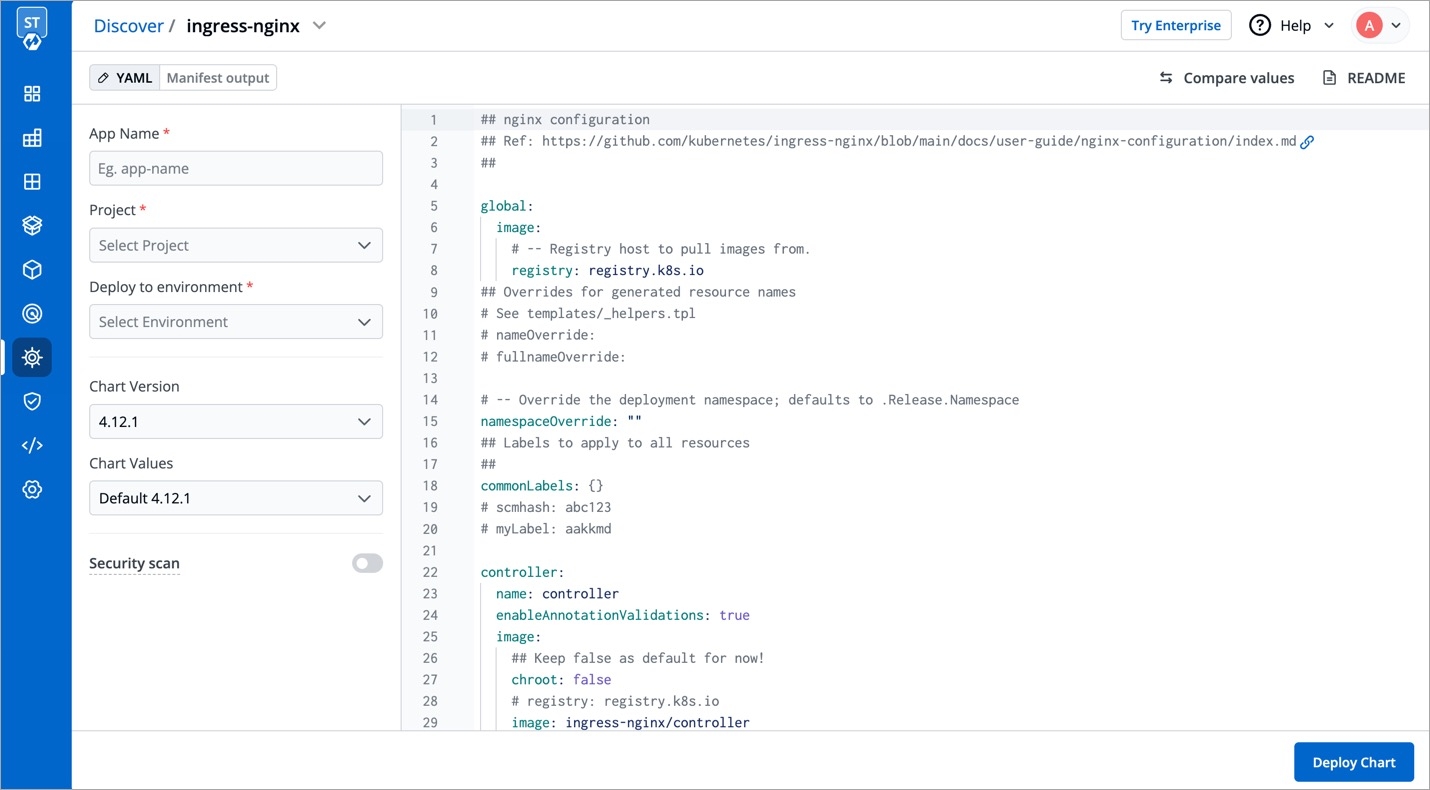
After selecting the version and values, click on Deploy
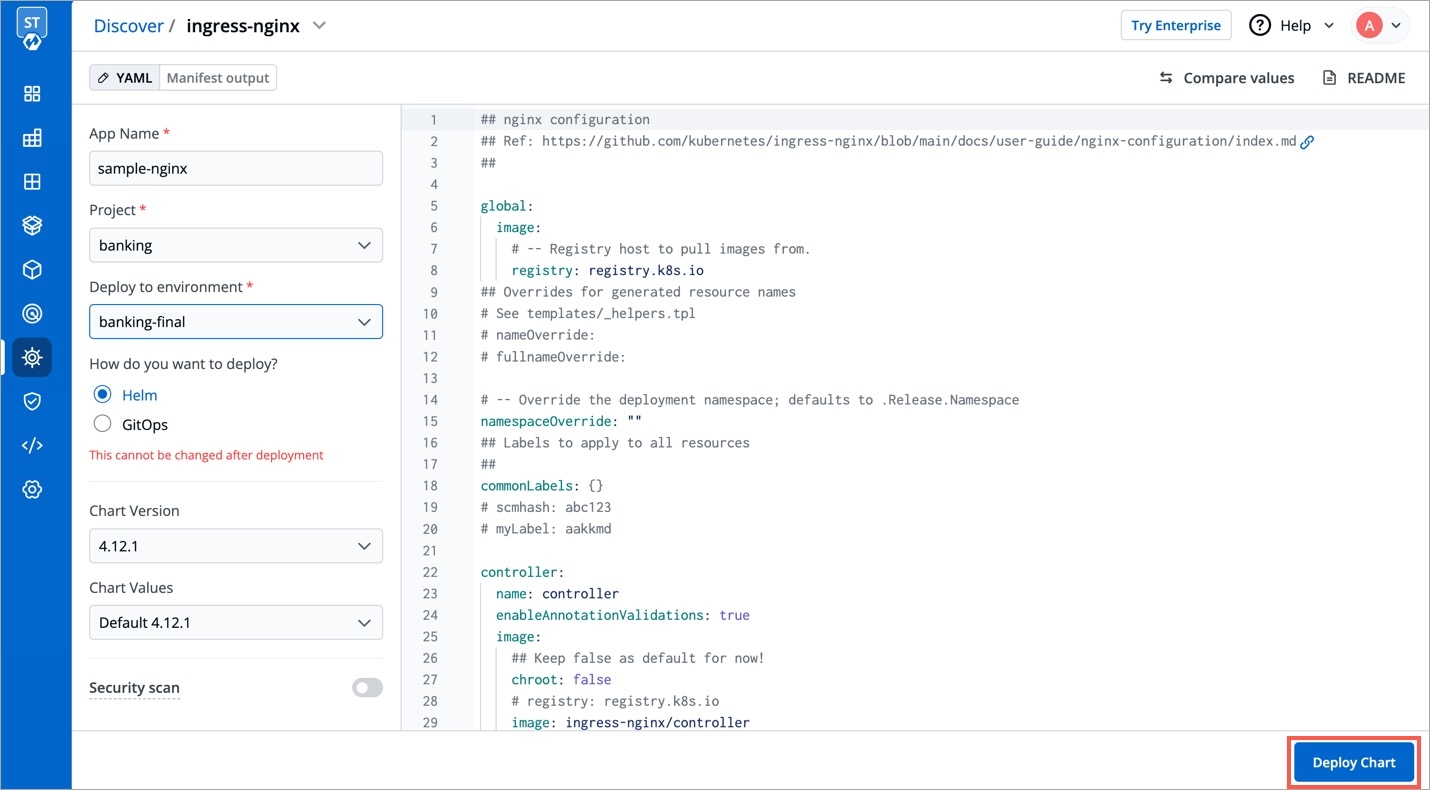
Enter the following details, to deploy chart:
you can choose any chart version, values and update it on values.yaml
Click on Deploy to deploy the Chart
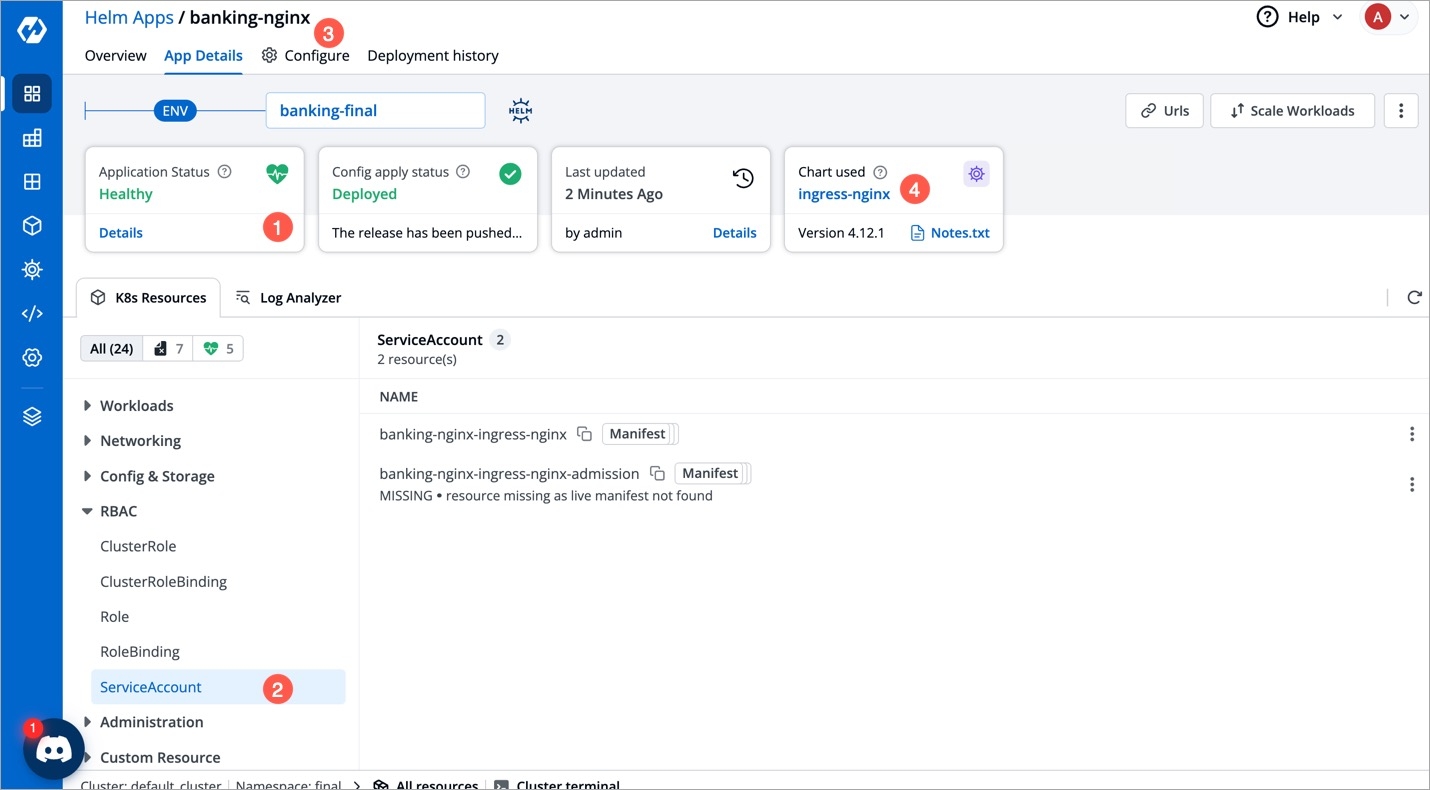
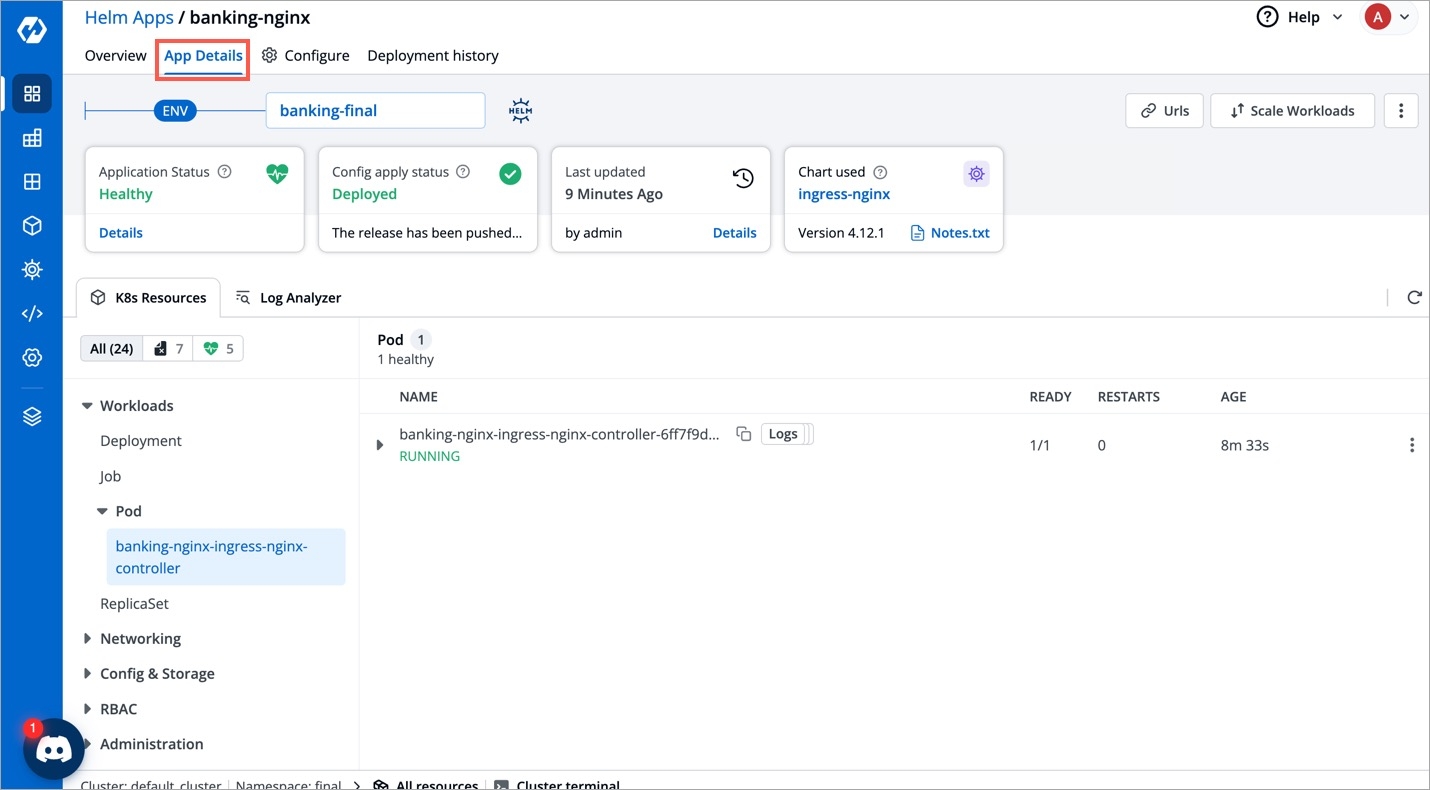
After clicking on Deploy you will land on a page that shows the status of the deployment of the Chart.
The status of the chart should be Healthy. It might take a few seconds after initiating the deployment of the chart. In case the status of the deployment is Degraded or takes a long time to get deployed, click on Details in Application Status section on the same page or check the logs of the pods to debug the issue.
Shows status of deployed chart.
Shows the controller service accounts being used.
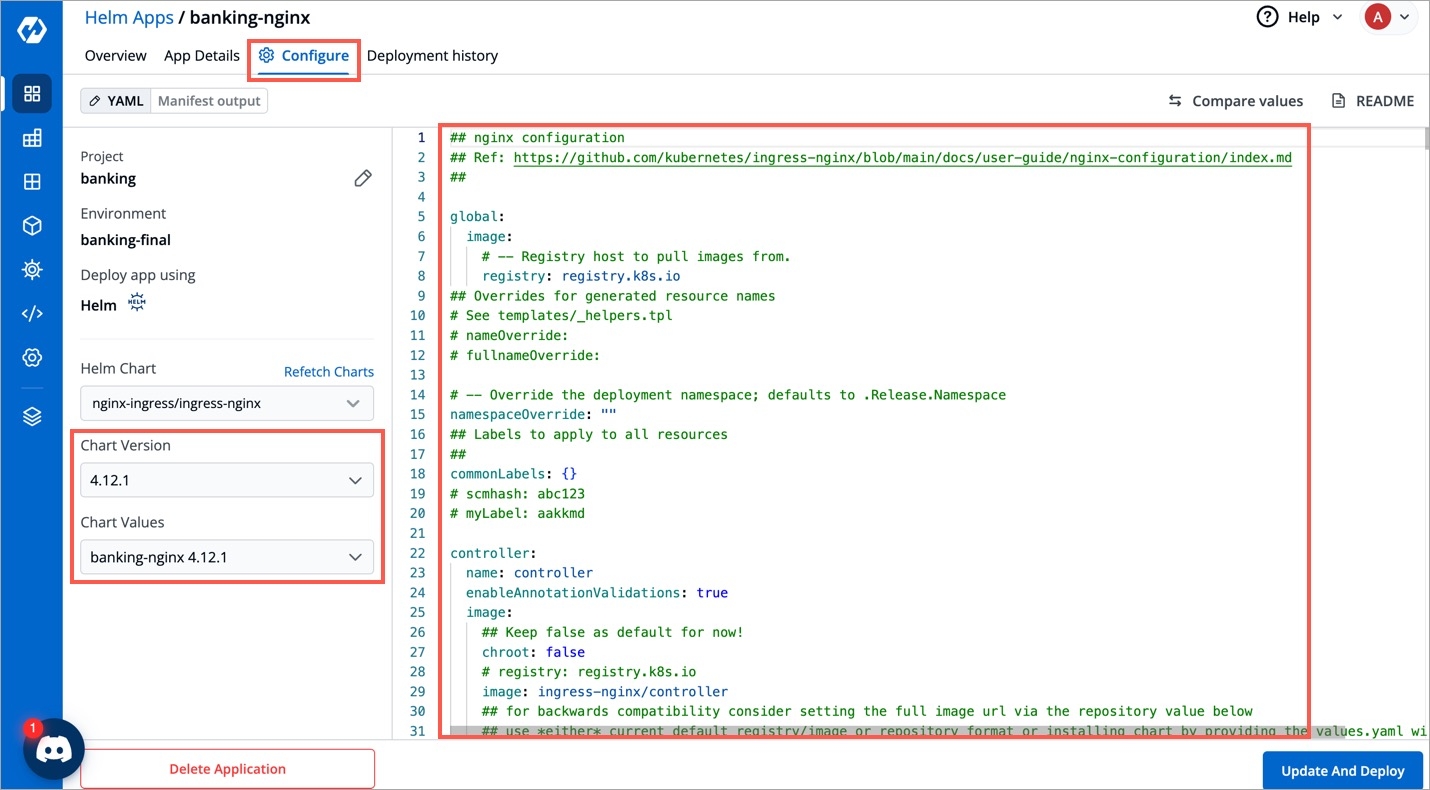
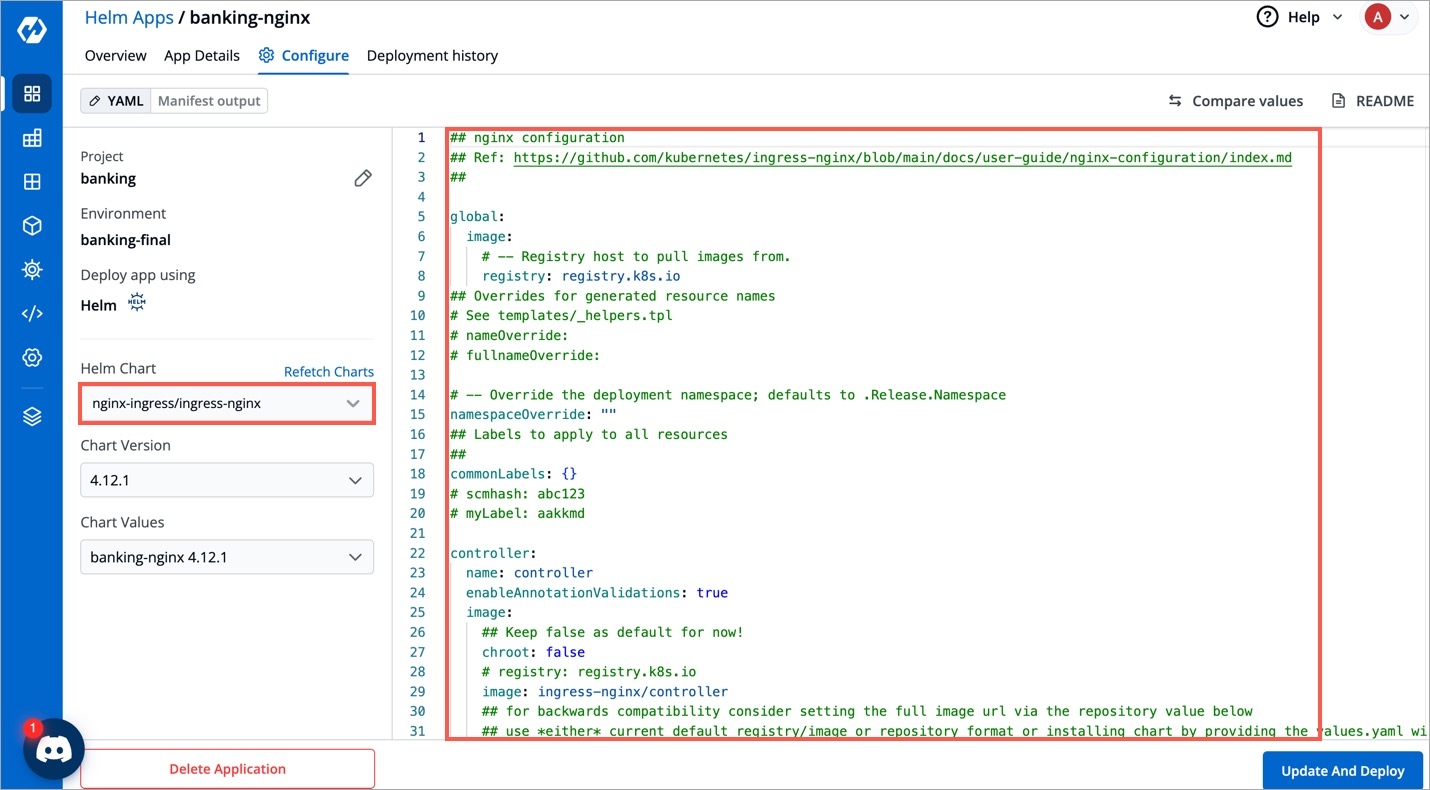
Clicking on values will land you on the page where you can update, upgrade or delete chart.
Clicking on View Chart will land you to the page where you can see all the running instances of this chart.
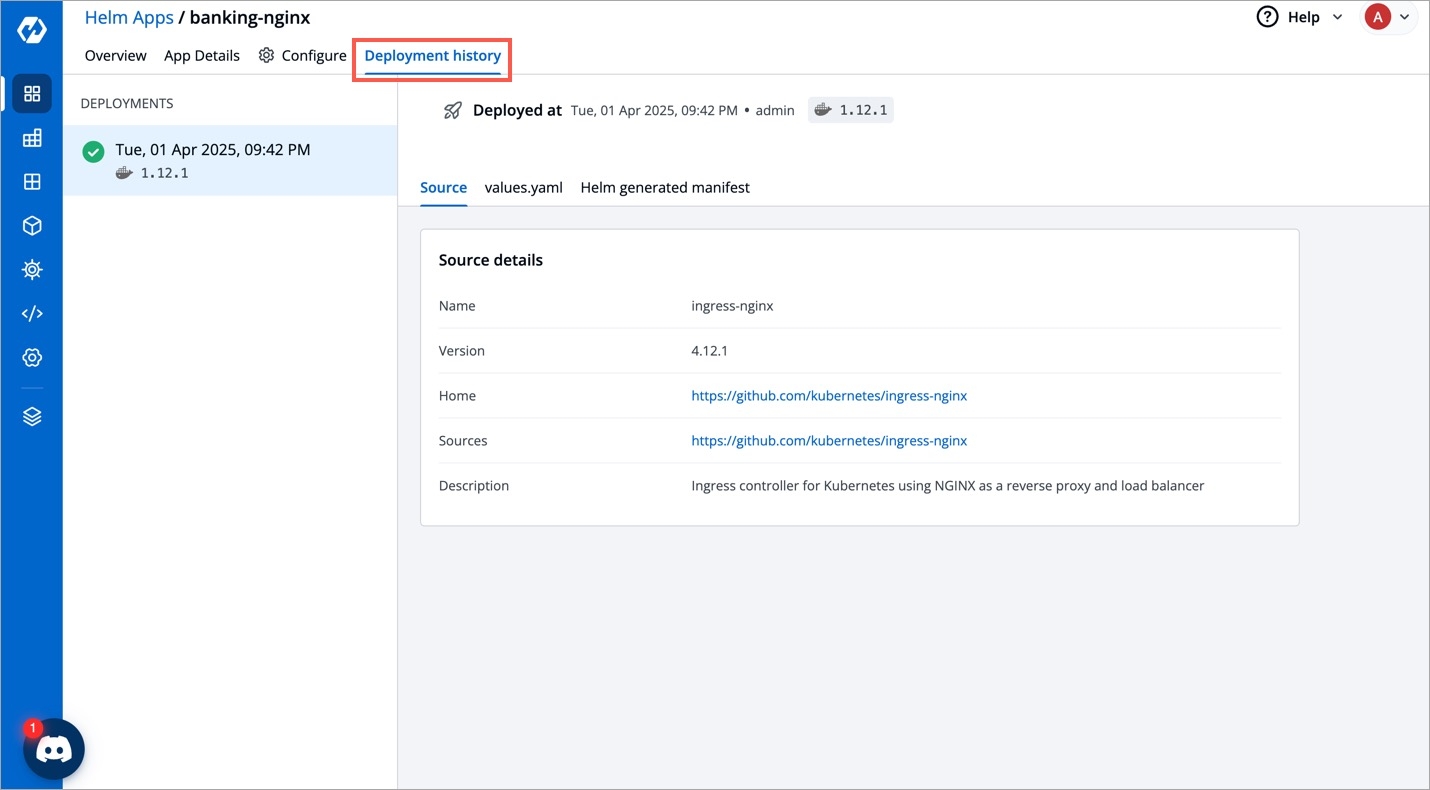
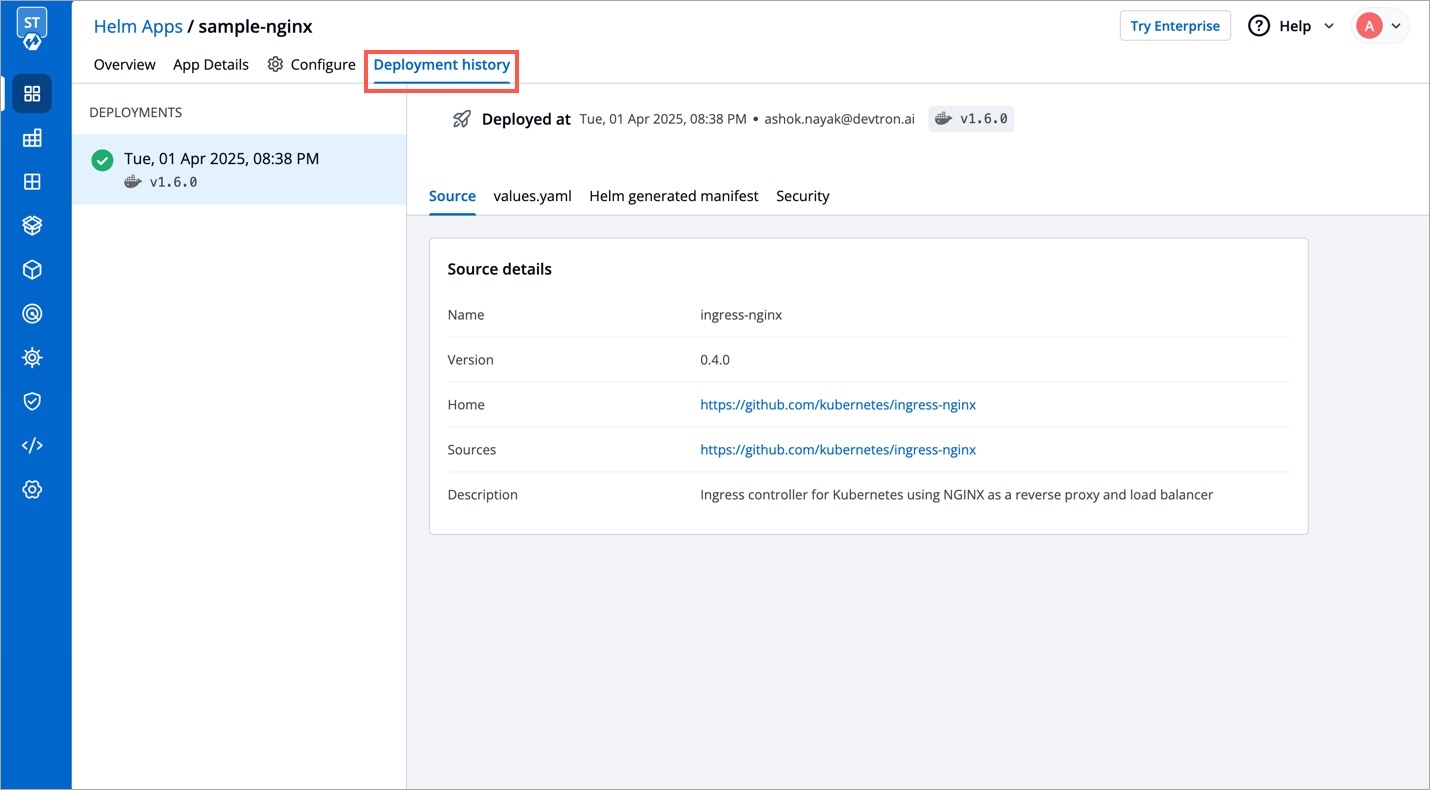
To see deployment history of Helm application, click on Deployment history from App details page.
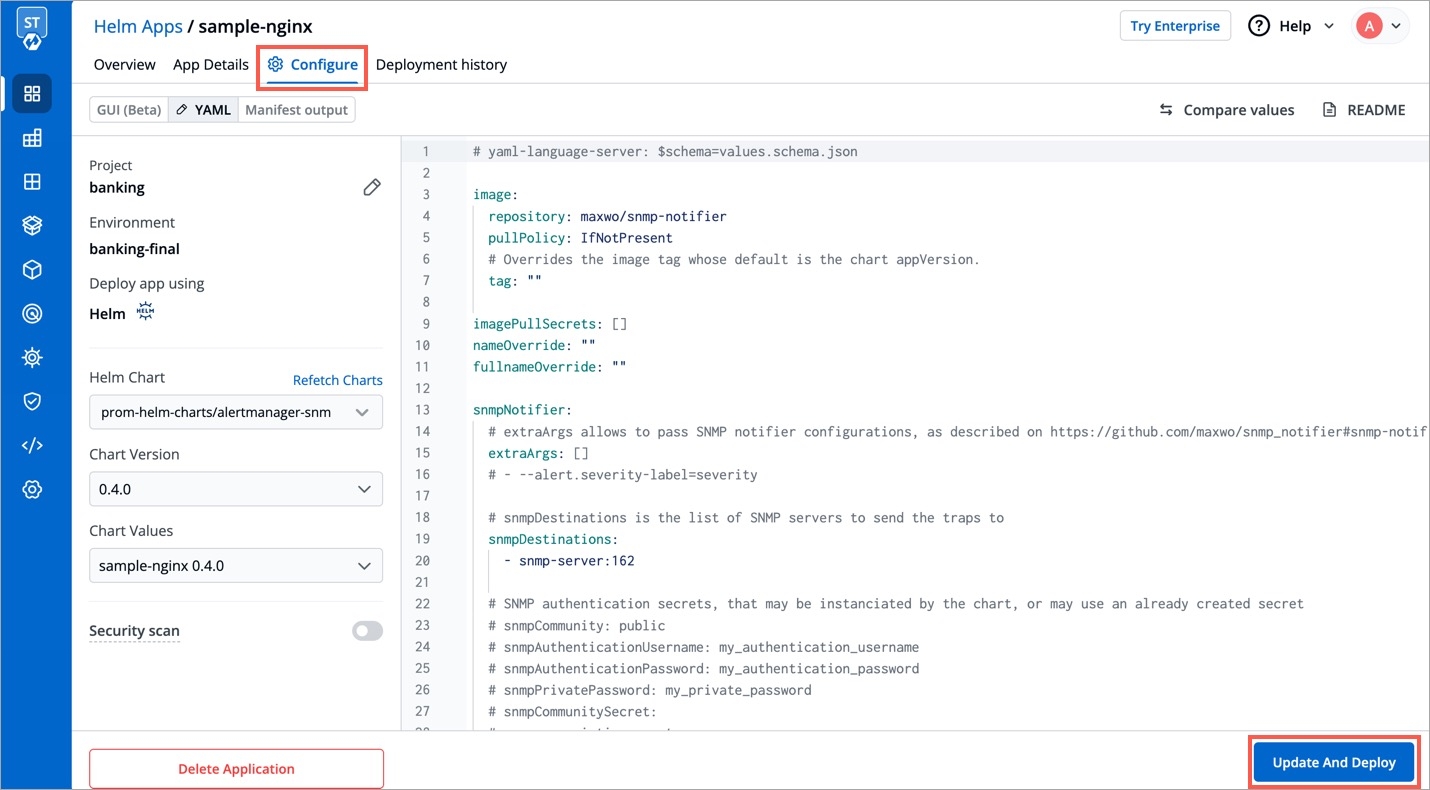
For update you can change its chart version or values.yaml and then click on Update And Deploy.
For upgrade click on Repo/Chart field and search any chart name like nginx-ingress and change values corresponding to that chart and Click on Update And Deploy.
After an update or upgrade you again will land on App Detail page, where you can check pods and service name.
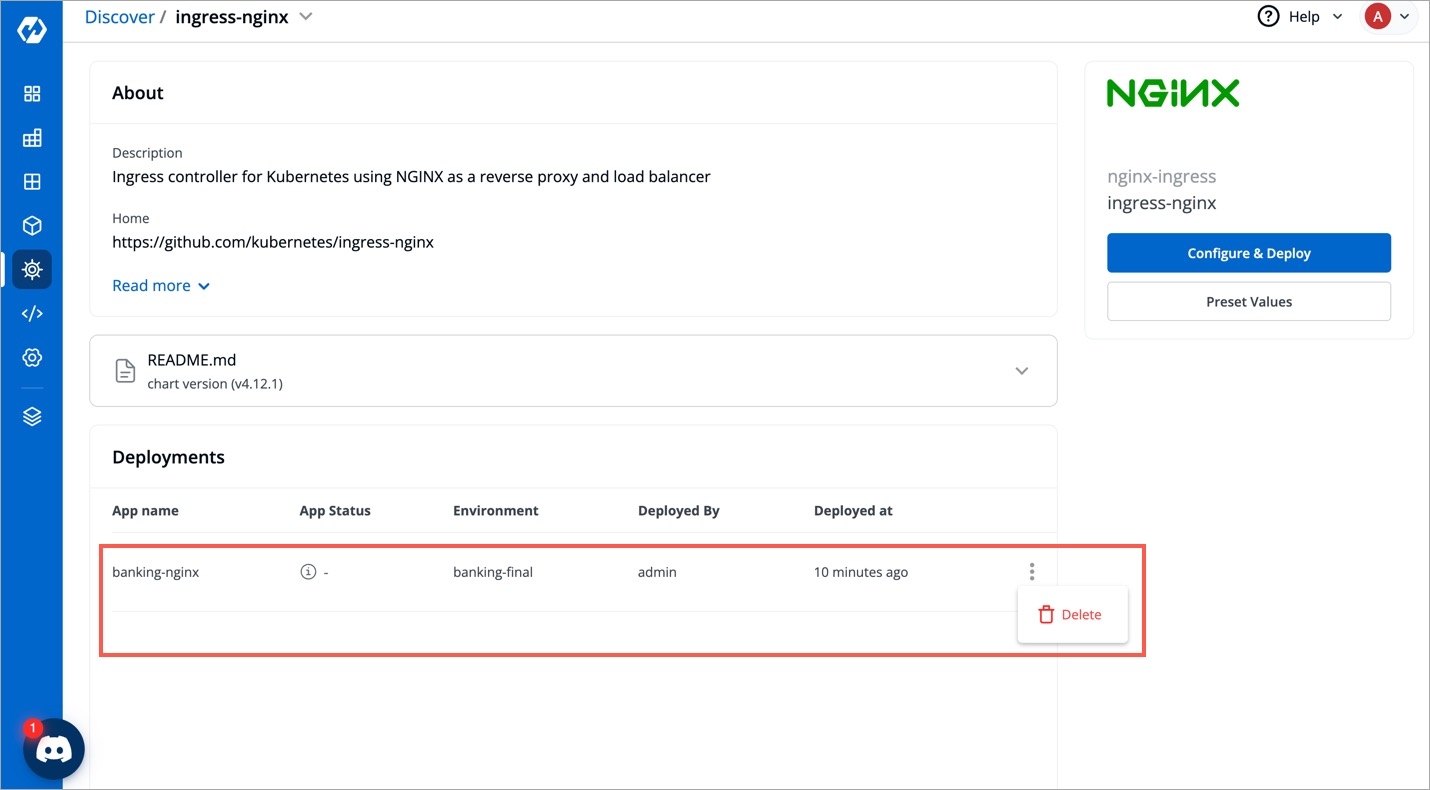
By clicking on View Chart in Chart Used section on App Details page, it will redirect you to Chart Details page where you can see number of instances installed by this chart and also you can delete the chart instance from here.
Welcome! This is the documentation for Deploying Charts.
Parts of Documentation
| Key | Description |
|---|---|
| Parameters | Description |
|---|---|
| Key | Description |
|---|---|
App Name
Name of the Chart
Project
Select the name of your Project in which you want to deploy the chart
Environment
Select the environment in which you want to deploy the chart
Chart Version
Select the latest Chart Version
Chart Value
Select the default value or create a custom value
mysqlRootPassword
Password for the root user. Ignored if existing secret is provided
mysqlDatabase
Name of your MySQL database
mysqluser
Username of new user to create
mysqlPassword
Password for the new user. Ignored if existing secret is provided
App Name
Name of the Chart Unique
Project
Project in which you want to deploy the chart
Environment
Environment in which you want to deploy the chart
Chart Version
Chart version
Chart Value
Latest default value or create a custom value


Charts can be deployed individually or by creating a group of Charts. Both methods are mentioned here.
To deploy any chart or chart group, visit the Charts section from the left panel and then select the chart that you want to use.
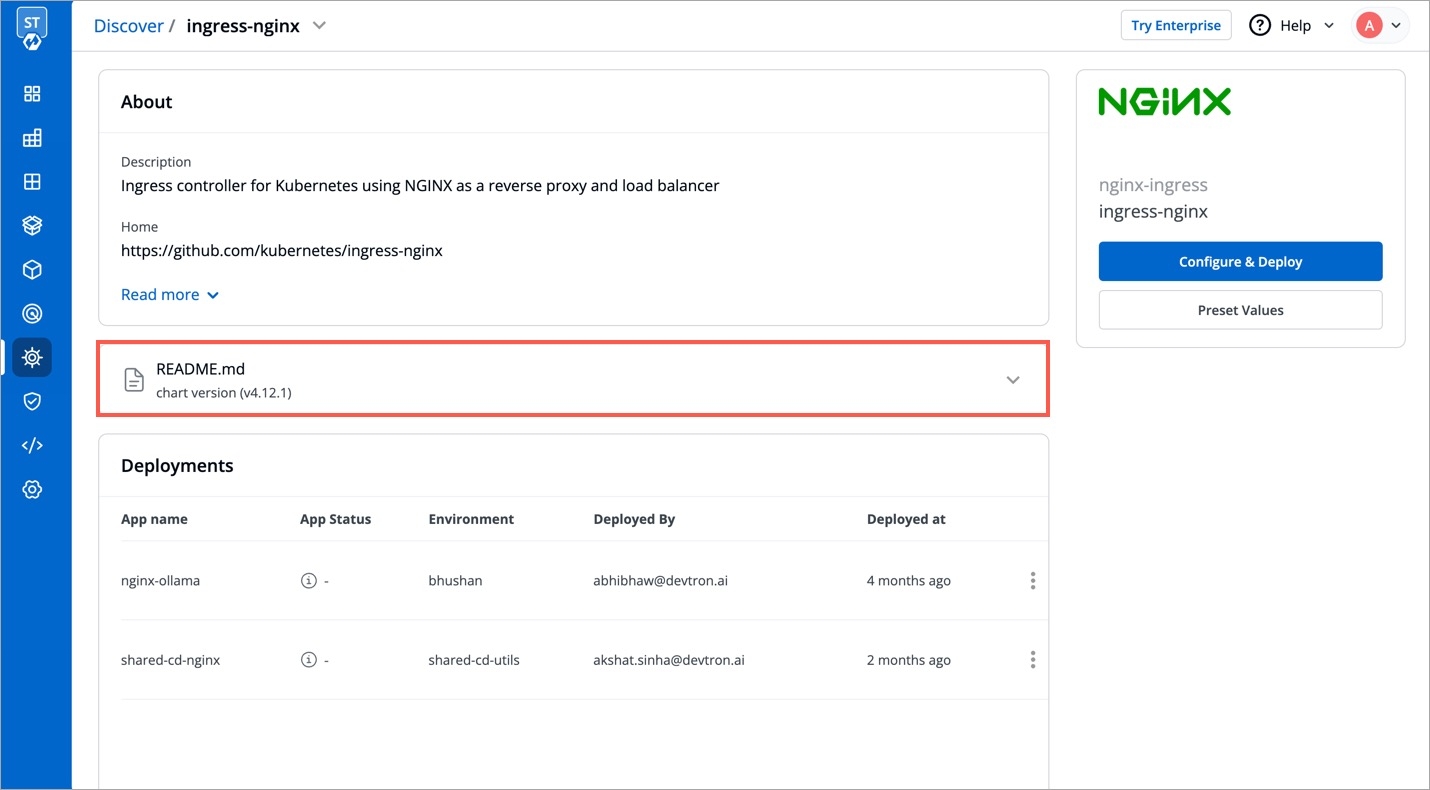
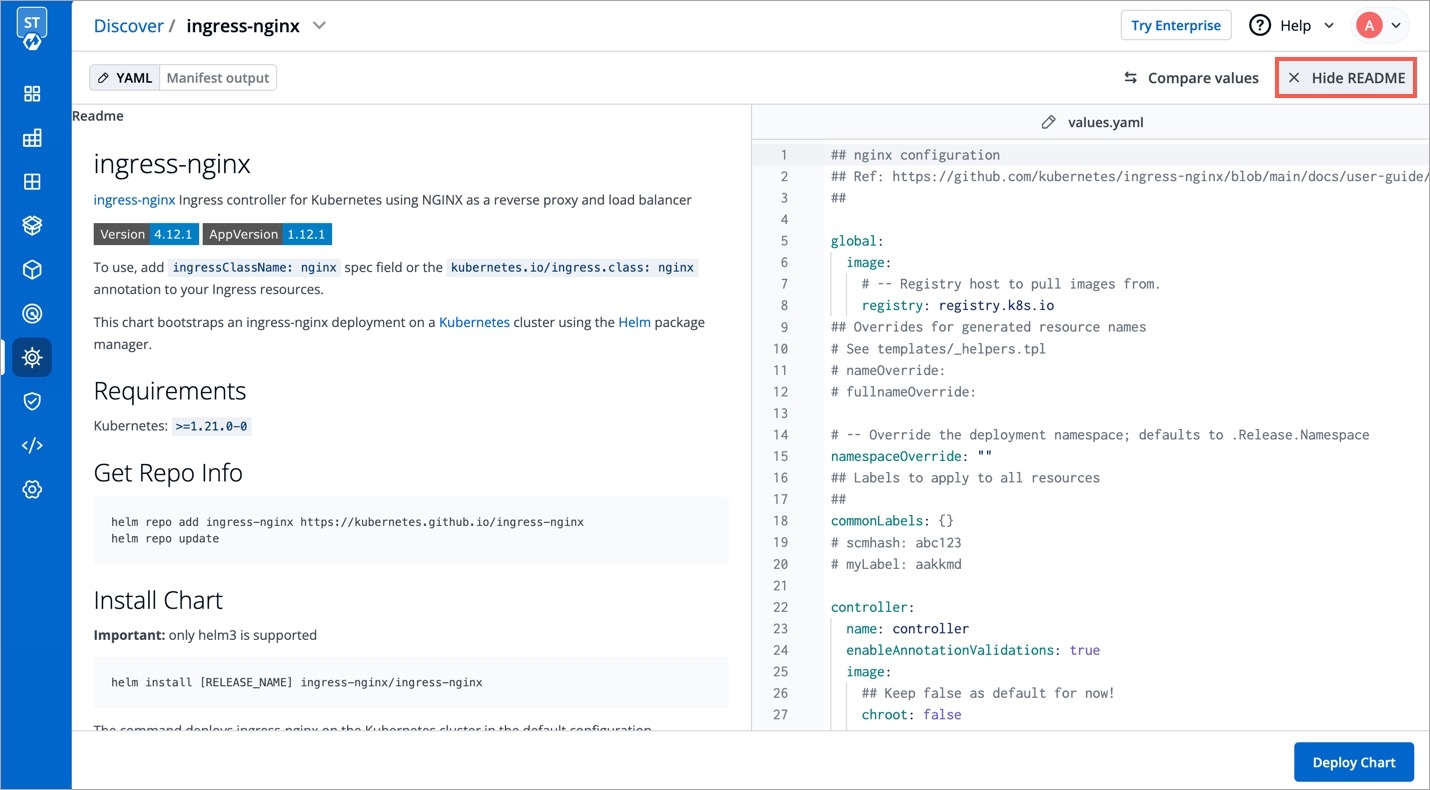
Click on README.md to get more ideas about the configurations of the chart.
Select the Chart Version that you want to use and Chart Value, you can either use the Default Values or Custom Values.
To know about Custom Values, Click On: Custom Values
The configuration values can be edited in the section given below Chart Version.
Readme.md present on the left can be used by the user to set configuration values.
Click on Deploy Chart to deploy the chart.
Click on App Details to see the status and details of the deployed chart and click on Values to reconfigure the deployment.
Configuration values can be edited over here by the help of Readme.md.
Click on Update And Deploy to update new settings. You can also see deployment history of Helm application and values.yaml corresponding to the deployment by clicking on Deployment history.
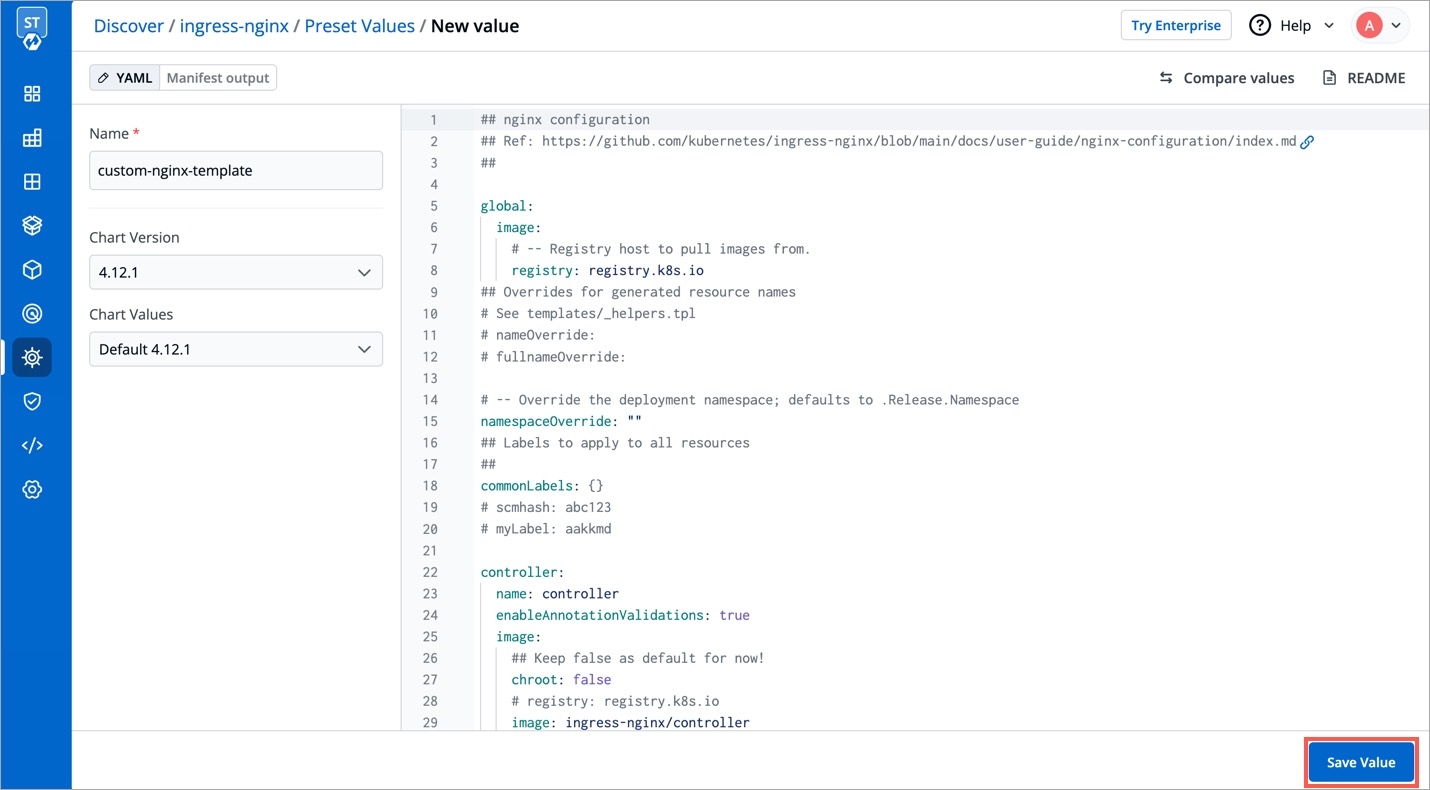
You can use the default values or create Custom value by clicking on Create Custom.
You can name your Custom Value, select the Chart Version and change the configurations in YAML file.
Click on Save Template to save the configurations.
You can deploy multiple applications and work with them simultaneously by creating Chart Group. To create chart group click on Create Group.
Add the Group Name and Description(optional), and select Create Group.
You can select the Charts that you want to add to your Chart Group by clicking on '+' sign. You also can add multiple copies of the same chart in the chart group according to your requirements.
Select the Version and Values for your charts. You can use Default Values or the Custom Values, just make sure the value that you select for the chart is compatible with the version of the chart that you are using.
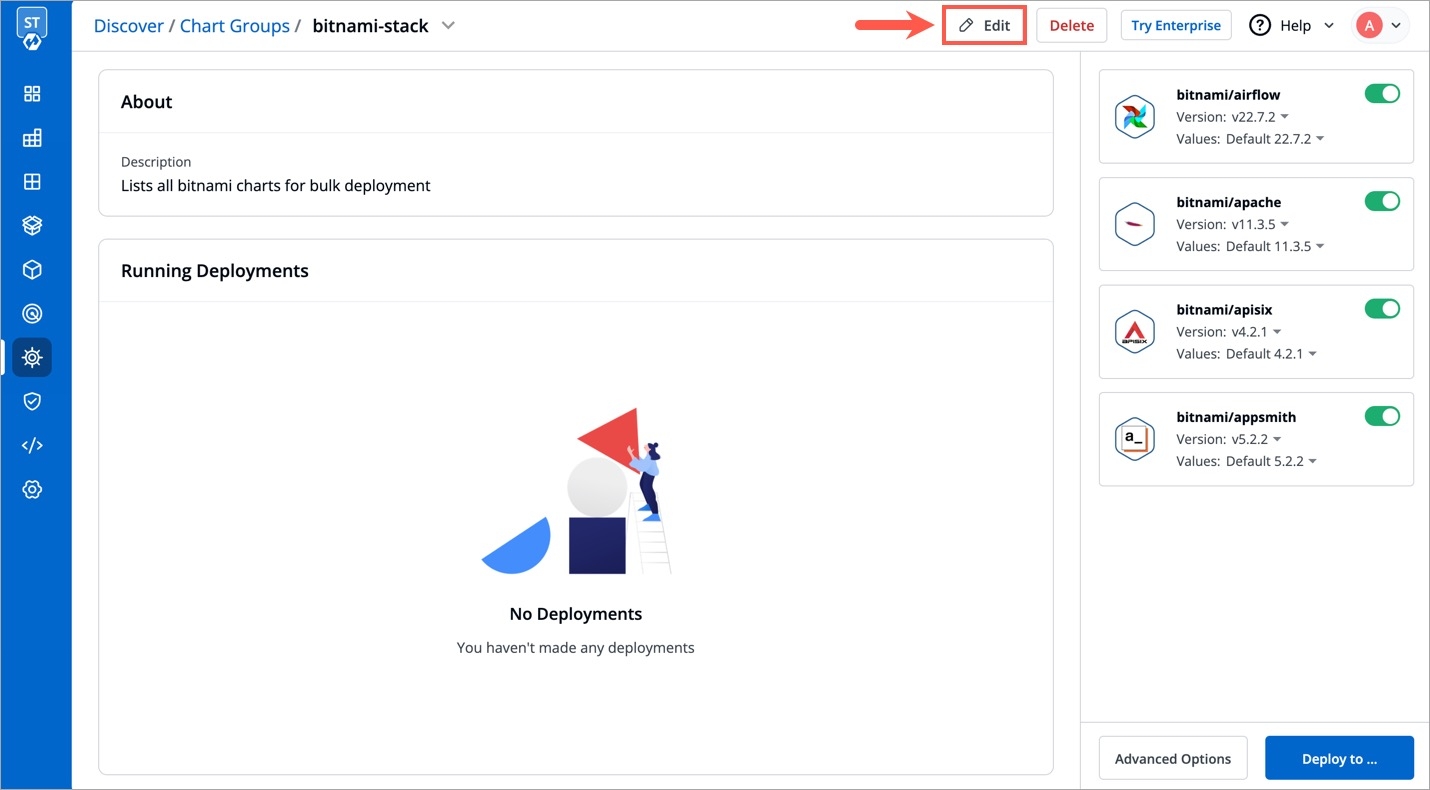
To edit the chart configuration, Click on Edit.
You can Add more charts or Delete charts from your existing Chart Group. After making any changes, click on Save to save changes for the Chart Group.
If you wish to edit the chart configuration of any chart in the chart group, click on that Chart and edit the configurations in YAML file. You also can edit the App Name, Chart Version, Values, Deploy Environment and the YAML file from here.
After changing the configurations, click on Deploy to initiate the deployment of the chart in the Chart Group.
| Key | Description |
|---|---|
| Key | Description |
|---|---|
App Name
Name of the app
Project
Project of the app
Environment
Environment of the app to be deployed in
Chart Version
Version of the chart to be used
App Name
Name of the app
Project
Name of Project in which app has to be created
Environment
Name of the Environment in which app has to be deployed
Chart Version
Select the Version of the chart to be used
