Rollout Deployment
Last updated
Was this helpful?

Last updated
Was this helpful?
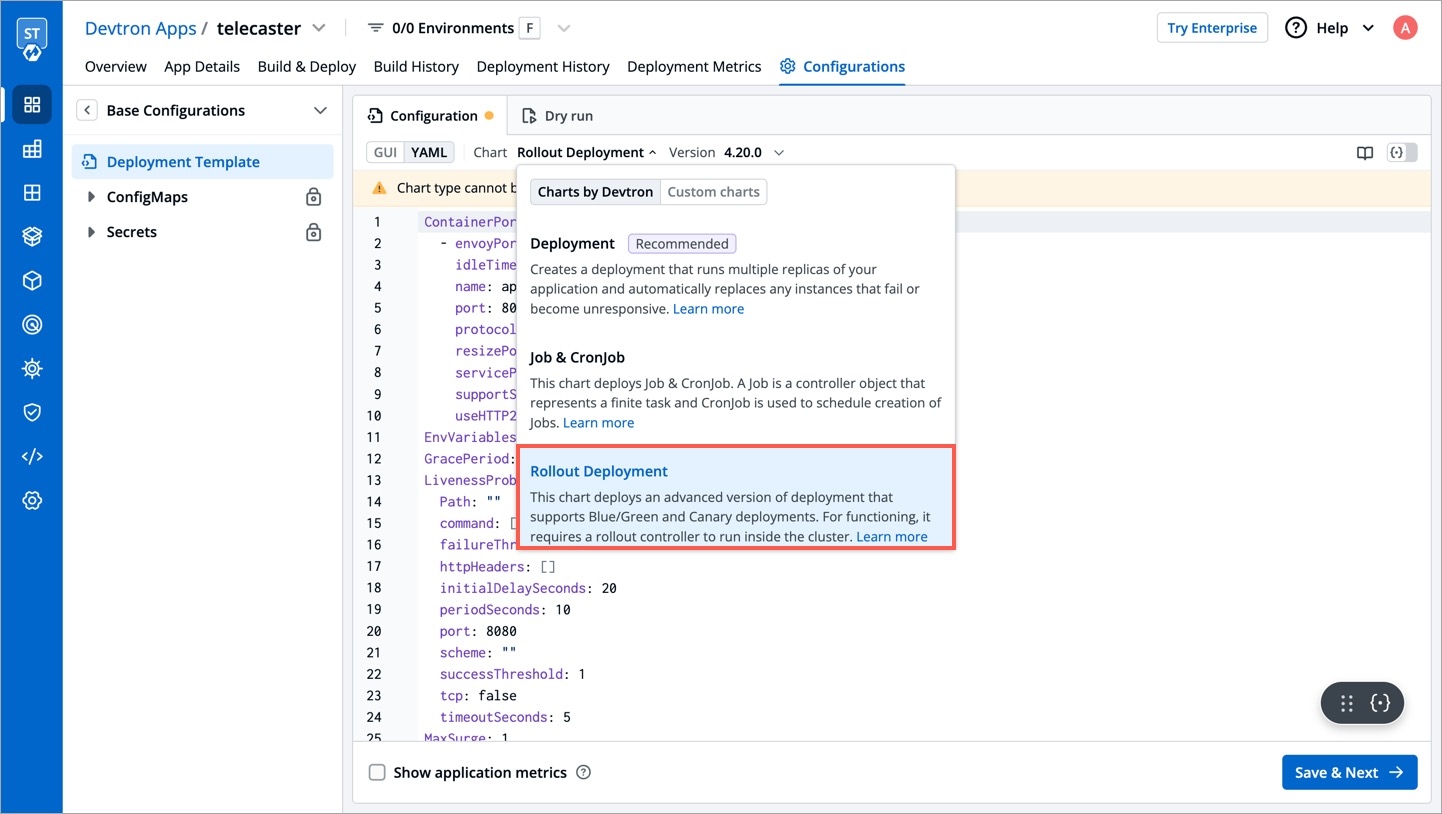
The Rollout Deployment chart deploys an advanced version of deployment that supports Blue/Green and Canary deployments. For functioning, it requires a rollout controller to run inside the cluster.
You can define application behavior by providing information in the following sections:
Chart version
Basic (GUI)
Advanced (YAML)
Show application metrics
Super-admins can lock keys in rollout deployment template to prevent non-super-admins from modifying those locked keys. Refer Lock Deployment Configuration to know more.
This defines the ports on which application services will be exposed to other services.
envoyPort
envoy port for the container.
envoyTimeout
envoy Timeout for the container,envoy supports a wide range of timeouts that may need to be configured depending on the deployment.By default the envoytimeout is 15s.
idleTimeout
the duration of time that a connection is idle before the connection is terminated.
name
name of the port.
port
port for the container.
servicePort
port of the corresponding kubernetes service.
supportStreaming
Used for high performance protocols like grpc where timeout needs to be disabled.
useHTTP2
Envoy container can accept HTTP2 requests.
EnvVariables provide run-time information to containers and allow to customize how the application works and the behavior of the applications on the system.
Here we can pass the list of env variables , every record is an object which contain the name of variable along with value.
To set environment variables for the containers that run in the Pod.
IMP Docker image should have env variables, whatever we want to set.
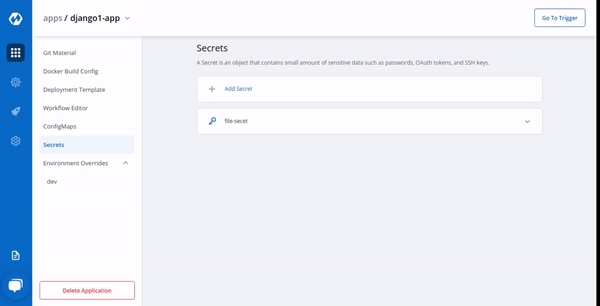
But ConfigMap and Secret are the preferred way to inject env variables. You can create this in App Configuration Section.
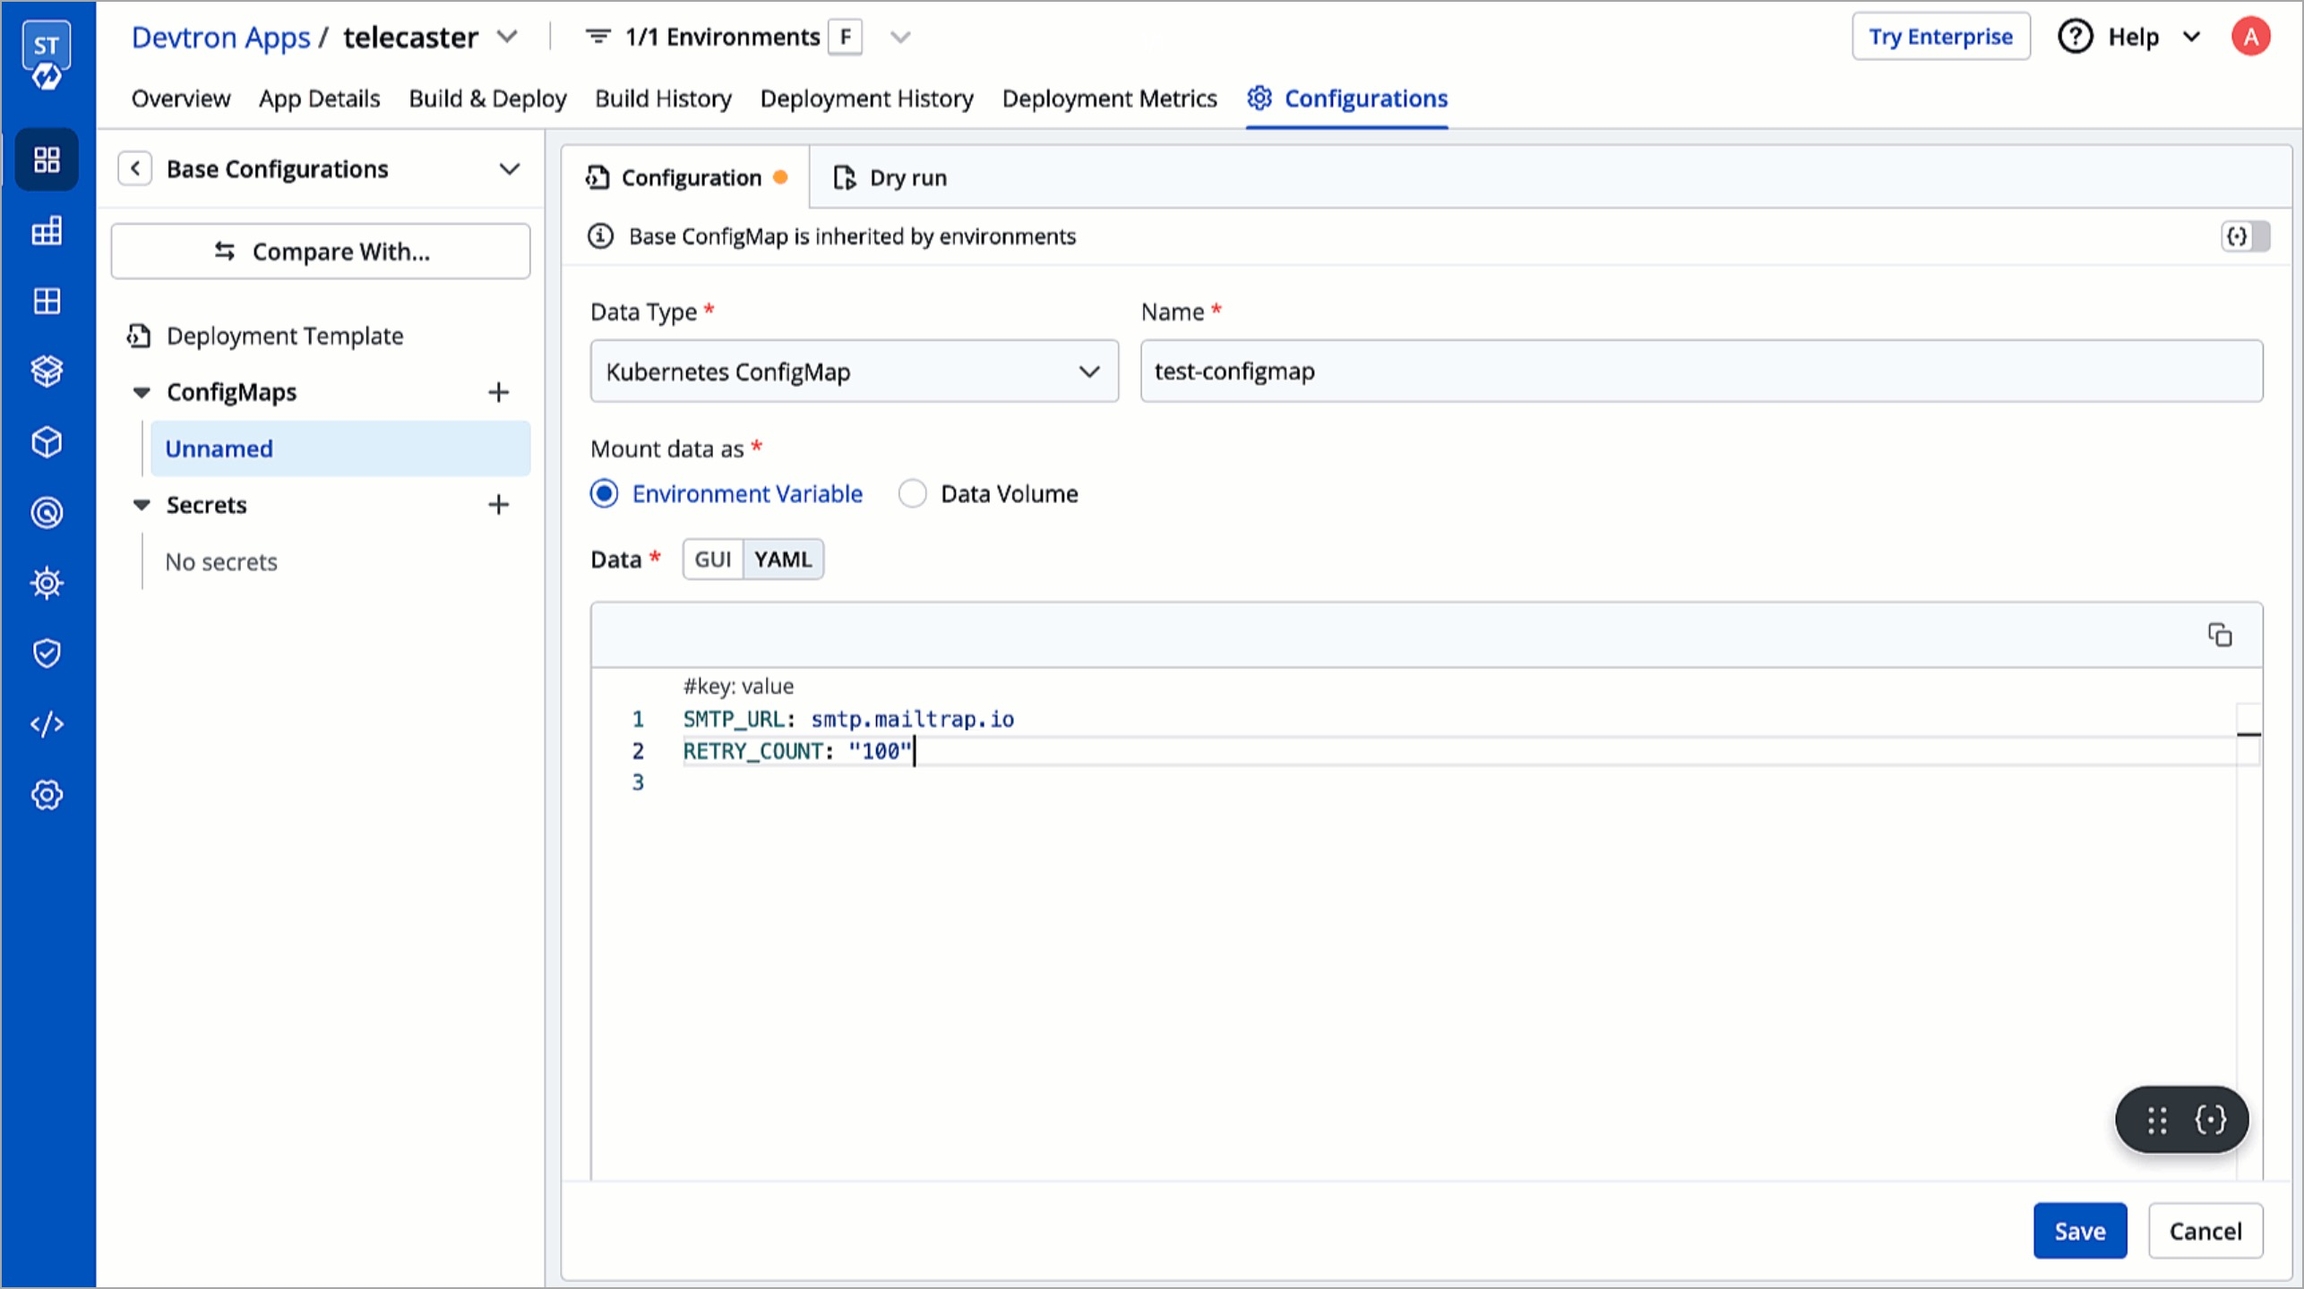
It is a centralized storage, specific to k8s namespace where key-value pairs are stored in plain text.
It is a centralized storage, specific to k8s namespace where we can store the key-value pairs in plain text as well as in encrypted(Base64) form.
IMP All key-values of Secret and CofigMap will reflect to your application.
If this check fails, kubernetes restarts the pod. This should return error code in case of non-recoverable error.
Path
It define the path where the liveness needs to be checked.
initialDelaySeconds
It defines the time to wait before a given container is checked for liveliness.
periodSeconds
It defines how often (in seconds) to perform the liveness probe.
successThreshold
It defines the number of successes required before a given container is said to fulfil the liveness probe.
timeoutSeconds
The maximum time (in seconds) for the probe to complete.
failureThreshold
The number of consecutive failures required to consider the probe as failed.
command
The mentioned command is executed to perform the livenessProbe. If the command returns a non-zero value, it's equivalent to a failed probe.
httpHeaders
Custom headers to set in the request. HTTP allows repeated headers,You can override the default headers by defining .httpHeaders for the probe.
scheme
Scheme to use for connecting to the host (HTTP or HTTPS). Defaults to HTTP.
tcp
The kubelet will attempt to open a socket to your container on the specified port. If it can establish a connection, the container is considered healthy.
The maximum number of pods that can be unavailable during the update process. The value of "MaxUnavailable: " can be an absolute number or percentage of the replicas count. The default value of "MaxUnavailable: " is 25%.
The maximum number of pods that can be created over the desired number of pods. For "MaxSurge: " also, the value can be an absolute number or percentage of the replicas count. The default value of "MaxSurge: " is 25%.
This specifies the minimum number of seconds for which a newly created Pod should be ready without any of its containers crashing, for it to be considered available. This defaults to 0 (the Pod will be considered available as soon as it is ready).
If this check fails, kubernetes stops sending traffic to the application. This should return error code in case of errors which can be recovered from if traffic is stopped.
Path
It define the path where the readiness needs to be checked.
initialDelaySeconds
It defines the time to wait before a given container is checked for readiness.
periodSeconds
It defines how often (in seconds) to perform the readiness probe.
successThreshold
It defines the number of successes required before a given container is said to fulfill the readiness probe.
timeoutSeconds
The maximum time (in seconds) for the probe to complete.
failureThreshold
The number of consecutive failures required to consider the probe as failed.
command
The mentioned command is executed to perform the readinessProbe. If the command returns a non-zero value, it's equivalent to a failed probe.
httpHeaders
Custom headers to set in the request. HTTP allows repeated headers,You can override the default headers by defining .httpHeaders for the probe.
scheme
Scheme to use for connecting to the host (HTTP or HTTPS). Defaults to HTTP.
tcp
The kubelet will attempt to open a socket to your container on the specified port. If it can establish a connection, the container is considered healthy.
Startup Probe in Kubernetes is a type of probe used to determine when a container within a pod is ready to start accepting traffic. It is specifically designed for applications that have a longer startup time.
Path
It define the path where the startup needs to be checked.
initialDelaySeconds
It defines the time to wait before a given container is checked for startup.
periodSeconds
It defines how often (in seconds) to perform the startup probe.
successThreshold
The number of consecutive successful probe results required to mark the container as ready.
timeoutSeconds
The maximum time (in seconds) for the probe to complete.
failureThreshold
The number of consecutive failures required to consider the probe as failed.
command
The mentioned command is executed to perform the startup probe. If the command returns a non-zero value, it's equivalent to a failed probe.
httpHeaders
Custom headers to set in the request. HTTP allows repeated headers,You can override the default headers by defining .httpHeaders for the probe.
tcp
The kubelet will attempt to open a socket to your container on the specified port. If it can establish a connection, the container is considered healthy.
This is connected to HPA and controls scaling up and down in response to request load.
enabled
Set true to enable autoscaling else set false.
MinReplicas
Minimum number of replicas allowed for scaling.
MaxReplicas
Maximum number of replicas allowed for scaling.
TargetCPUUtilizationPercentage
The target CPU utilization that is expected for a container.
TargetMemoryUtilizationPercentage
The target memory utilization that is expected for a container.
extraMetrics
Used to give external metrics for autoscaling.
fullnameOverride replaces the release fullname created by default by devtron, which is used to construct Kubernetes object names. By default, devtron uses {app-name}-{environment-name} as release fullname.
Image is used to access images in kubernetes, pullpolicy is used to define the instances calling the image, here the image is pulled when the image is not present,it can also be set as "Always".
enabled
Determines whether to create a ServiceAccount for pods or not. If set to true, a ServiceAccount will be created.
name
Specifies the name of the ServiceAccount to use.
annotations
Specify annotations for the ServiceAccount.
imagePullSecrets contains the docker credentials that are used for accessing a registry.
regcred is the secret that contains the docker credentials that are used for accessing a registry. Devtron will not create this secret automatically, you'll have to create this secret using dt-secrets helm chart in the App store or create one using kubectl. You can follow this documentation Pull an Image from a Private Registry https://kubernetes.io/docs/tasks/configure-pod-container/pull-image-private-registry/ .
the hostAliases field is used in a Pod specification to associate additional hostnames with the Pod's IP address. This can be helpful in scenarios where you need to resolve specific hostnames to the Pod's IP within the Pod itself.
This allows public access to the url. Please ensure you are using the right nginx annotation for nginx class. The default value is nginx.
Legacy deployment-template ingress format
enabled
Enable or disable ingress
annotations
To configure some options depending on the Ingress controller
host
Host name
pathType
Path in an Ingress is required to have a corresponding path type. Supported path types are ImplementationSpecific, Exact and Prefix.
path
Path name
tls
It contains security details
This allows private access to the url, please ensure you are using right nginx annotation for nginx class, its default value is nginx
enabled
Enable or disable ingress
annotations
To configure some options depending on the Ingress controller
host
Host name
pathType
Path in an Ingress is required to have a corresponding path type. Supported path types are ImplementationSpecific, Exact and Prefix.
path
Path name
pathType
Supported path types are ImplementationSpecific, Exact and Prefix.
tls
It contains security details
Specialized containers that run before app containers in a Pod. Init containers can contain utilities or setup scripts not present in an app image. One can use base image inside initContainer by setting the reuseContainerImage flag to true.
To wait for given period of time before switch active the container.
These define minimum and maximum RAM and CPU available to the application.
Resources are required to set CPU and memory usage.
Limits make sure a container never goes above a certain value. The container is only allowed to go up to the limit, and then it is restricted.
Requests are what the container is guaranteed to get.
This defines annotations and the type of service, optionally can define name also.
type
Select the type of service, default ClusterIP
annotations
Annotations are widely used to attach metadata and configs in Kubernetes.
name
Optional field to assign name to service
loadBalancerSourceRanges
If service type is LoadBalancer, Provide a list of whitelisted IPs CIDR that will be allowed to use the Load Balancer.
Note - If loadBalancerSourceRanges is not set, Kubernetes allows traffic from 0.0.0.0/0 to the LoadBalancer / Node Security Group(s).
It is required when some values need to be read from or written to an external disk.
It is used to provide mounts to the volume.
Spec is used to define the desire state of the given container.
Node Affinity allows you to constrain which nodes your pod is eligible to schedule on, based on labels of the node.
Inter-pod affinity allow you to constrain which nodes your pod is eligible to be scheduled based on labels on pods.
Key part of the label for node selection, this should be same as that on node. Please confirm with devops team.
Value part of the label for node selection, this should be same as that on node. Please confirm with devops team.
Taints are the opposite, they allow a node to repel a set of pods.
A given pod can access the given node and avoid the given taint only if the given pod satisfies a given taint.
Taints and tolerations are a mechanism which work together that allows you to ensure that pods are not placed on inappropriate nodes. Taints are added to nodes, while tolerations are defined in the pod specification. When you taint a node, it will repel all the pods except those that have a toleration for that taint. A node can have one or many taints associated with it.
This is used to give arguments to command.
It contains the commands to run inside the container.
enabled
To enable or disable the command.
value
It contains the commands.
workingDir
It is used to specify the working directory where commands will be executed.
Containers section can be used to run side-car containers along with your main container within same pod. Containers running within same pod can share volumes and IP Address and can address each other @localhost. We can use base image inside container by setting the reuseContainerImage flag to true.
It is a kubernetes monitoring tool and the name of the file to be monitored as monitoring in the given case.It describes the state of the prometheus.
Accepts an array of Kubernetes objects. You can specify any kubernetes yaml here and it will be applied when your app gets deployed.
Kubernetes waits for the specified time called the termination grace period before terminating the pods. By default, this is 30 seconds. If your pod usually takes longer than 30 seconds to shut down gracefully, make sure you increase the GracePeriod.
A Graceful termination in practice means that your application needs to handle the SIGTERM message and begin shutting down when it receives it. This means saving all data that needs to be saved, closing down network connections, finishing any work that is left, and other similar tasks.
There are many reasons why Kubernetes might terminate a perfectly healthy container. If you update your deployment with a rolling update, Kubernetes slowly terminates old pods while spinning up new ones. If you drain a node, Kubernetes terminates all pods on that node. If a node runs out of resources, Kubernetes terminates pods to free those resources. It’s important that your application handle termination gracefully so that there is minimal impact on the end user and the time-to-recovery is as fast as possible.
It is used for providing server configurations.
It gives the details for deployment.
image_tag
It is the image tag
image
It is the URL of the image
It gives the set of targets to be monitored.
It is used to configure database migration.
These Istio configurations collectively provide a comprehensive set of tools for controlling access, authenticating requests, enforcing security policies, and configuring traffic behavior within a microservices architecture. The specific settings you choose would depend on your security and traffic management requirements.
These Istio configurations collectively provide a comprehensive set of tools for controlling access, authenticating requests, enforcing security policies, and configuring traffic behavior within a microservices architecture. The specific settings you choose would depend on your security and traffic management requirements.
istio
Istio enablement. When istio.enable set to true, Istio would be enabled for the specified configurations
authorizationPolicy
It allows you to define access control policies for service-to-service communication.
action
Determines whether to ALLOW or DENY the request based on the defined rules.
provider
Authorization providers are external systems or mechanisms used to make access control decisions.
rules
List of rules defining the authorization policy. Each rule can specify conditions and requirements for allowing or denying access.
destinationRule
It allows for the fine-tuning of traffic policies and load balancing for specific services. You can define subsets of a service and apply different traffic policies to each subset.
subsets
Specifies subsets within the service for routing and load balancing.
trafficPolicy
Policies related to connection pool size, outlier detection, and load balancing.
gateway
Allowing external traffic to enter the service mesh through the specified configurations.
host
The external domain through which traffic will be routed into the service mesh.
tls
Traffic to and from the gateway should be encrypted using TLS.
secretName
Specifies the name of the Kubernetes secret that contains the TLS certificate and private key. The TLS certificate is used for securing the communication between clients and the Istio gateway.
peerAuthentication
It allows you to enforce mutual TLS and control the authentication between services.
mtls
Mutual TLS. Mutual TLS is a security protocol that requires both client and server, to authenticate each other using digital certificates for secure communication.
mode
Mutual TLS mode, specifying how mutual TLS should be applied. Modes include STRICT, PERMISSIVE, and DISABLE.
portLevelMtls
Configures port-specific mTLS settings. Allows for fine-grained control over the application of mutual TLS on specific ports.
selector
Configuration for selecting workloads to apply PeerAuthentication.
requestAuthentication
Defines rules for authenticating incoming requests.
jwtRules
Rules for validating JWTs (JSON Web Tokens). It defines how incoming JWTs should be validated for authentication purposes.
selector
Specifies the conditions under which the RequestAuthentication rules should be applied.
virtualService
Enables the definition of rules for how traffic should be routed to different services within the service mesh.
gateways
Specifies the gateways to which the rules defined in the VirtualService apply.
hosts
List of hosts (domains) to which this VirtualService is applied.
http
Configuration for HTTP routes within the VirtualService. It define routing rules based on HTTP attributes such as URI prefixes, headers, timeouts, and retry policies.
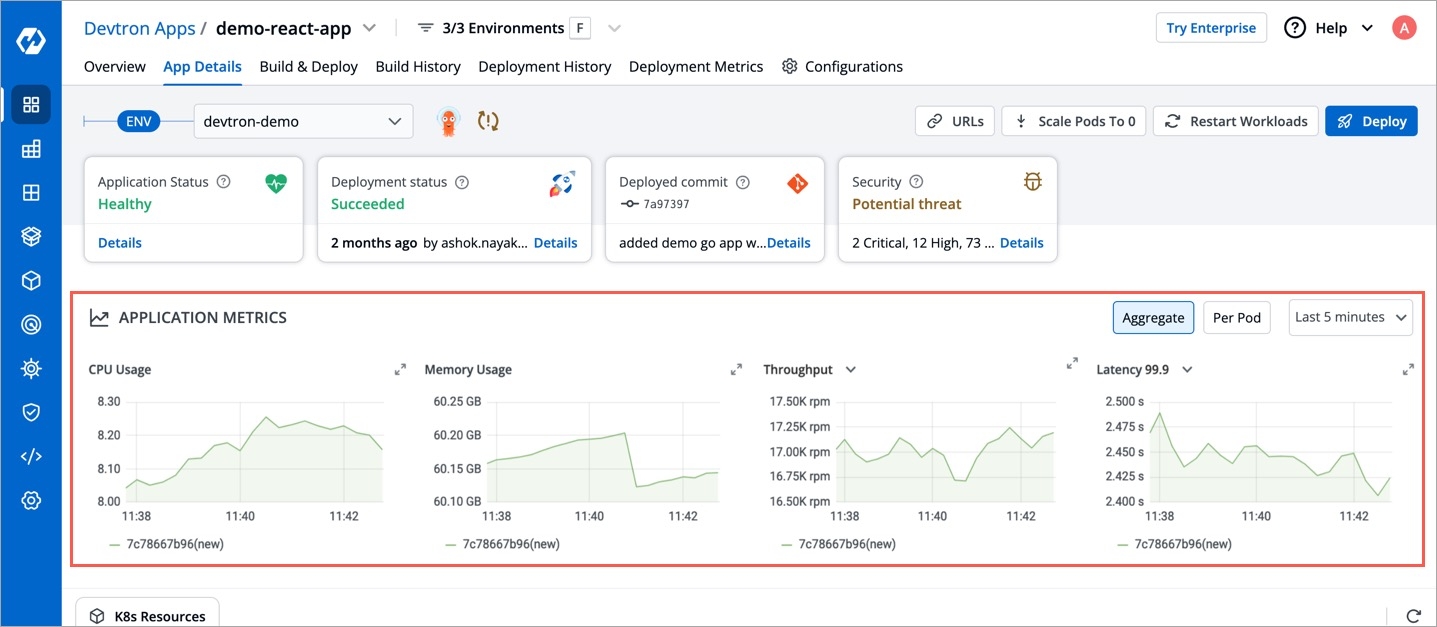
Application metrics can be enabled to see your application's metrics-CPU Service Monitor usage, Memory Usage, Status, Throughput and Latency.
It gives the realtime metrics of the deployed applications
Deployment Frequency
It shows how often this app is deployed to production
Change Failure Rate
It shows how often the respective pipeline fails.
Mean Lead Time
It shows the average time taken to deliver a change to production.
Mean Time to Recovery
It shows the average time taken to fix a failed pipeline.
A service account provides an identity for the processes that run in a Pod.
When you access the cluster, you are authenticated by the API server as a particular User Account. Processes in containers inside pod can also contact the API server. When you are authenticated as a particular Service Account.
When you create a pod, if you do not create a service account, it is automatically assigned the default service account in the namespace.
You can create PodDisruptionBudget for each application. A PDB limits the number of pods of a replicated application that are down simultaneously from voluntary disruptions. For example, an application would like to ensure the number of replicas running is never brought below the certain number.
or
You can specify either maxUnavailable or minAvailable in a PodDisruptionBudget and it can be expressed as integers or as a percentage.
minAvailable
Evictions are allowed as long as they leave behind 1 or more healthy pods of the total number of desired replicas.
maxUnavailable
Evictions are allowed as long as at most 1 unhealthy replica among the total number of desired replicas.
Envoy is attached as a sidecar to the application container to collect metrics like 4XX, 5XX, Throughput and latency. You can now configure the envoy settings such as idleTimeout, resources etc.
Alerting rules allow you to define alert conditions based on Prometheus expressions and to send notifications about firing alerts to an external service.
In this case, Prometheus will check that the alert continues to be active during each evaluation for 1 minute before firing the alert. Elements that are active, but not firing yet, are in the pending state.
Labels are key/value pairs that are attached to pods. Labels are intended to be used to specify identifying attributes of objects that are meaningful and relevant to users, but do not directly imply semantics to the core system. Labels can be used to organize and to select subsets of objects.
Pod Annotations are widely used to attach metadata and configs in Kubernetes.
HPA, by default is configured to work with CPU and Memory metrics. These metrics are useful for internal cluster sizing, but you might want to configure wider set of metrics like service latency, I/O load etc. The custom metrics in HPA can help you to achieve this.
Wait for given period of time before scaling down the container.
If you want to see application metrics like different HTTP status codes metrics, application throughput, latency, response time. Enable the Application metrics from below the deployment template Save button. After enabling it, you should be able to see all metrics on App detail page. By default it remains disabled.
Once all the Deployment template configurations are done, click on Save to save your deployment configuration. Now you are ready to create Workflow to do CI/CD.
Helm Chart json schema is used to validate the deployment template values.
reference-chart_3-12-0
reference-chart_3-11-0
reference-chart_3-10-0
reference-chart_3-9-0
The values of CPU and Memory in limits must be greater than or equal to in requests respectively. Similarly, In case of envoyproxy, the values of limits are greater than or equal to requests as mentioned below.
Prerequisite: KEDA controller should be installed in the cluster. To install KEDA controller using Helm, navigate to chart store and search for keda chart and deploy it. You can follow this documentation for deploying a Helm chart on Devtron.
KEDA Helm repo : https://kedacore.github.io/charts
KEDA is a Kubernetes-based Event Driven Autoscaler. With KEDA, you can drive the scaling of any container in Kubernetes based on the number of events needing to be processed. KEDA can be installed into any Kubernetes cluster and can work alongside standard Kubernetes components like the Horizontal Pod Autoscaler(HPA).
Example for autoscaling with KEDA using Prometheus metrics is given below:
Example for autosccaling with KEDA based on kafka is given below :
Kubernetes NetworkPolicies control pod communication by defining rules for incoming and outgoing traffic.
enabled
Enable or disable NetworkPolicy.
annotations
Additional metadata or information associated with the NetworkPolicy.
labels
Labels to apply to the NetworkPolicy.
podSelector
Each NetworkPolicy includes a podSelector which selects the grouping of pods to which the policy applies. The example policy selects pods with the label "role=db". An empty podSelector selects all pods in the namespace.
policyTypes
Each NetworkPolicy includes a policyTypes list which may include either Ingress, Egress, or both.
Ingress
Controls incoming traffic to pods.
Egress
Controls outgoing traffic from pods.
Winter Soldier can be used to
cleans up (delete) Kubernetes resources
reduce workload pods to 0
NOTE: After deploying this we can create the Hibernator object and provide the custom configuration by which workloads going to delete, sleep and many more. for more information check the main repo
Given below is template values you can give in winter-soldier:
enabled
false,true
decide the enabling factor
apiVersion
pincher.devtron.ai/v1beta1, pincher.devtron.ai/v1alpha1
specific api version
action
sleep,delete, scale
This specify the action need to perform.
timeRangesWithZone:timeZone
eg:- "Asia/Kolkata","US/Pacific"
timeRangesWithZone:timeRanges
array of [ timeFrom, timeTo, weekdayFrom, weekdayTo]
It use to define time period/range on which the user need to perform the specified action. you can have multiple timeRanges.
These settings will take action on Sat and Sun from 00:00 to 23:59:59,
targetReplicas
[n] : n - number of replicas to scale.
These is mandatory field when the action is scale
Default value is [].
fieldSelector
- AfterTime(AddTime( ParseTime({{metadata.creationTimestamp}}, '2006-01-02T15:04:05Z'), '5m'), Now())
These value will take a list of methods to select the resources on which we perform specified action .
here is an example,
Above settings will take action on Sat and Sun from 00:00 to 23:59:59, and on Mon-Fri from 00:00 to 08:00 and 20:00 to 23:59:59. If action:sleep then runs hibernate at timeFrom and unhibernate at timeTo. If action: delete then it will delete workloads at timeFrom and timeTo. Here the action:scale thus it scale the number of resource replicas to targetReplicas: [1,1,1]. Here each element of targetReplicas array is mapped with the corresponding elements of array timeRangesWithZone/timeRanges. Thus make sure the length of both array is equal, otherwise the cnages cannot be observed.
The above example will select the application objects which have been created 10 hours ago across all namespaces excluding application's namespace. Winter soldier exposes following functions to handle time, cpu and memory.
ParseTime - This function can be used to parse time. For eg to parse creationTimestamp use ParseTime({{metadata.creationTimestamp}}, '2006-01-02T15:04:05Z')
AddTime - This can be used to add time. For eg AddTime(ParseTime({{metadata.creationTimestamp}}, '2006-01-02T15:04:05Z'), '-10h') ll add 10h to the time. Use d for day, h for hour, m for minutes and s for seconds. Use negative number to get earlier time.
Now - This can be used to get current time.
CpuToNumber - This can be used to compare CPU. For eg any({{spec.containers.#.resources.requests}}, { MemoryToNumber(.memory) < MemoryToNumber('60Mi')}) will check if any resource.requests is less than 60Mi.
A security context defines privilege and access control settings for a Pod or Container.
To add a security context for main container:
To add a security context on pod level:
You can use topology spread constraints to control how Pods are spread across your cluster among failure-domains such as regions, zones, nodes, and other user-defined topology domains. This can help to achieve high availability as well as efficient resource utilization.
Select the Chart Version using which you want to deploy the application. Refer section for more detail.
You can perform a basic deployment configuration for your application in the Basic (GUI) section instead of configuring the YAML file. Refer section for more detail.
If you want to do additional configurations, then click Advanced (YAML) for modifications. Refer section for more detail.
You can enable Show application metrics to see your application's metrics-CPU Service Monitor usage, Memory Usage, Status, Throughput and Latency.
Refer for more detail.
It use to specify the timeZone used. (It uses standard format. please refer )