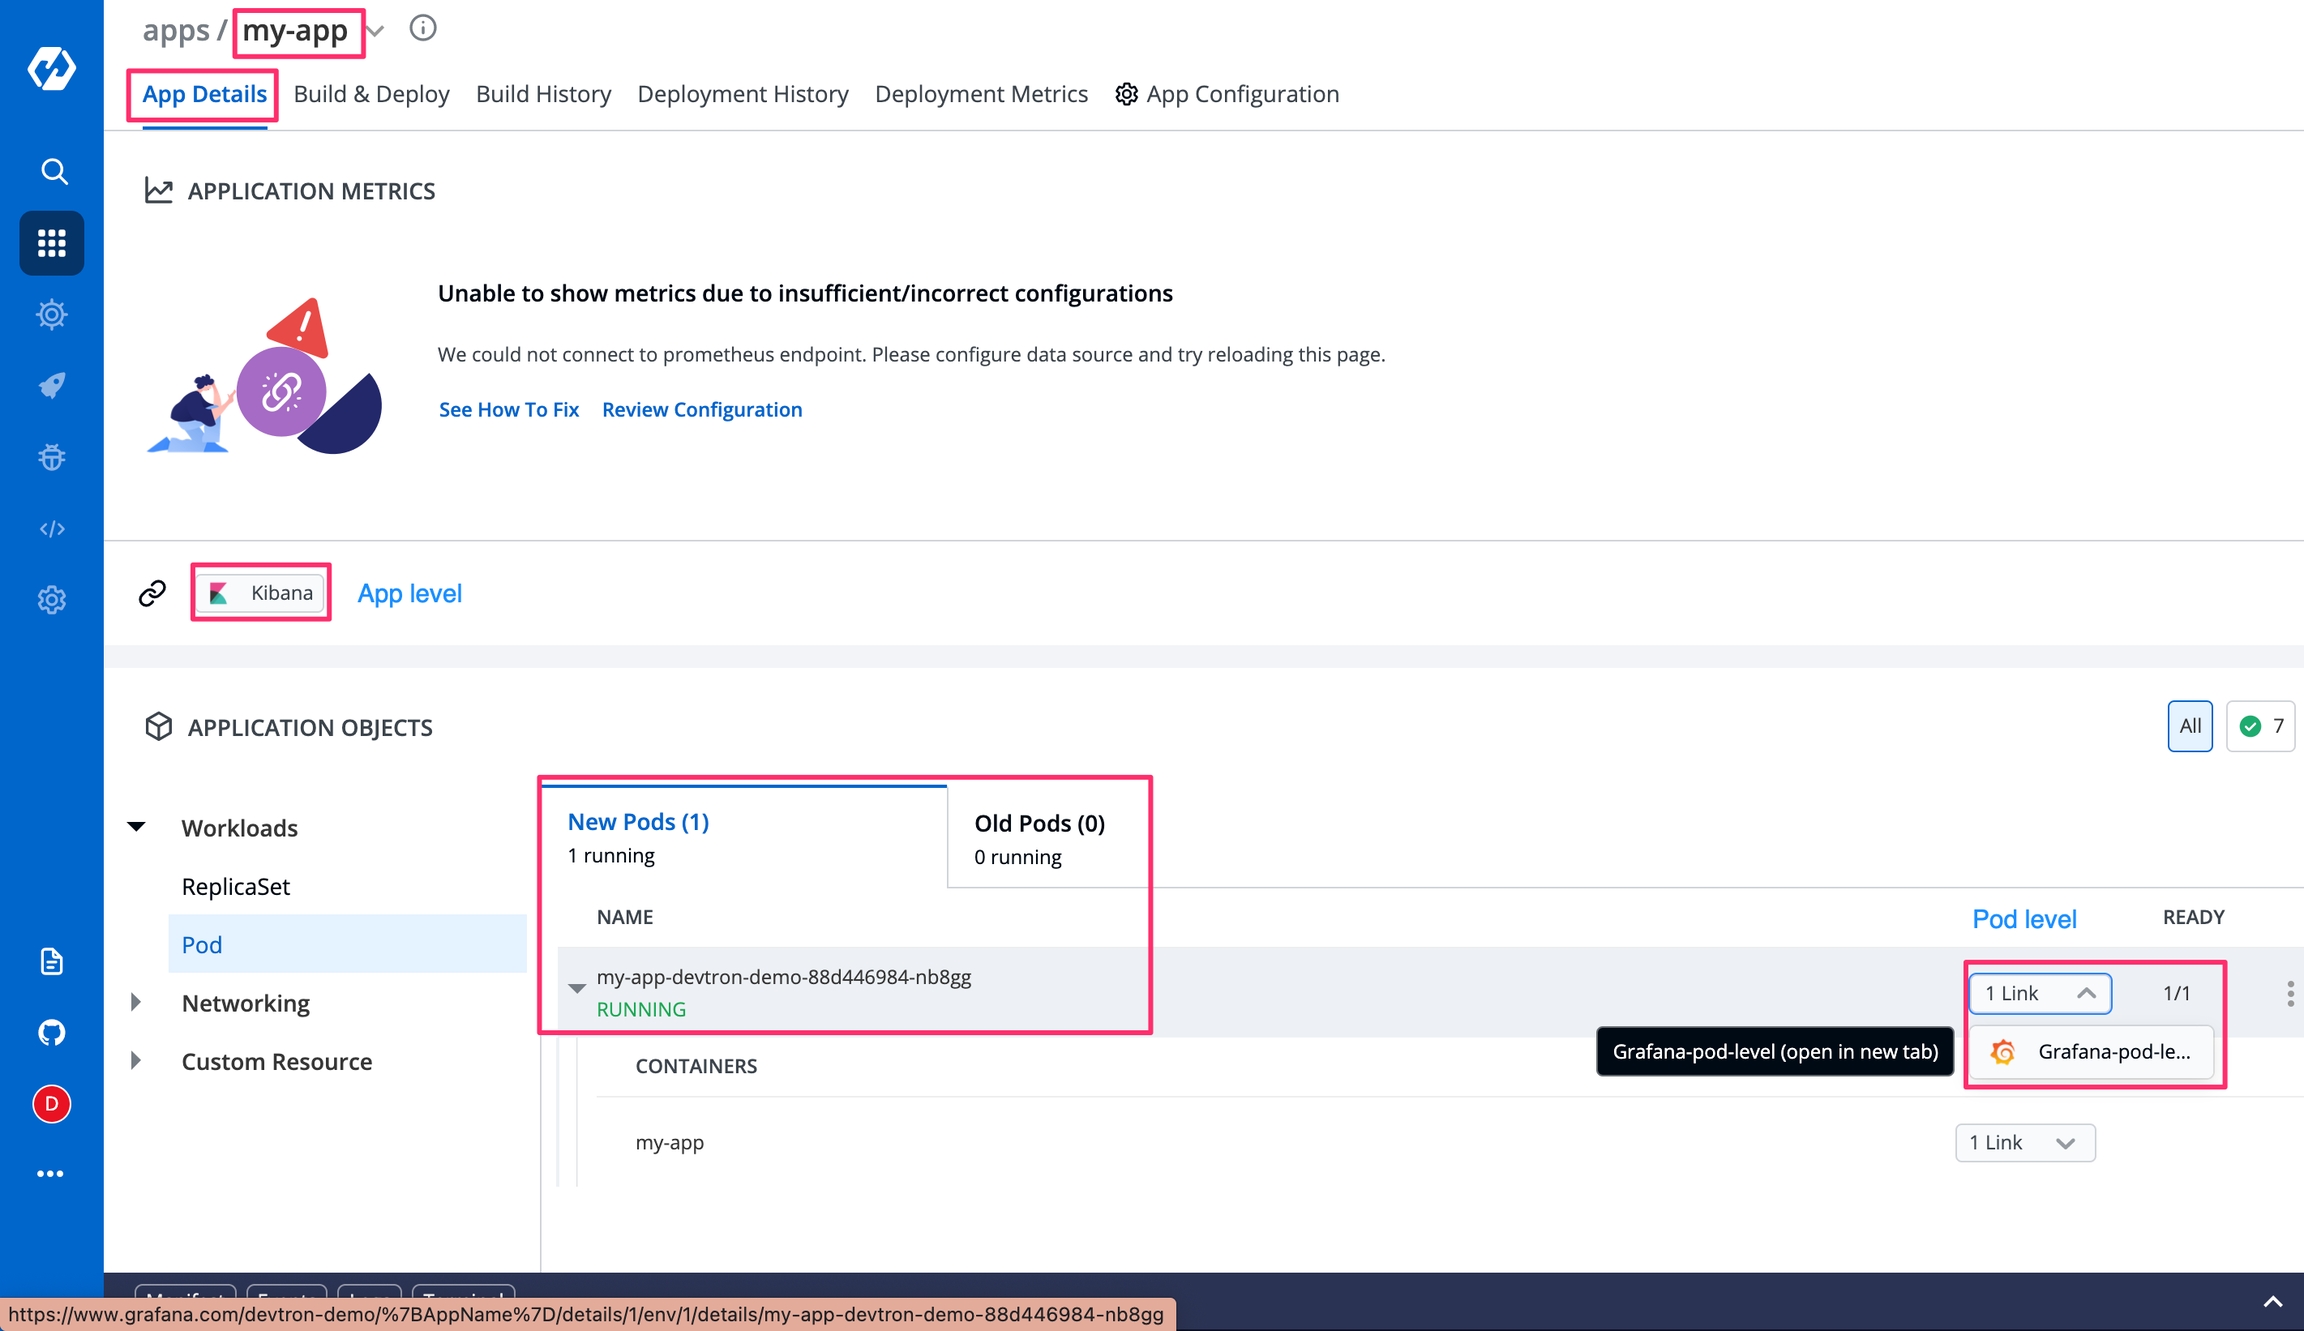
The users can access the configured external links on the App Details page.
Select Applications from the left navigation pane.
After selecting a configured application, select the App Details tab.
Note: The external link configured on the cluster where your app is located is the only one that is visible.
As shown in the screenshot, the monitoring tool appears at the configured component level:
Click on an external link to access the Monitoring Tool.
The link opens in a new tab with the context you specified as env variables in the Add an external link section.
Application metrics can be enabled to see your application's metrics.
Devtron provides certain metrics (CPU and Memory utilization) for each application by default i.e. you do not need to enable “Application metrics”. However, prometheus needs to be present in the cluster and the endpoint of the same should be updated in Global Configurations --> Clusters & Environments section.
There are certain advanced metrics (like Latency, Throughput, 4xx, 5xx, 2xx) which are only available when "Application metrics" is enabled from the Deployment Template. When you enable these advanced metrics, devtron attaches a envoy sidecar container to your main container which runs as a transparent proxy and passes each request through it to measure the advanced metrics.
Note: Since, all the requests are passed through envoy, any misconfiguration in envoy configs can bring your application down, so please test the configurations in a non-production environment extensively.
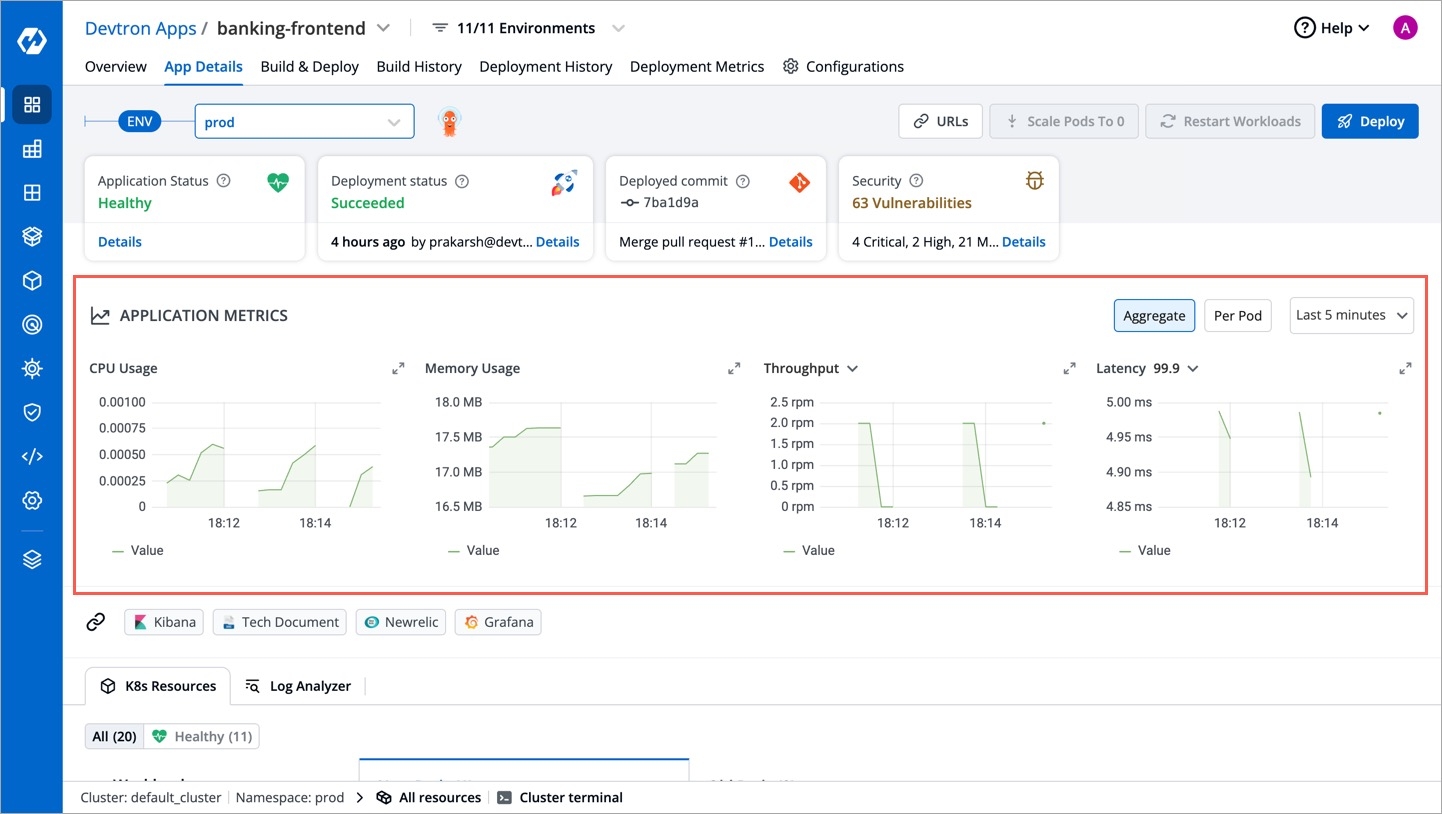
CPU usage is a utilization metric that shows the overall utilization of cpu by an application. It is available as both, aggregated or per pod.
Memory usage is a utilization metric that shows the overall utilization of memory by an application. It is available as both, aggregated or per pod.
This application metrics indicates the number of request processed by an application per minute.
This metrics indicates the application’s response to client’s request with a specific status code i.e 1xx(Communicate transfer protocol leve information), 2xx(Client’s request was accepted successfully), 3xx(Client must take some additional action to complete their request), 4xx(Client side error) or 5xx(Server side error).
Latency metrics shows the latency for an application. Latency measures the delay between an action and a response.
99.9th percentile latency: The maximum latency, in seconds, for the fastest 99.9% of requests.
99th percentile latency: The maximum latency, in seconds, for the fastest 99% of requests.
95th percentile latency: The maximum latency, in seconds, for the fastest 95% of requests.
Note: We also support custom percentile input inside the dropdown .A latency measurement based on a single request is not meaningful.
If the deployment of your application is not successful, then debugging needs to be done to check the cause of the error.
This can be done through App Details section which you can access in the following way:-
Applications->AppName->App Details
Over here, you can see the status of the app as Healthy. If there are some errors with deployment then the status would not be in a Healthy state.
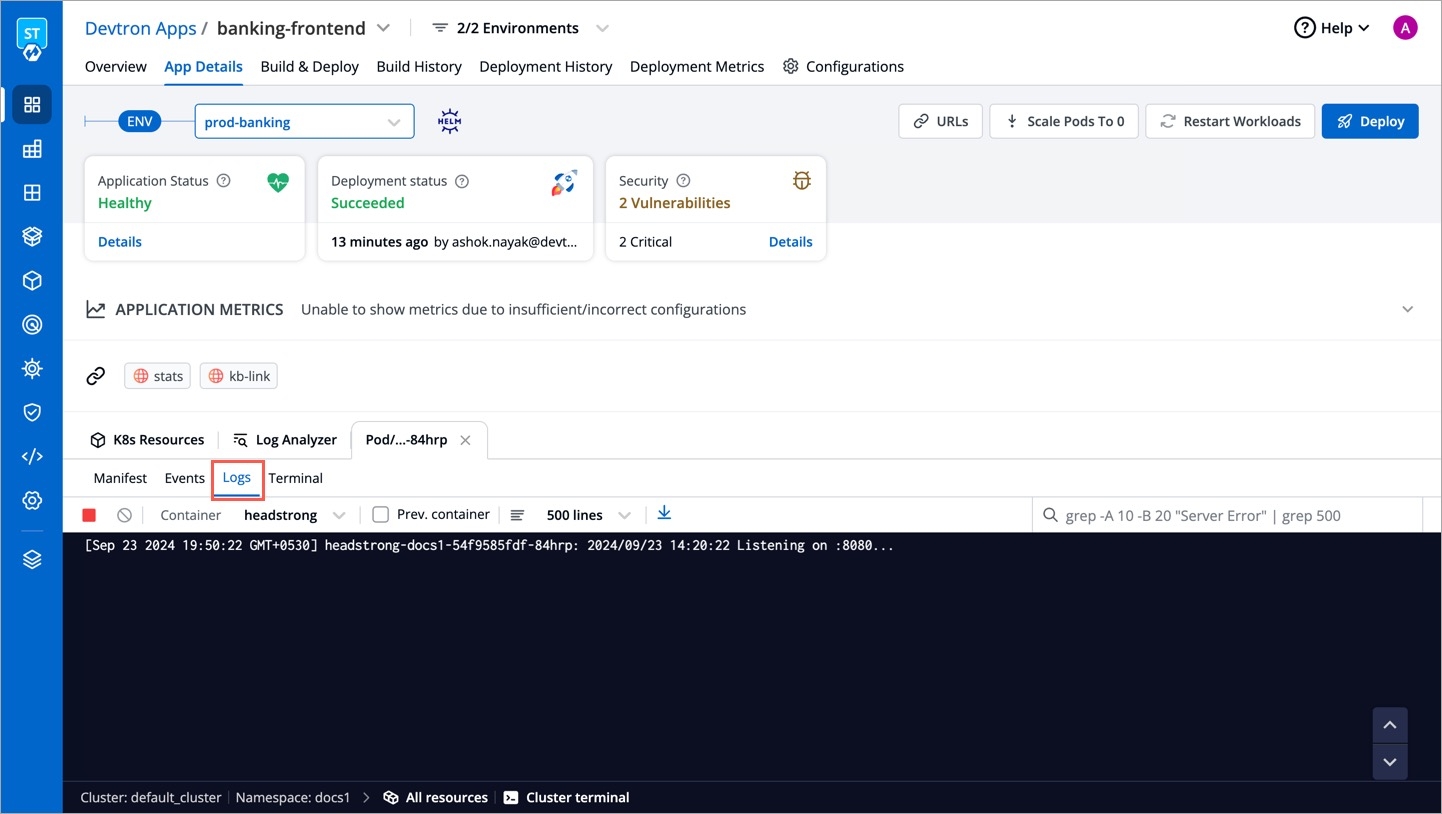
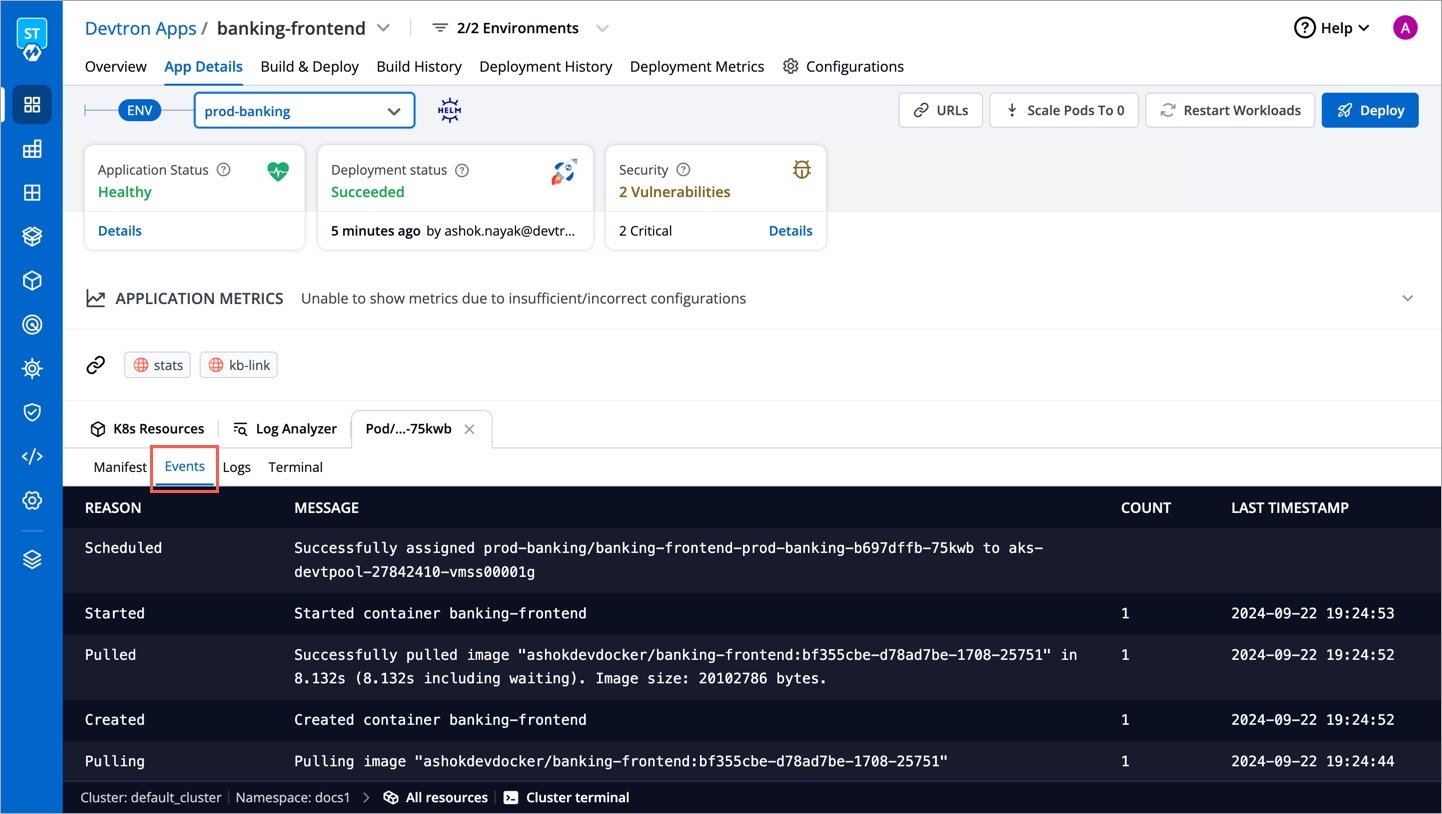
Events of the application are accessible from the bottom left corner.
Events section displays you the events that took place during the deployment of an app. These events are available until 15 minutes of deployment of the application.
Logs contain the logs of the Pods and Containers deployed which you can use for the process of debugging.
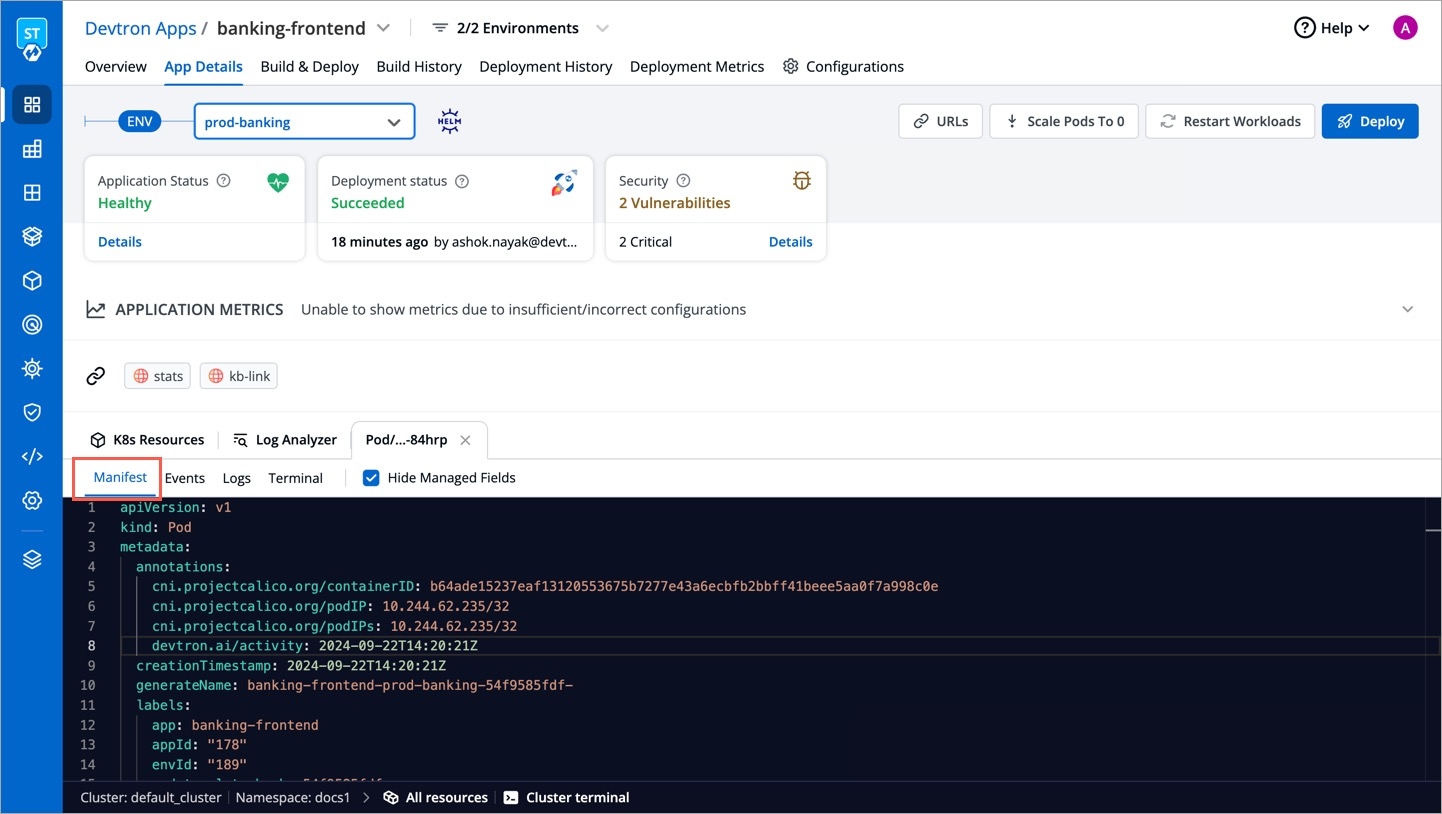
The Manifest shows the critical information such as Container-image, restartCount, state, phase, podIP, startTime etc. and status of the pods deployed.
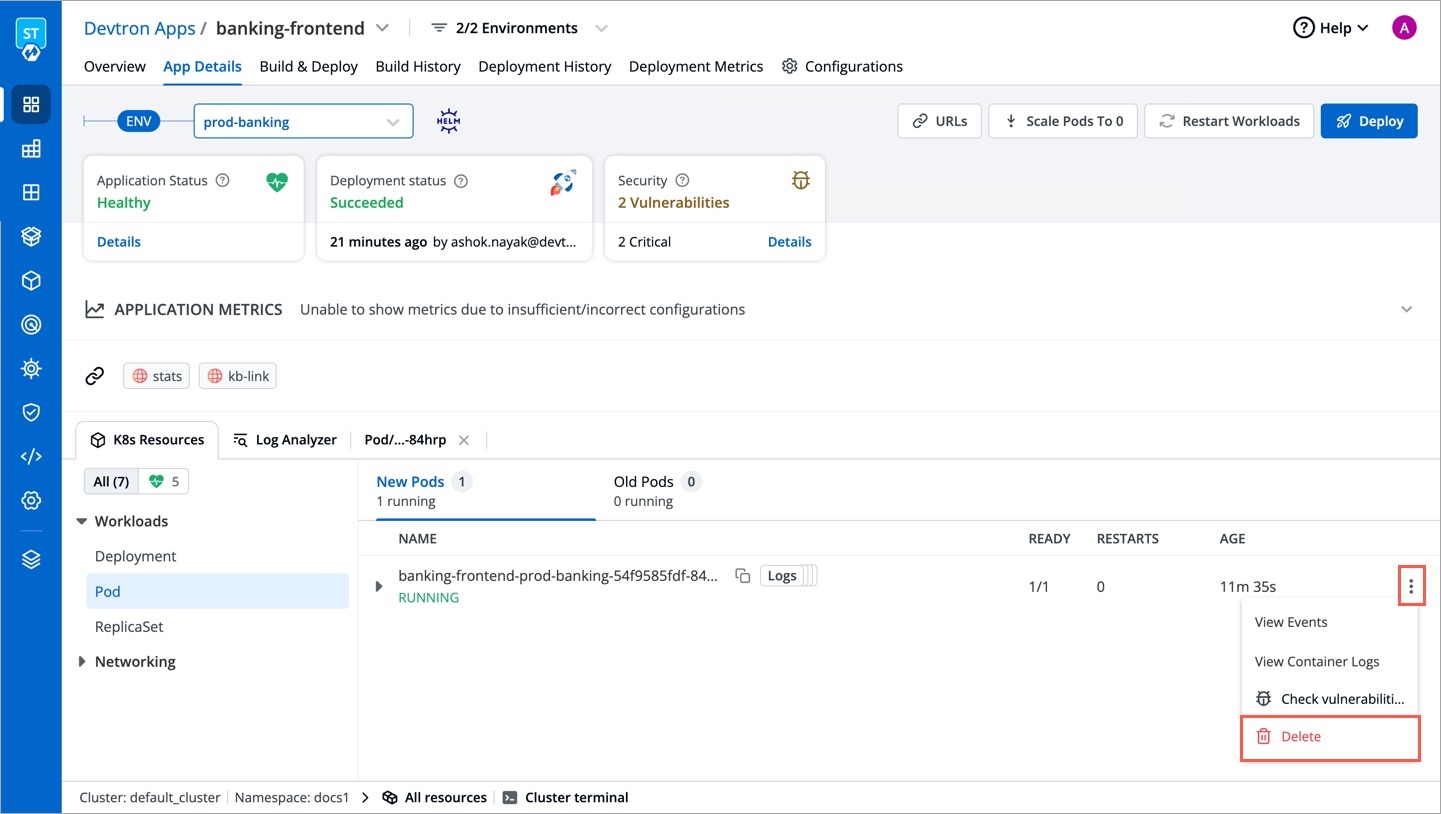
You might run into a situation where you need to delete Pods. You may need to bounce or restart a pod.
Deleting a Pod is not an irksome task, it can simply be deleted by Clicking on Delete Pod.
Suppose you want to setup a new environment, you can delete a pod and thereafter a new pod will be created automatically depending upon the replica count.
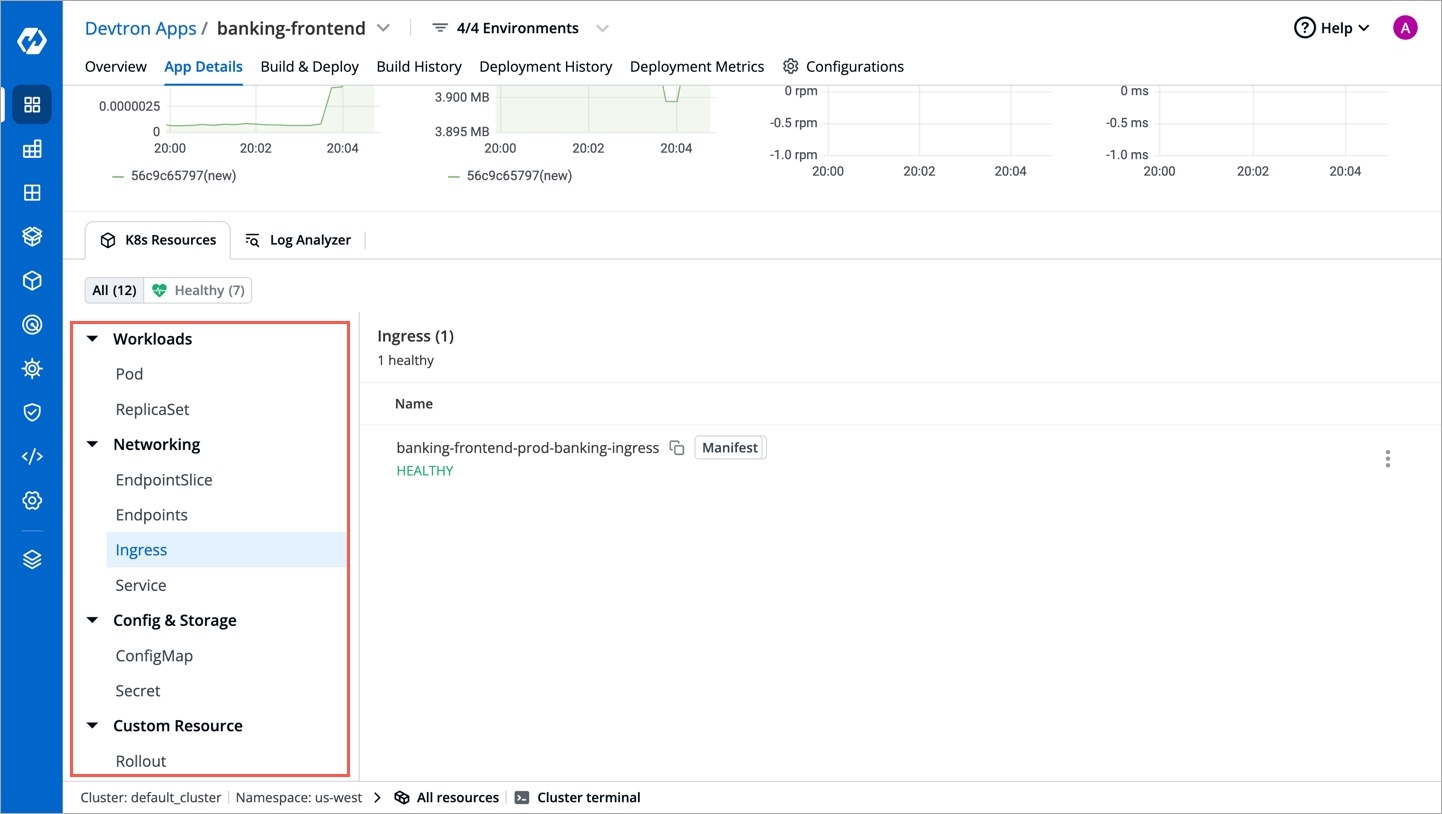
You can view Application Objects in this section of App Details, such as:
You can monitor the application in the App Details section.
Metrics like CPU Usage, Memory Usage, Throughput and Latency can be viewed here.
| Key | Description |
|---|
| Key | Description |
|---|
| ReplicaSet(ensures how many replica of pod should be running), Status of Pod(status of the Pod) |
| Service(an abstraction which defines a logical set of Pods), Endpoints(names of the endpoints that implement a Service), Ingress(API object that manages external access to the services in a cluster) |
| ConfigMap( API object used to store non-confidential data in key-value pairs) |
| Rollout(new Pods will be scheduled on Nodes with available resources), ServiceMonitor(specifies how groups of services should be monitored) |
| Percentage of CPU's cycles used by the app. |
| Amount of memory used by app. |
| Performance of the app. |
| Delay caused while transmitting the data. |
