Loading...
Loading...
Loading...
Loading...
Loading...
Loading...
Loading...
Loading...
Loading...
Loading...
Loading...
Loading...
Loading...
Loading...
Loading...
Loading...
Loading...
Loading...
Loading...
Loading...
Loading...
Loading...
Loading...
Loading...
Loading...
Loading...
Loading...
Loading...
Loading...
Loading...
Loading...
Loading...
Loading...
Loading...
Loading...
Loading...
Loading...
Loading...
Loading...
Loading...
Loading...
Loading...
Loading...
Loading...
Loading...
Loading...
Loading...
Loading...
Loading...
Loading...
Loading...
Loading...
Loading...
Loading...
Loading...
Loading...
Loading...
Loading...
Loading...
Loading...
Loading...
Loading...
Loading...
Loading...
Loading...
Loading...
Loading...
Loading...
Loading...
Loading...
Loading...
Add Devtron repository
Install Devtron
For those countries/users where Github is blocked, you can use Gitee as the installation source:
The install commands start Devtron-operator, which takes about 20 minutes to spin up all of the Devtron microservices one by one. You can use the following command to check the status of the installation:
The command executes with one of the following output messages, indicating the status of the installation:
Downloaded
The installer has downloaded all the manifests, and the installation is in progress.
Applied
The installer has successfully applied all the manifests, and the installation is complete.
To check the installer logs, run the following command:
Use the following command to get the dashboard URL:
You will get an output similar to the one shown below:
The hostname aaff16e9760594a92afa0140dbfd99f7-305259315.us-east-1.elb.amazonaws.com as mentioned above is the Loadbalancer URL where you can access the Devtron dashboard.
If you don't see any results or receive a message that says "service doesn't exist," it means Devtron is still installing; please check back in 5 minutes.
Note: You can also do a
CNAMEentry corresponding to your domain/subdomain to point to this Loadbalancer URL to access it at a custom domain.
devtron.yourdomain.com
CNAME
aaff16e9760594a92afa0140dbfd99f7-305259315.us-east-1.elb.amazonaws.com
For admin login, use the username:admin, and run the following command to get the admin password:
Please make sure that you do not have anything inside namespaces devtroncd, devtron-cd, devtron-ci, and devtron-demo as the below steps will clean everything inside these namespaces:
Install .
This installation will use Minio for storing build logs and cache.
This installation will use AWS s3 buckets for storing build logs and cache. Refer to the AWS specific parameters on the page.
This installation will use Azure Blob Storage for storing build logs and cache. Refer to the Azure specific parameters on the page.
Append the command with --set installer.release="vX.X.X" to install a particular version of Devtron. Where vx.x.x is the .
If you are planning to use Devtron for production deployments, please refer to our recommended overrides for .
Next,
Still facing issues, please reach out to us on .
After Devtron is installed, Devtron is accessible through service devtron-service. If you want to access devtron through ingress, edit devtron-service and change the loadbalancer to ClusterIP. You can do this using kubectl patch command like :
Optionally you also can access devtron through a specific host like :
After that create ingress by applying the ingress yaml file. You can use to create ingress to access devtron:
You can access devtron from any host after applying this yaml. For k8s versions <1.19, :
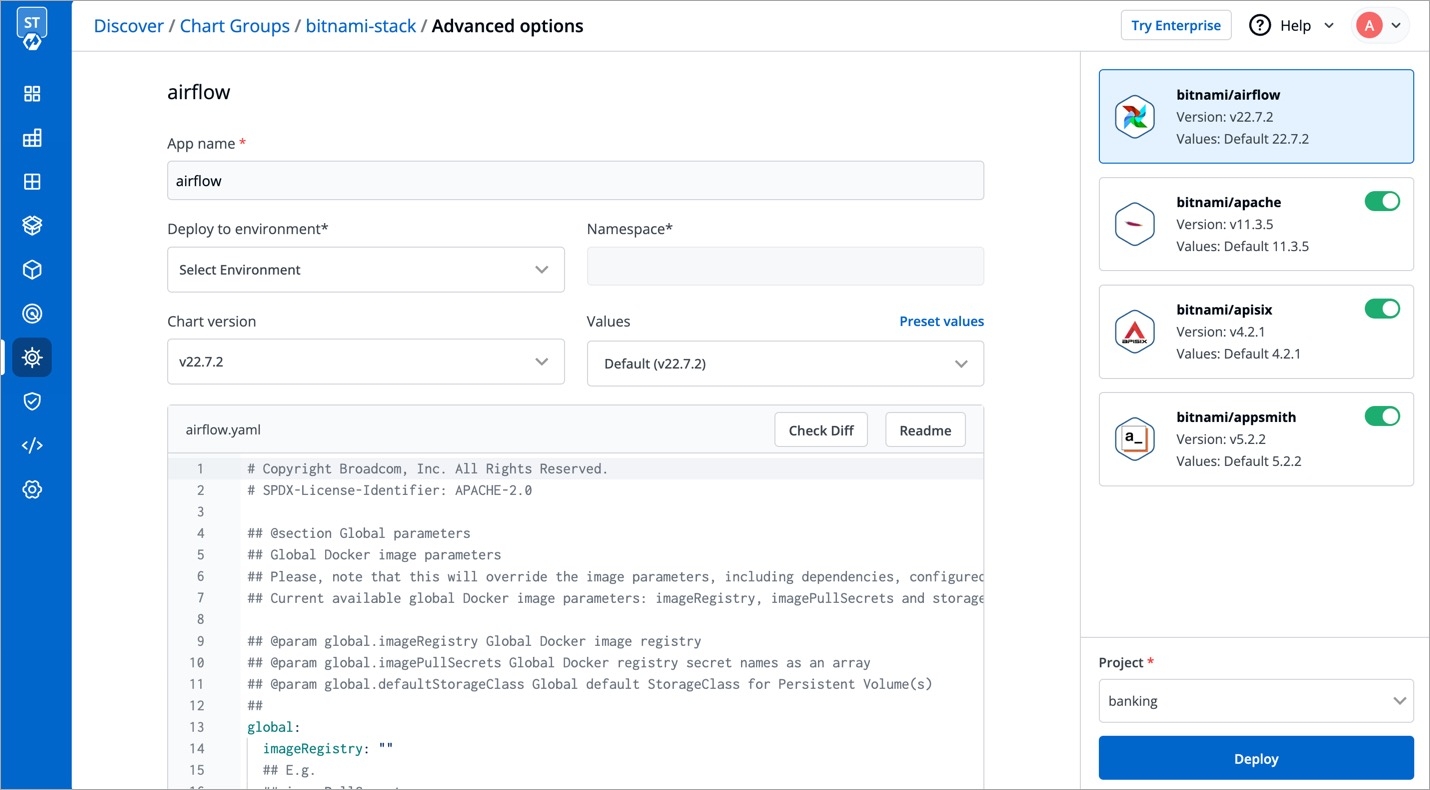
Devtron integrations extend the functionality of your Devtron stack.
Integrations can be installed by super admins; However other user roles can browse and request super admins to install the required integrations.
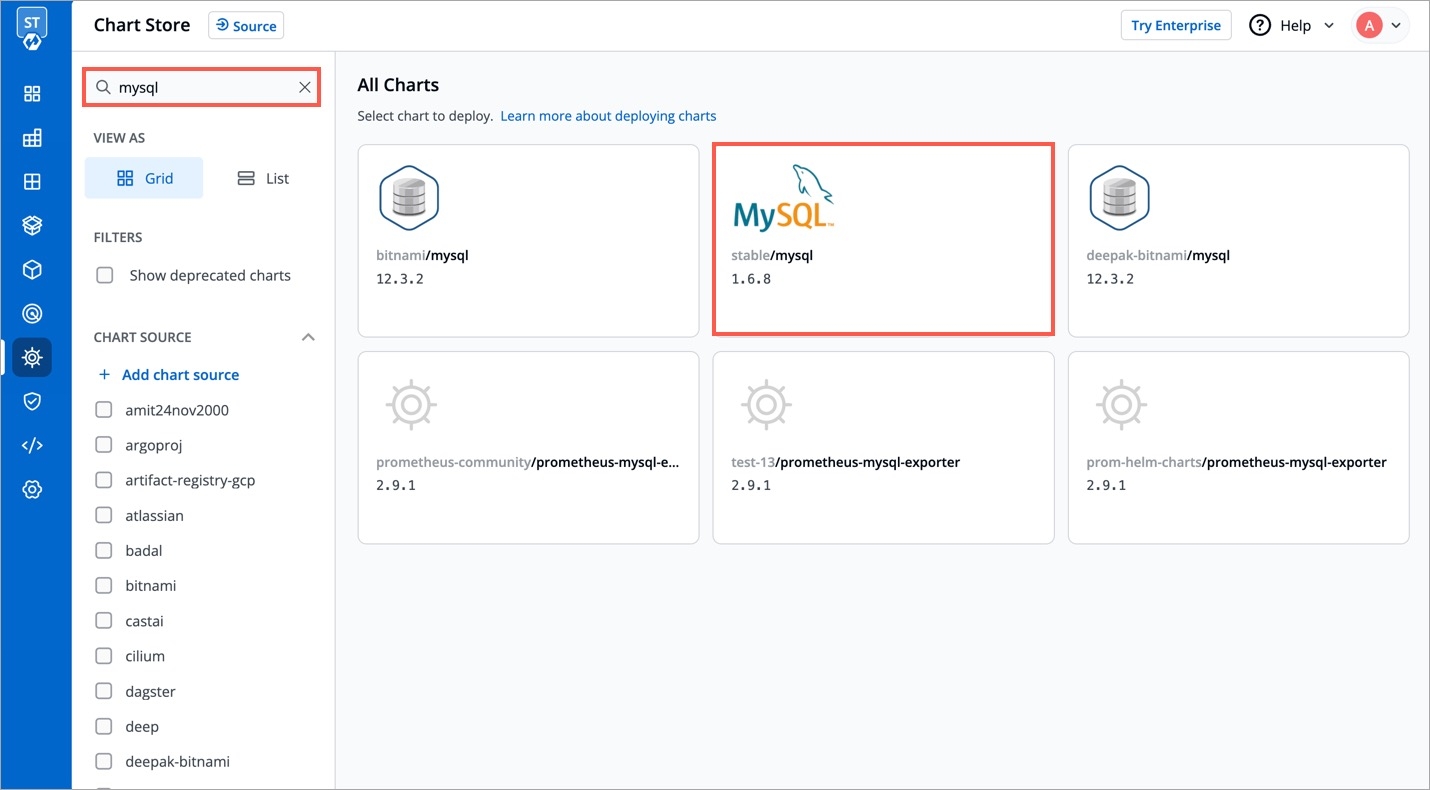
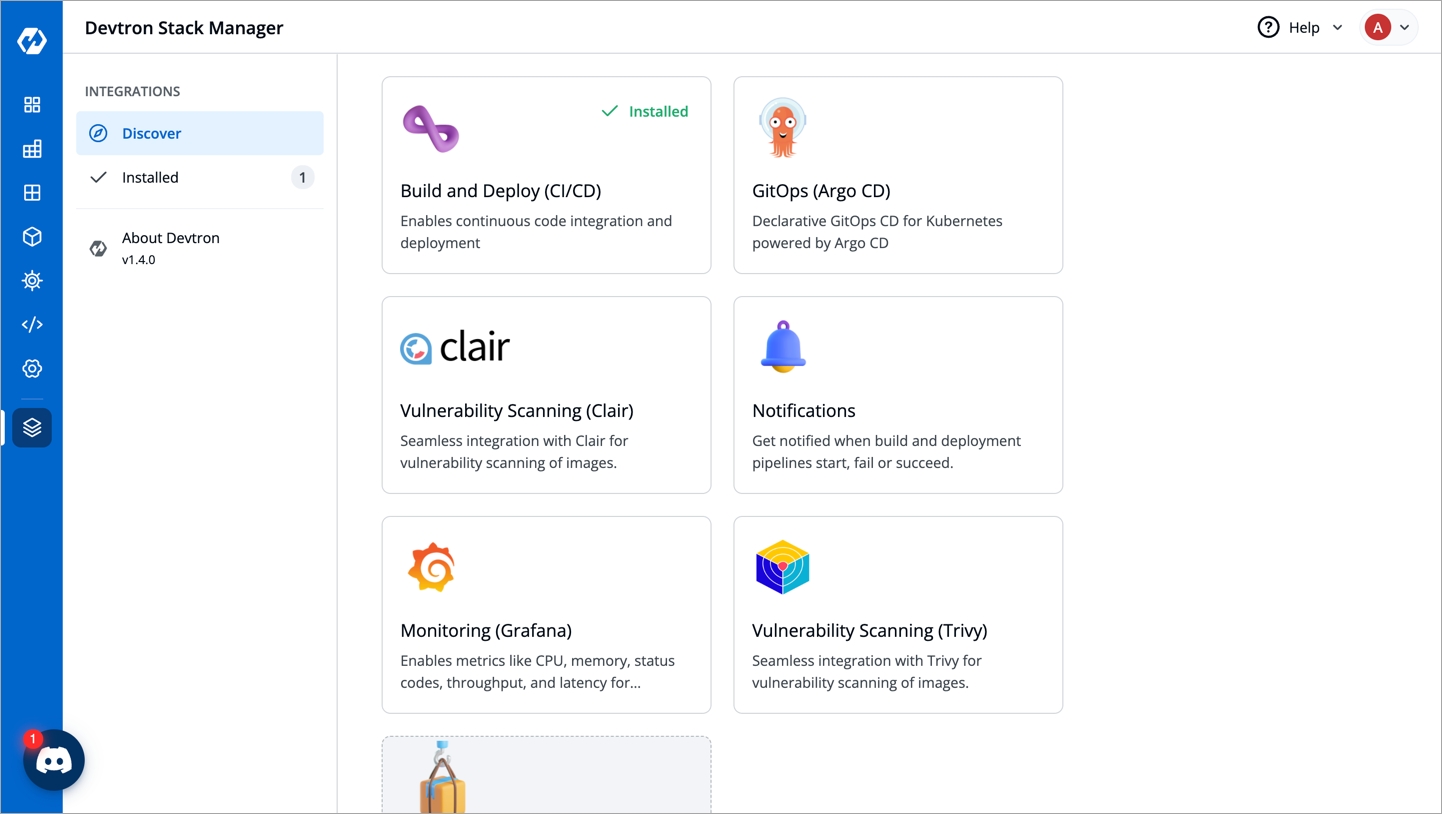
Select Devtron Stack Manager from the left navigation bar. Under INTEGRATIONS, select Discover.
Devtron CI/CD integration enables software development teams to automate the build and deployment process, allowing them to focus on meeting the business requirements, maintaining code quality, and ensuring security.
Features
Leverages Kubernetes auto-scaling and centralized caching to give you unlimited cost-efficient CI workers.
Supports pre-CI and post-CI integrations for code quality monitoring.
Seamlessly integrates with Clair for image vulnerability scanning.
Supports different deployment strategies: Blue/Green, Rolling, Canary, and Recreate.
Implements GitOps to manage the state of Kubernetes applications.
Integrates with ArgoCD for continuous deployment.
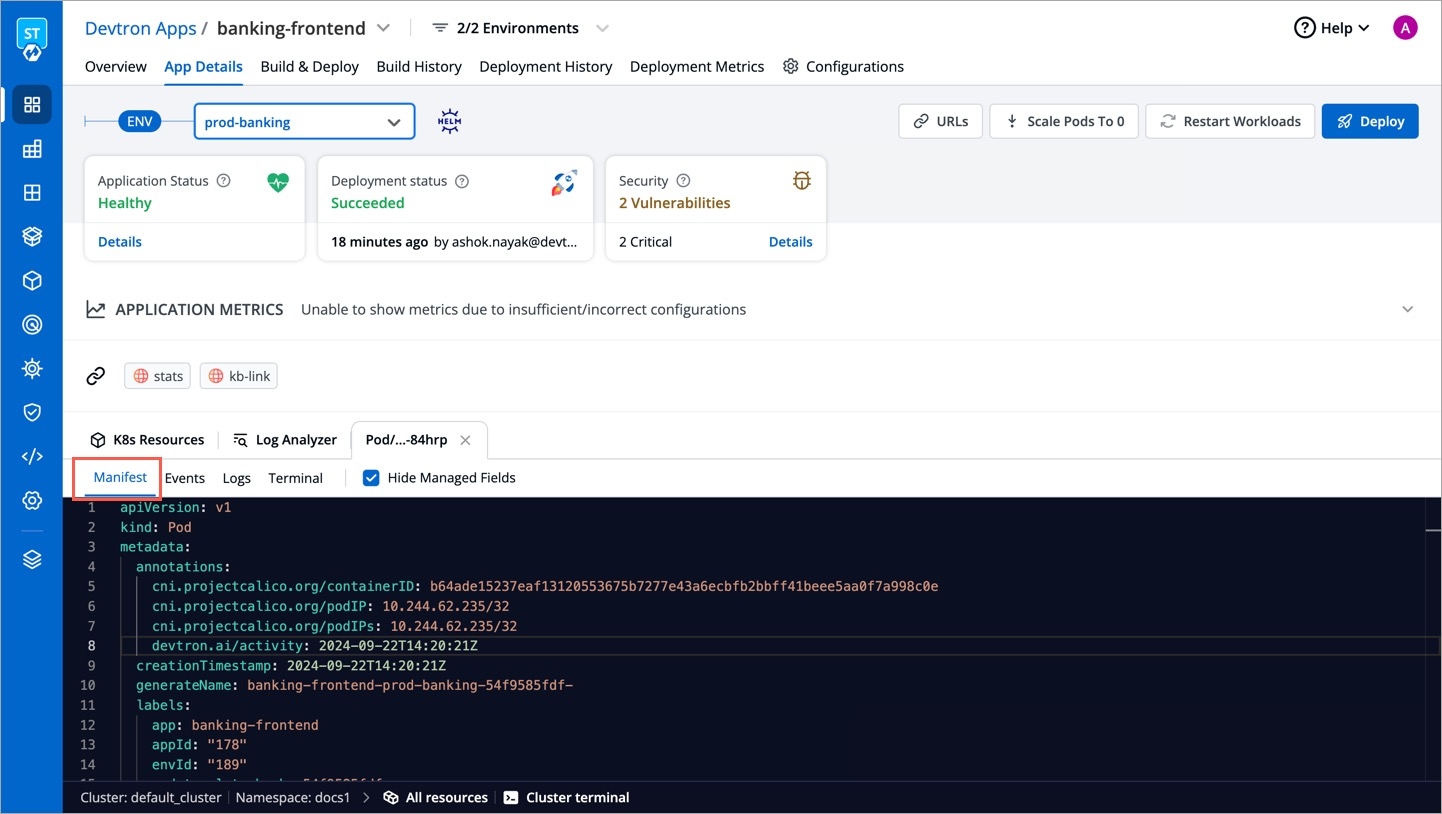
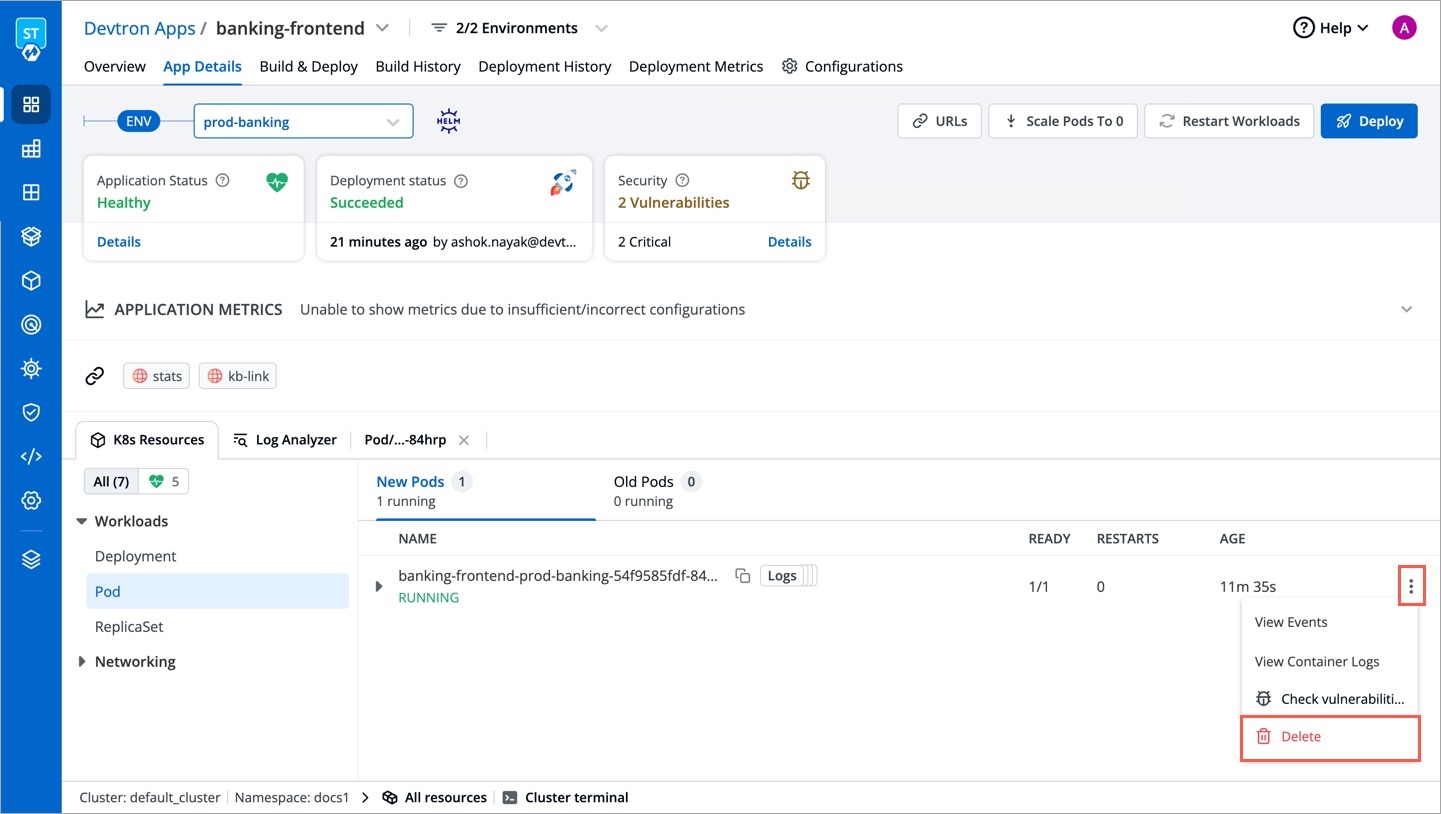
Check logs, events, and manifests or exec inside containers for debugging.
Provides deployment metrics like; deployment frequency, lead time, change failure rate, and mean-time recovery.
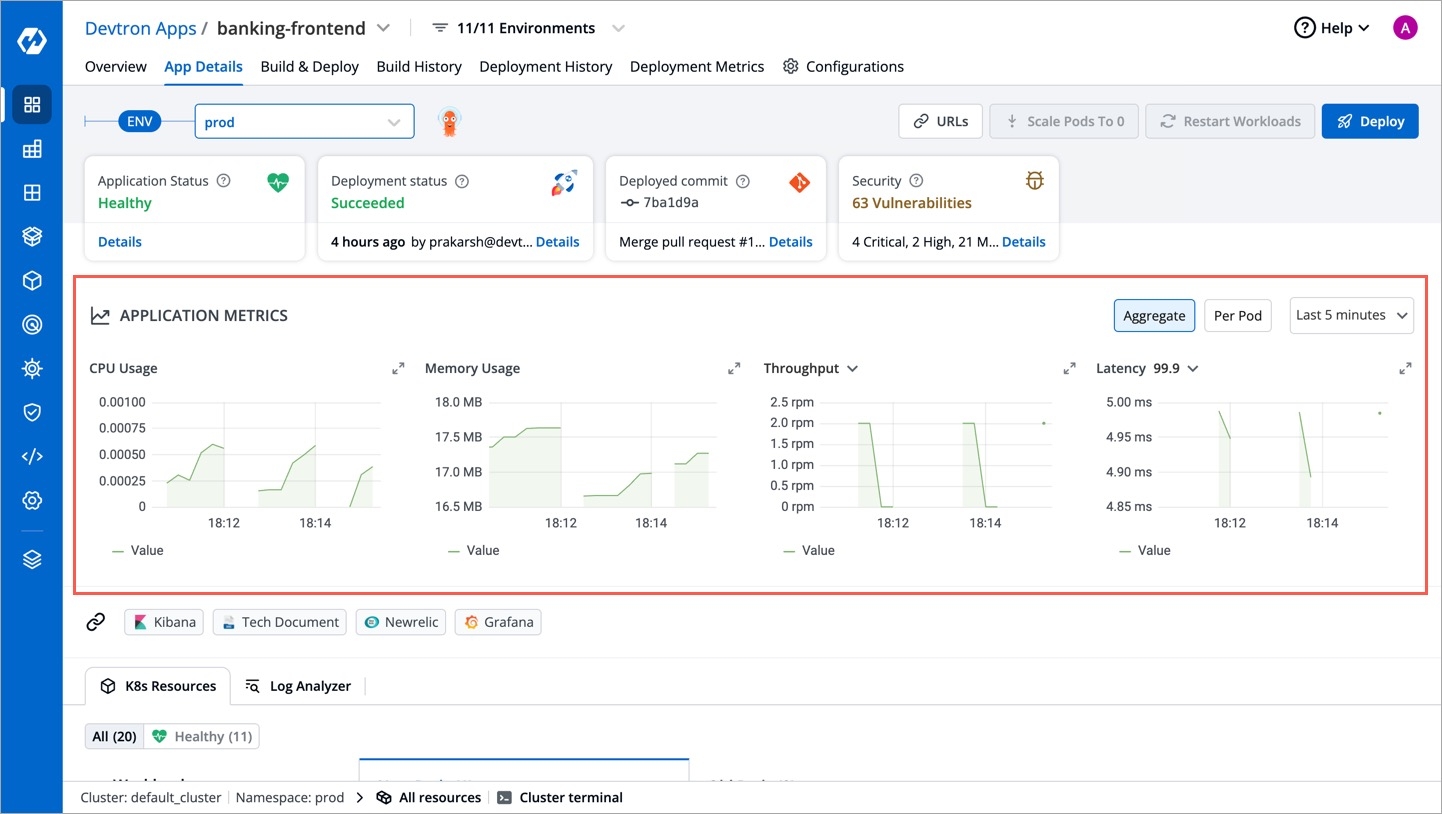
Seamless integration with Grafana for continuous application metrics like CPU and memory usage, status code, throughput, and latency on the dashboard.
On the Devtron Stack Manager > Discover page, select the Build and Deploy (CI/CD) integration.
On the Discover integrations/Build and Deploy (CI/CD) page, select Install.
The installation status may be one of the following:
Install
The integration is not yet installed.
Initializing
The installation is being initialized.
Installing
The installation is in progress. The logs are available to track the progress.
Failed
Installed
The integration is successfully installed and available on the Installed page.
Request timed out
A list of installed integrations can be viewed on the Devtron Stack Manager > Installed page.
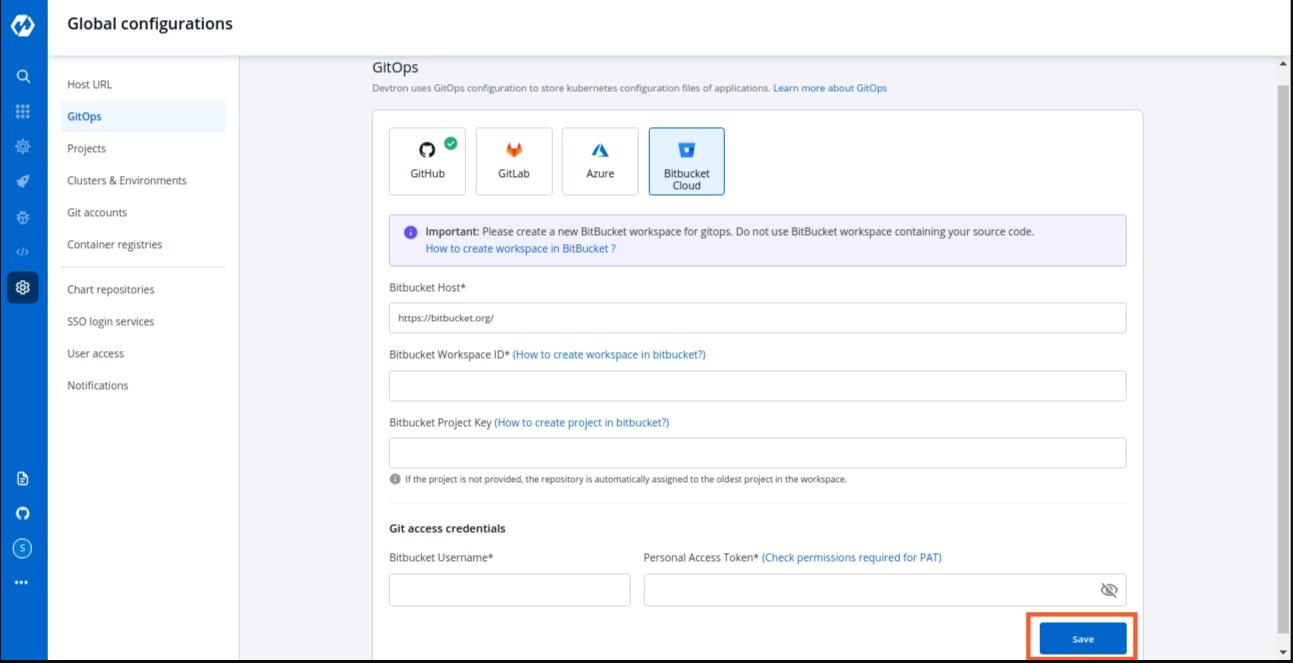
Devtron uses GitOps and stores configurations in git; Git Credentials can be entered at Global Configuration > GitOps which is used by Devtron for configuration management and storing desired state of the application configuration. In case GitOps is not configured, Devtron cannot deploy any application or charts.
Areas impacted by GitOps are:
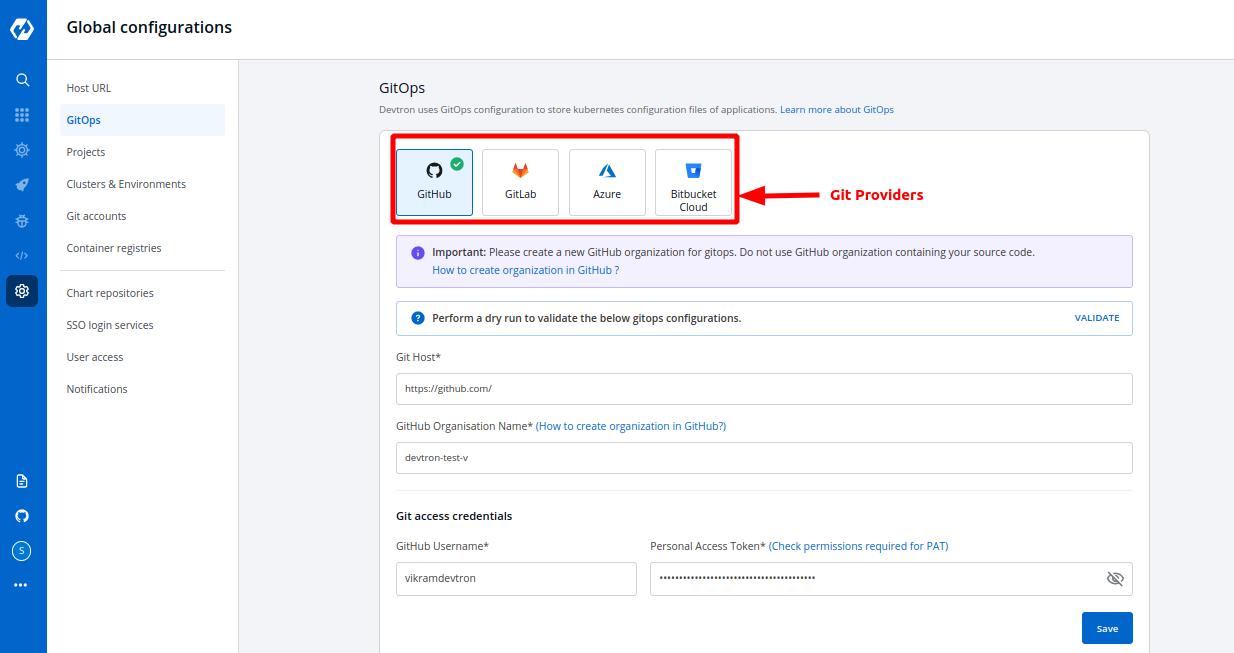
Select the GitOps section of global configuration. At the top of the section, four Git providers are available.
GitHub
GitLab
Azure
BitBucket Cloud
Select one of the Git providers. To add git account, You need to provide the following inputs as given below:
Git Host / Azure DevOps Organisation Url / BitBucket Host
GitHub Organization Name / Gitlab Group id / Azure DevOps Project Name / BitBucket Workspace ID
BitBucket Project Key (only for BitBucket Cloud)
Git access credential
This field is filled by default, Showing the URL of the selected git providers. For example- https://github.com for GitHub, https://gitlab.com for GitLab, https://dev.azure.com/ for Azure & https://bitbucket.org for BitBucket. Please replace them(not available for GitHub & BitBucket) if they are not the url you want to use.
Provide Git Username and Personal Access Token of your git account.
(a) Username Username for your git account.
(b) Personal Access Token A personal access token (PAT) is used as an alternate password to authenticate into your git accounts.
repo - Full control of private repositories(Access commit status , Access deployment status and Access public repositories).
admin:org - Full control of organizations and teams(Read and write access).
delete_repo - Grants delete repo access on private repositories.
api - Grants complete read/write access to the scoped project API.
write_repository - Allows read-write access (pull, push) to the repository.
repo - Full control of repositories (Read, Write, Admin, Delete access).
Click on Save to save your gitOps configuration details.
Note: A Green tick will appear on the active gitOps provider.
This documentation consists of the Global Configurations available in Devtron.
Parts of the Documentation
Devtron is installed over a Kubernetes cluster and can be installed standalone or along with CI/CD integration:
The minimum requirements for Devtron and Devtron with CI/CD integration in production and non-production environments include:
Non-production
Production (assumption based on 5 clusters)
The current release of Devtron supports the Build and Deploy (CI/CD) integration. More integrations will be available soon; to request one, please
Integrations are updated along with .
Although the integrations are installed separately, they cannot be upgraded separately. Integrations update happens automatically with .
Installation failed and the logs are available to troubleshoot. You could retry the installation or .
The request to install has hit the maximum number of retries. You may retry the installation or for further assistance.
To update an installed integration, please .
Deployment Template, to learn more.
Charts, to learn more.
In the case of GitHub provide Github Organization Name*. Learn more about .
In the case of Gitlab provide Gitlab group Id*. Learn more about .
Similarly in the case of Azure provide Azure DevOps Project Name*. Learn more about .
For Bitbucket Cloud, provide Bitbucket Workspace Id*. Learn more about .
This field is non-mandatory and is only to be filled when you have chosen Bitbucket Cloud as your git provider. If not provided, the oldest project in the workspace will be used. Learn more about .
code - Grants the ability to read source code and metadata about commits, change sets, branches, and other version control artifacts. .
: Devtron installation with the CI/CD integration is used to perform CI/CD, security scanning, GitOps, debugging, and observability.
: The Devtron installation includes functionalities to deploy, observe, manage, and debug existing Helm applications in multiple clusters and deeply integrate with multiple tools using extensions.
Refer to the section for more information.
Create a (preferably K8s 1.16 or higher) if you haven't done that already!
Refer to the article to set up a cluster in the production environment.
Devtron with CI/CD
2
6 GB
Devtron
1
1 GB
Devtron with CI/CD
6
13 GB
Devtron
2
3 GB
Container registries are used to store images built by the CI Pipeline. Here you can configure the container registry you want to use for storing images.
Go to the Container Registry section of Global Configuration. Click on Add container registry.
You will see below the input fields to configure the container registry.
Name
Registry type
ecr
AWS region
Access key ID
Secret access key
docker hub
Username
Password
Others
Username
password
Registry URL
Set as default
Provide a name to your registry, this name will be shown to you in Docker Build Config as a drop-down.
Here you can select the type of the Registry. We are supporting three types- docker hub, ecr and others. You can select any one of them from the drop-down. By default, this value is ecr. If you select ecr then you have to provide some information like- AWS region, Access Key, and Secret Key. If you select docker hub then you have to provide Username and Password. And if you select others then you have to provide the Username and Password.
Select any type of Registry from the drop-down, you have to provide the URL of your registry. Create your registry and provide the URL of that registry in the URL box.
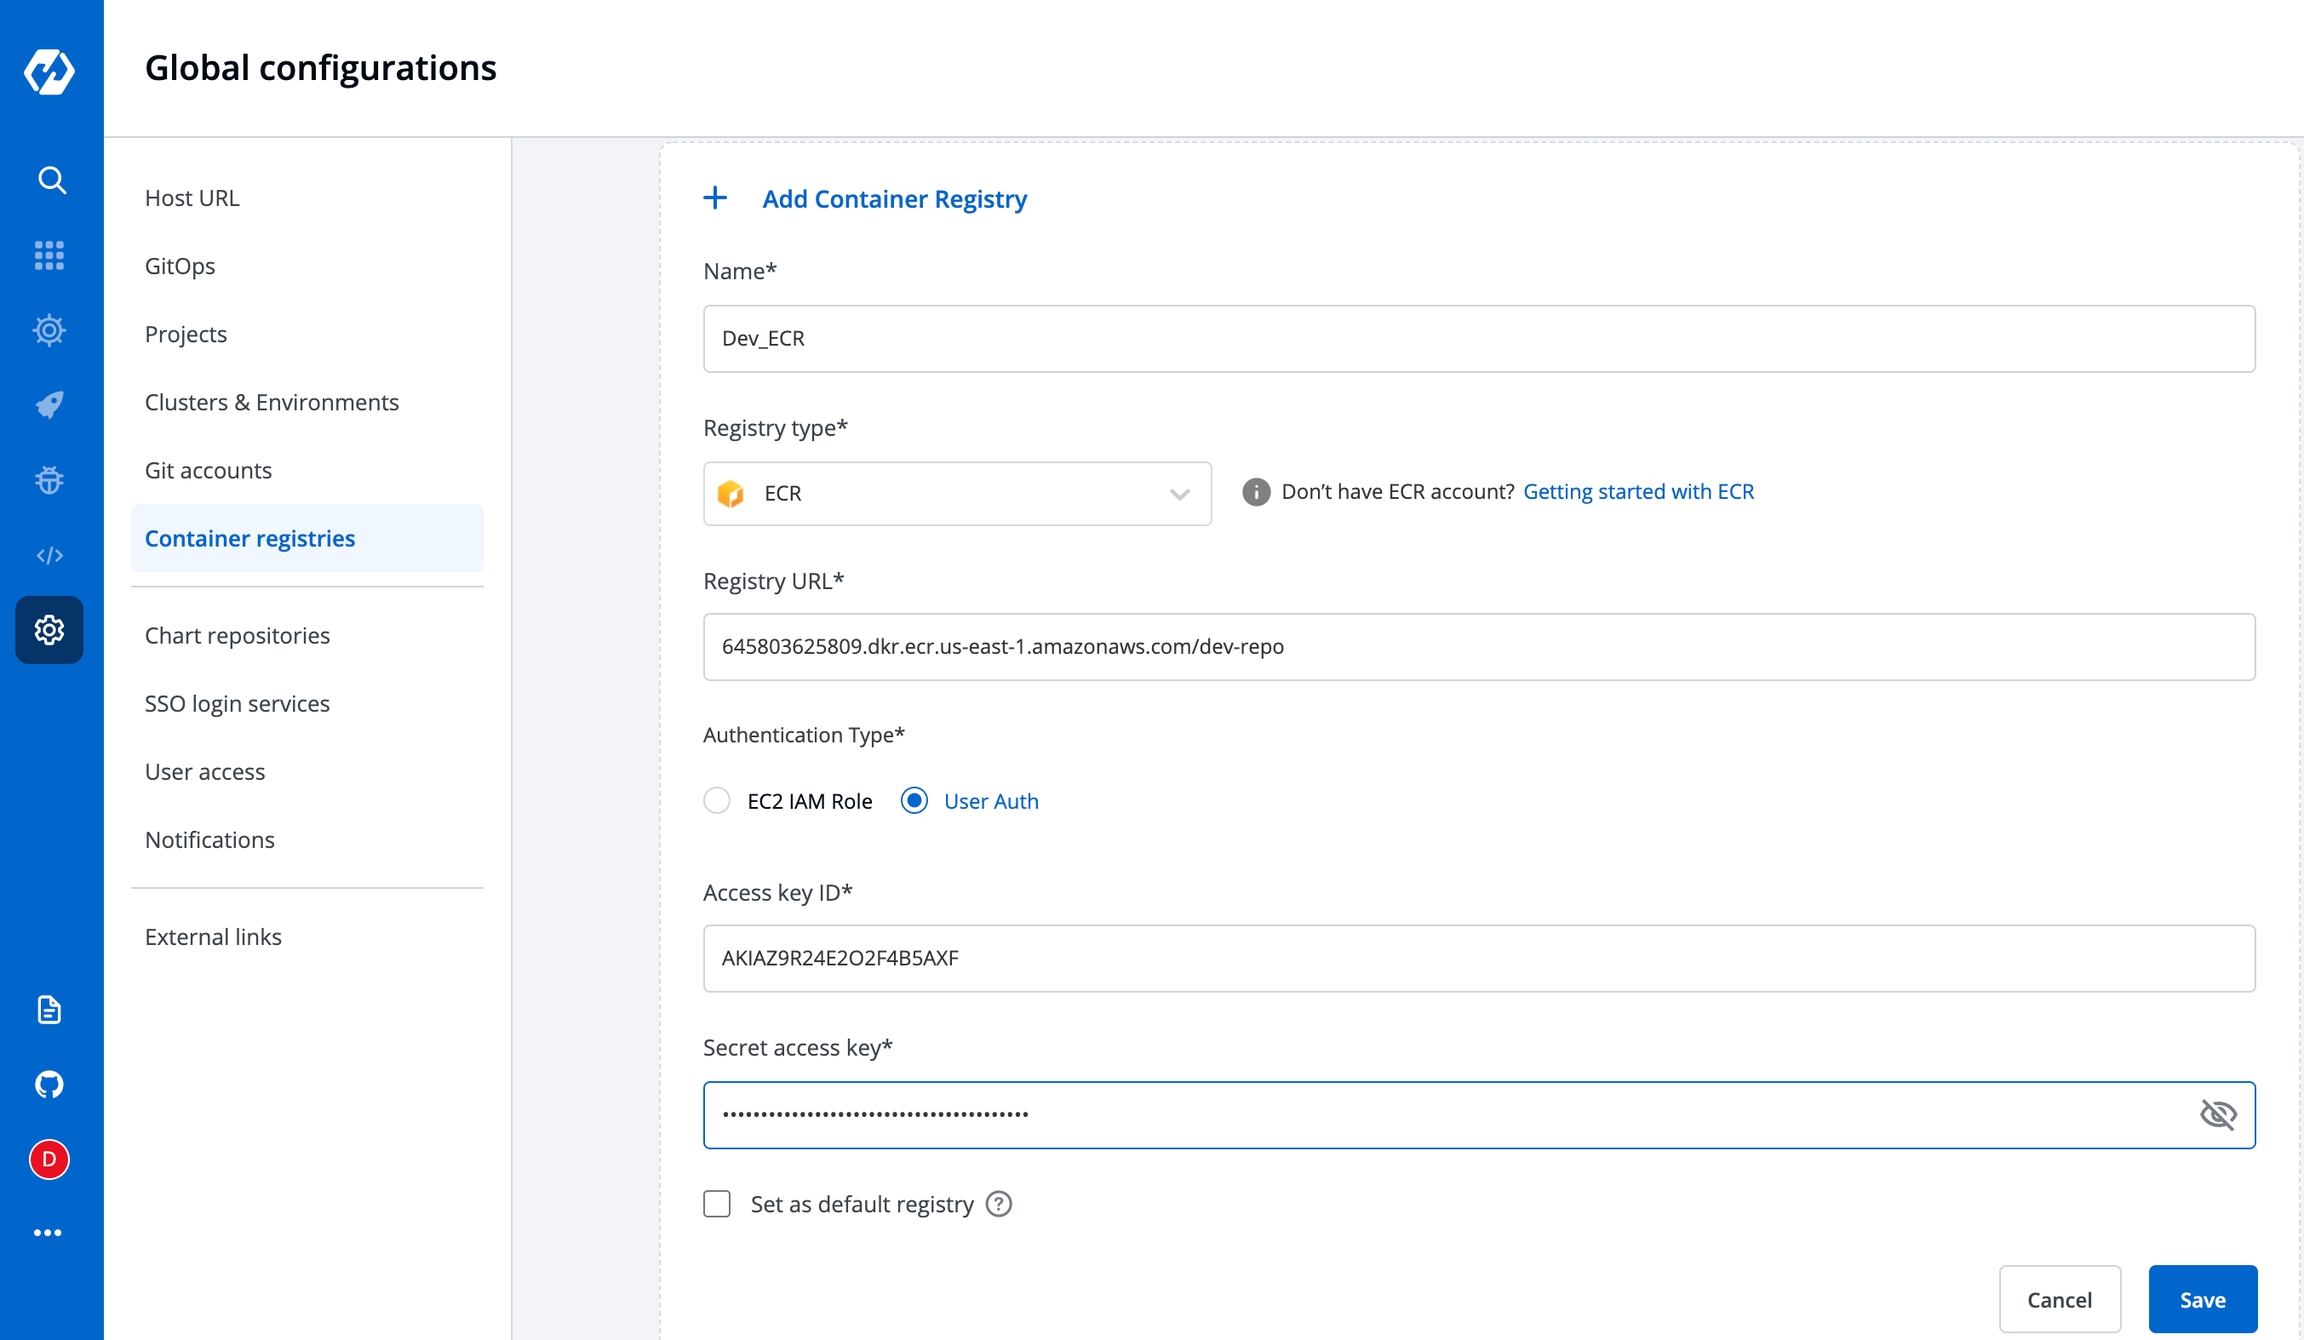
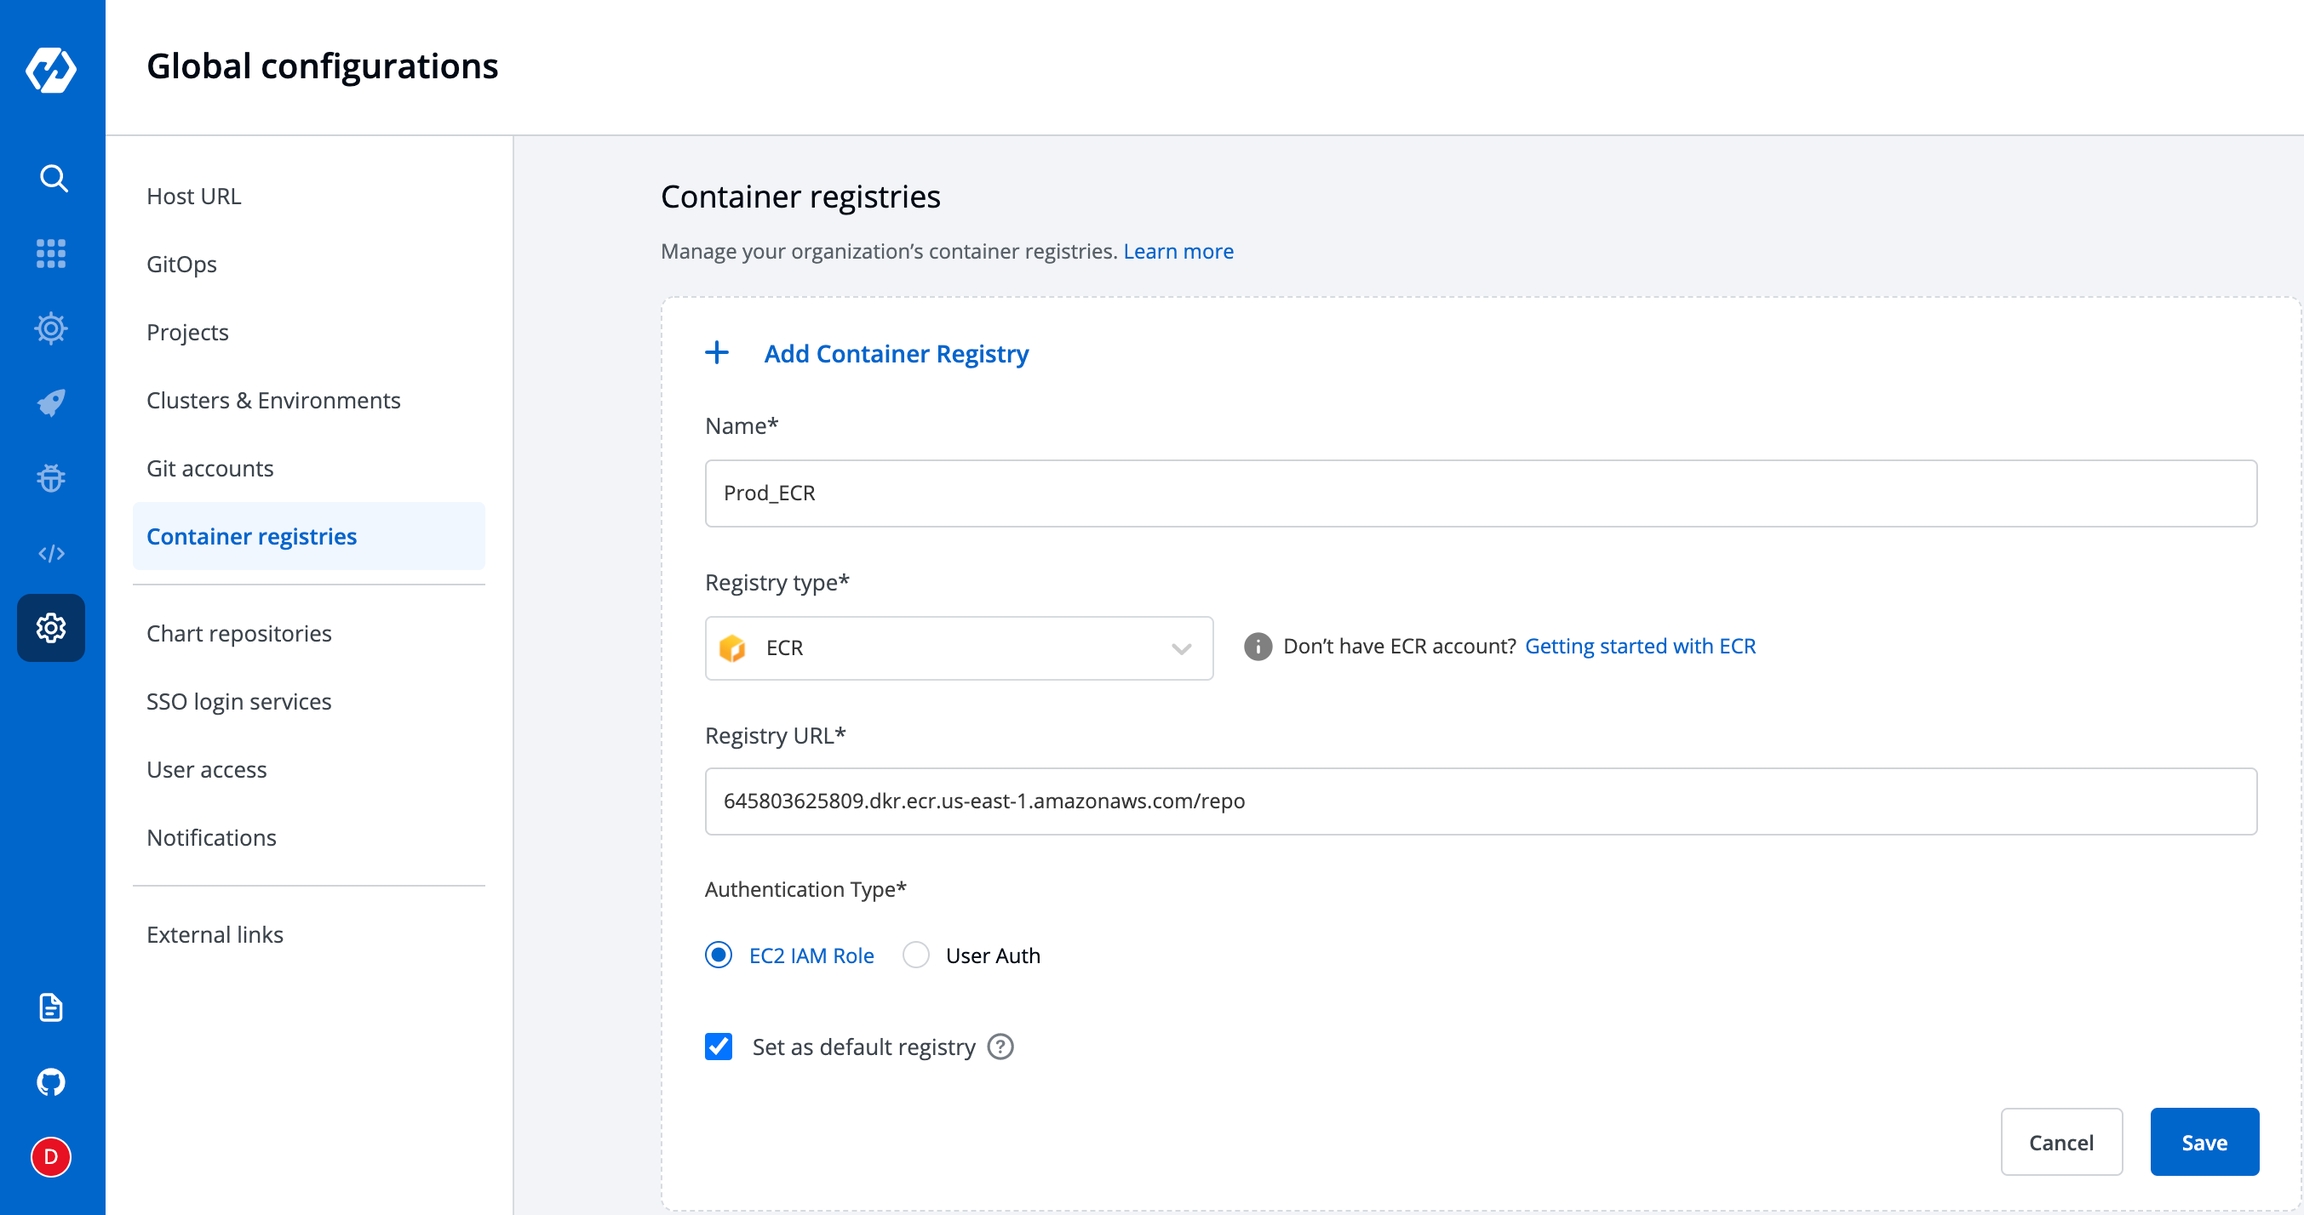
To add an Amazon Elastic Container Registry (ECR), select the ECR Registry type. Amazon ECR is an AWS-managed container image registry service. The ECR provides resource-based permissions to the private repositories using AWS Identity and Access Management (IAM). ECR allows both Key-based and Role-based authentications.
Name
User-defined name for the registry in Devtron
Registry Type
Select ECR
Registry URL
This is the URL of your private registry in AWS.
For example, the URL format is: https://xxxxxxxxxxxx.dkr.ecr.<region>.amazonaws.com.
xxxxxxxxxxxx is your 12-digit AWS account Id.
Authentication Type
* EC2 IAM role: Authenticate with workernode IAM role. * User Auth: Authenticate with an authorization token - Access key ID: Your AWS access key - Secret access key: Your AWS secret access key ID
To set this ECR as the default registry hub for your images, select [x] Set as default registry.
Select Save.
You have to provide the below information if you select the registry type as Docker Hub.
Username
Give the username of the docker hub account you used for creating your registry in.
Password
You have to provide the below information if you select the registry type as others.
Username
Give the username of your account, where you have created your registry in.
Password
Give the password corresponding to the username of your registry.
If you enable the Set as default option, then this registry name will be set as default in the Container Registry section inside the Docker build config page. This is optional. You can keep it disabled.
If you enable the Allow Only Secure Connection option, then this registry allows only secure connections.
If you enable the Allow Secure Connection With CA Certificate option, then you have to upload/provide private CA certificate (ca.crt).
If the container registry is insecure (for eg : SSL certificate is expired), then you enable the Allow Insecure Connection option.
Now click on Save to save the configuration of the Container registry.
You can use any registry which can be authenticated using docker login -u <username> -p <password> <registry-url>. However these registries might provide a more secured way for authentication, which we will support later. Some popular registries which can be used using username and password mechanism:
If you want to use a private registry for container registry other than ecr, this will be used to push image and then create a secret in same environment to pull the image to deploy. To create secret, go to charts section and search for chart ‘dt-secrets’ and configure the chart. Provide an App Name and select the Project and Environment in which you want to deploy this chart and then configure the values.yaml as shown in example. The given example is for DockerHub but you can configure similarly for any container registry that you want to use.
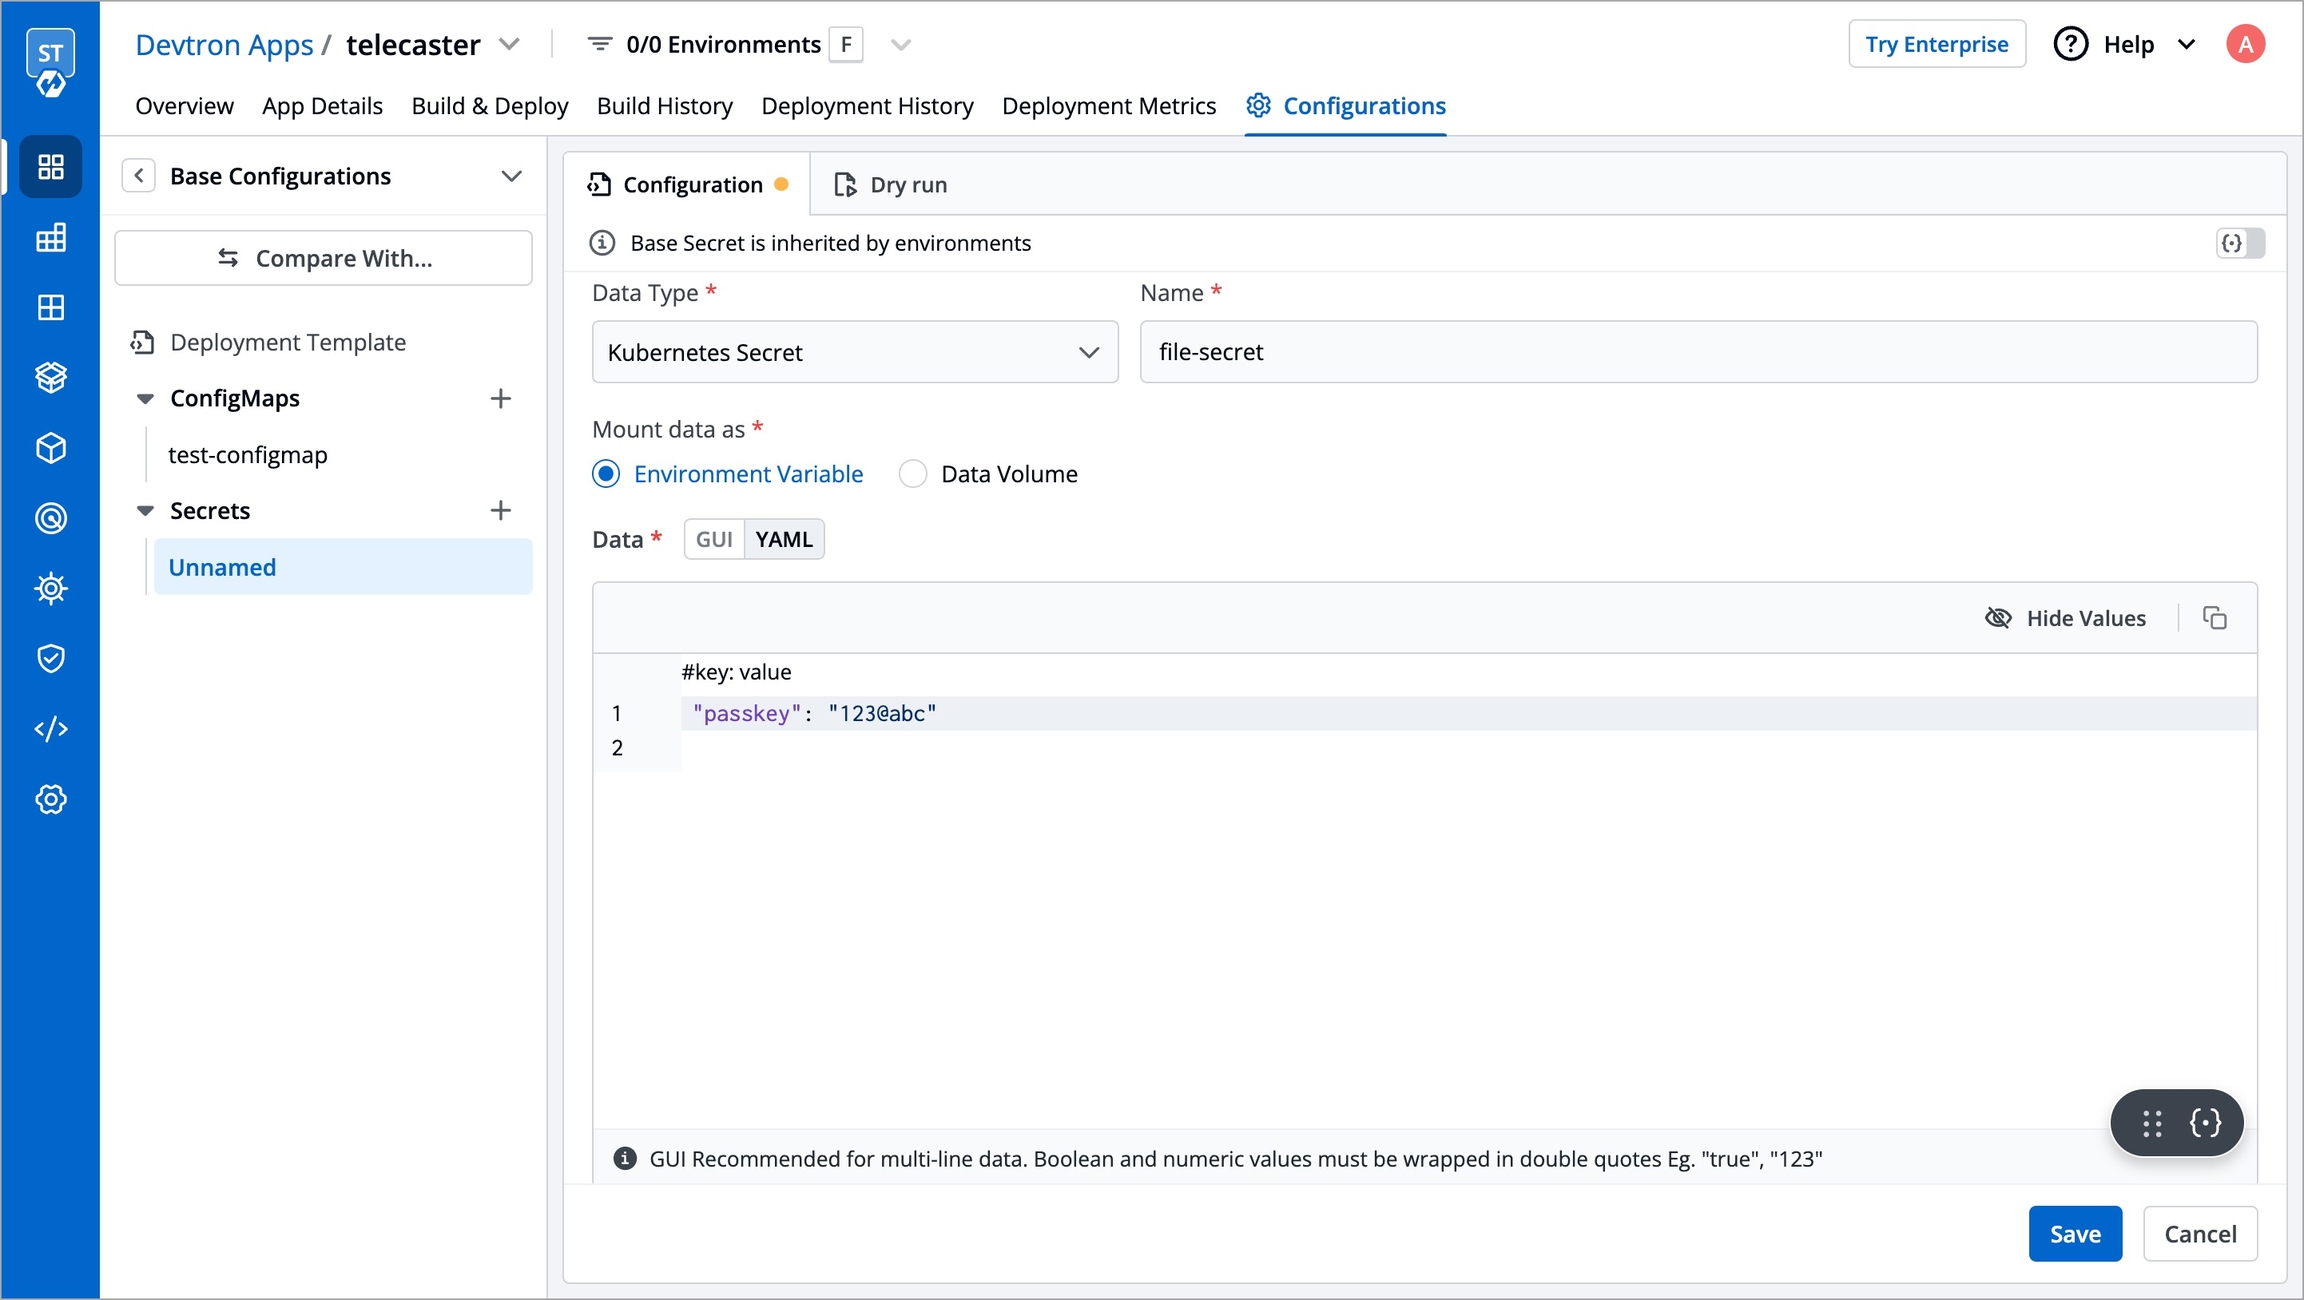
Configure Secrets
For helm installation this section referes to secrets.env section of values.yaml. For kubectl based installation it refers to kind: secret in install/devtron-operator-configs.yaml.
Configure the following properties:
POSTGRESQL_PASSWORD
Using this parameter the auto-generated password for Postgres can be edited as per requirement(Used by Devtron to store the app information)
WEBHOOK_TOKEN
If you want to continue using Jenkins for CI then provide this for authentication of requests should be base64 encoded
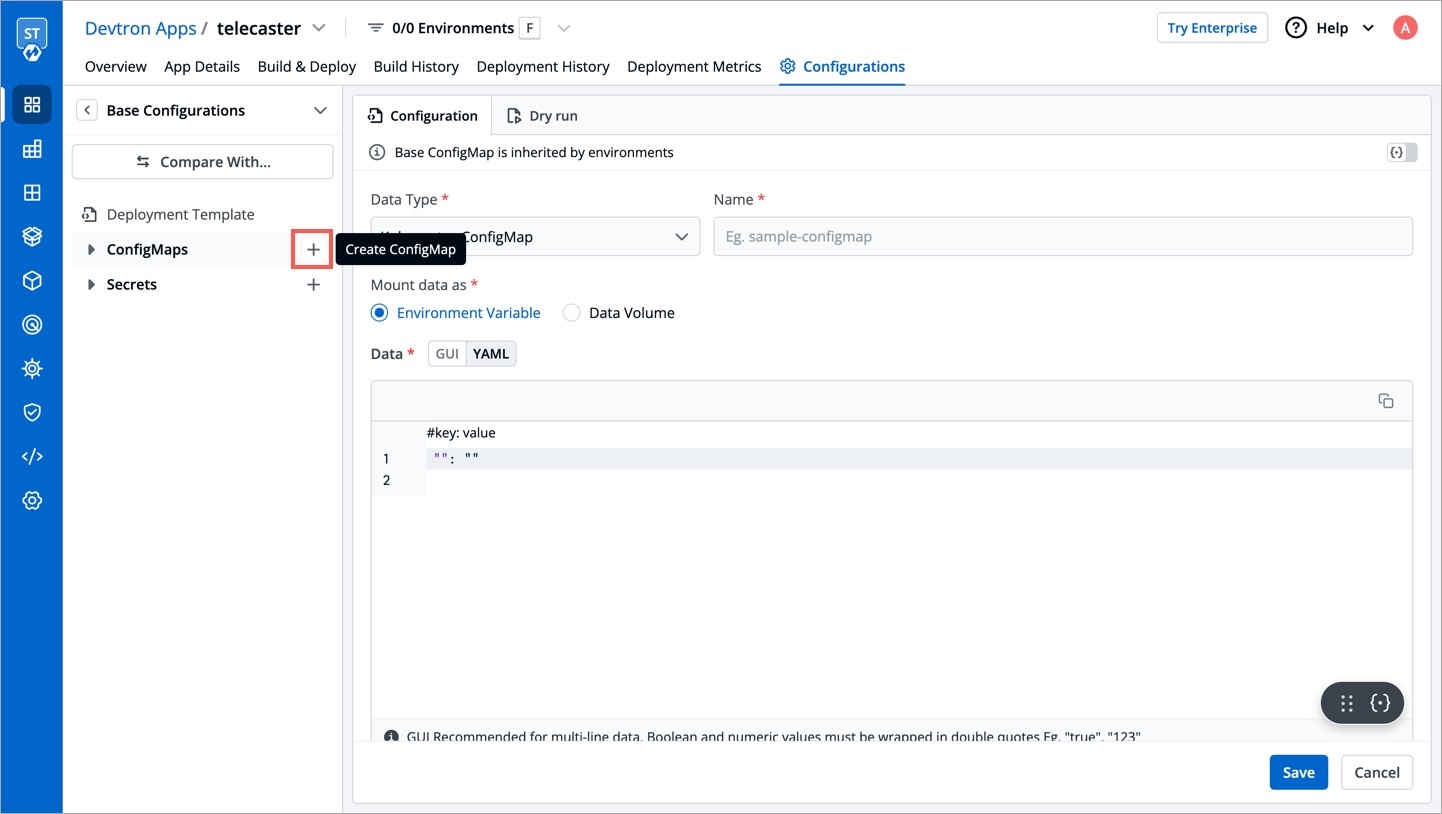
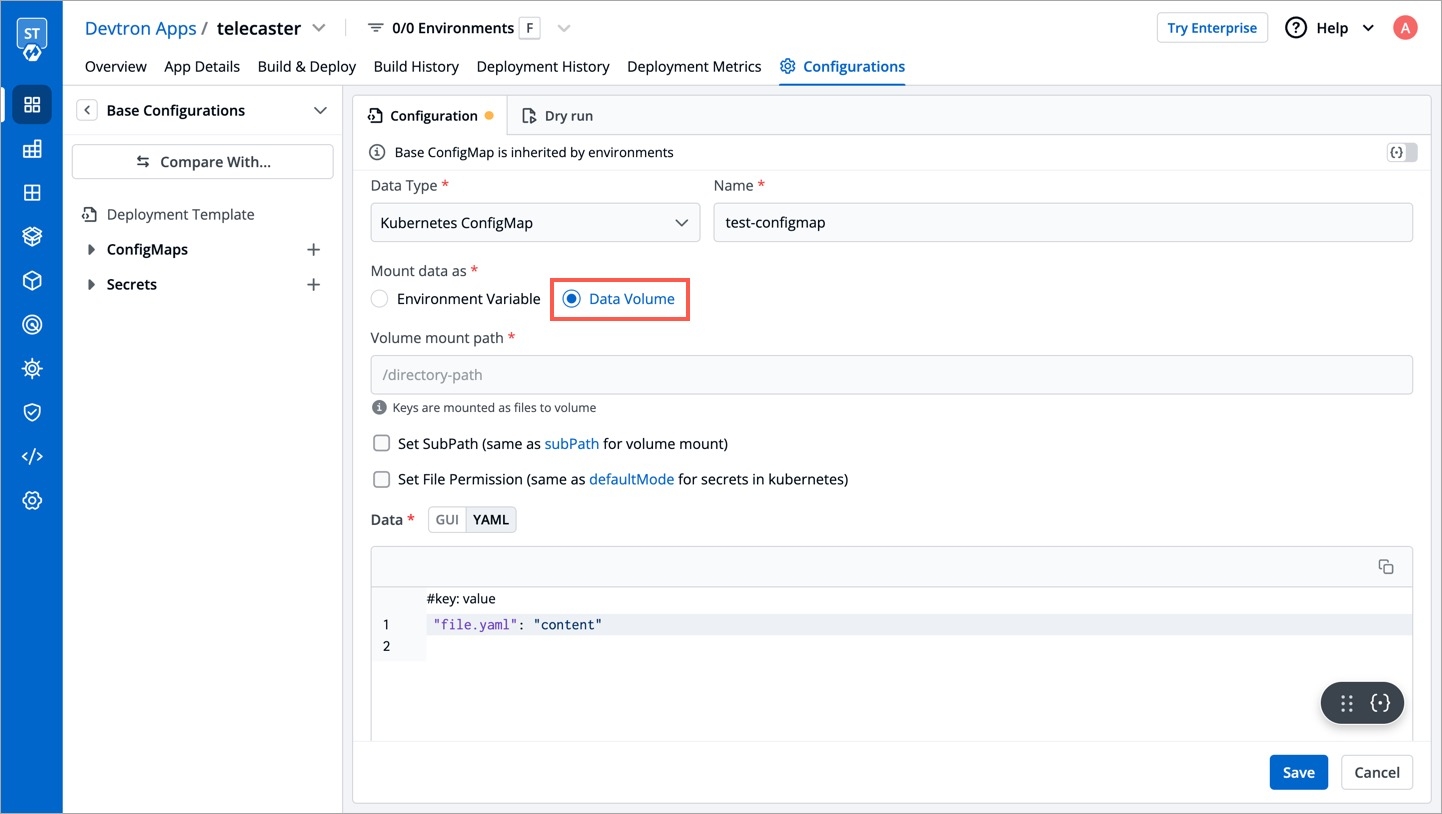
Configure ConfigMaps
For helm installation this section refers to configs section of values.yaml. For kubectl based installation it refers to kind: ConfigMap in install/devtron-operator-configs.yaml.
Configure the following properties:
BASE_URL_SCHEME
Either of HTTP or HTTPS (required)
HTTP
BASE_URL
URL without scheme and trailing slash, this is the domain pointing to the cluster on which the Devtron platform is being installed. For example, if you have directed domain devtron.example.com to the cluster and the ingress controller is listening on port 32080 then URL will be devtron.example.com:32080 (required)
change-me
DEX_CONFIG
EXTERNAL_SECRET_AMAZON_REGION
AWS region for the secret manager to pick (required)
PROMETHEUS_URL
URL of Prometheus where all cluster data is stored; if this is wrong, you will not be able to see application metrics like CPU, RAM, HTTP status code, latency, and throughput (required)
While installing Devtron and using the AWS-S3 bucket for storing the logs and caches, the below parameters are to be used in the ConfigMap.
NOTE: For using the S3 bucket it is important to add the S3 permission policy to the IAM role attached to the nodes of the cluster.
DEFAULT_CACHE_BUCKET
AWS bucket to store docker cache, it should be created beforehand (required)
DEFAULT_BUILD_LOGS_BUCKET
AWS bucket to store build logs, it should be created beforehand (required)
DEFAULT_CACHE_BUCKET_REGION
AWS region of S3 bucket to store cache (required)
DEFAULT_CD_LOGS_BUCKET_REGION
AWS region of S3 bucket to store CD logs (required)
While installing Devtron using Azure Blob Storage for storing logs and caches, the below parameters will be used in the ConfigMap.
AZURE_ACCOUNT_NAME
Account name for AZURE Blob Storage
AZURE_BLOB_CONTAINER_CI_LOG
AZURE Blob storage container for storing ci-logs after running the CI pipeline
AZURE_BLOB_CONTAINER_CI_CACHE
AZURE Blob storage container for storing ci cache after running the CI pipeline
To convert string to base64 use the following command:
Note:
Ensure that the cluster has read and write access to the S3 buckets/Azure Blob storage container mentioned in DEFAULT_CACHE_BUCKET, DEFAULT_BUILD_LOGS_BUCKET or AZURE_BLOB_CONTAINER_CI_LOG, or AZURE_BLOB_CONTAINER_CI_CACHE.
Ensure that the cluster has read access to AWS secrets backends (SSM & secrets manager).
We can use the --set flag to override the default values when installing with Helm. For example, to update POSTGRESQL_PASSWORD and BLOB_STORAGE_PROVIDER, use the install command as:
ACD_PASSWORD
ArgoCD Password for CD Workflow
Auto-Generated
Optional
AZURE_ACCOUNT_KEY
Account key to access Azure objects such as BLOB_CONTAINER_CI_LOG or CI_CACHE
""
Mandatory (If using Azure)
GRAFANA_PASSWORD
Password for Grafana to display graphs
Auto-Generated
Optional
POSTGRESQL_PASSWORD
Password for your Postgresql database that will be used to access the database
Auto-Generated
Optional
AZURE_ACCOUNT_NAME
Azure account name which you will use
""
Mandatory (If using Azure)
AZURE_BLOB_CONTAINER_CI_LOG
Name of container created for storing CI_LOG
ci-log-container
Optional
AZURE_BLOB_CONTAINER_CI_CACHE
Name of container created for storing CI_CACHE
ci-cache-container
Optional
BLOB_STORAGE_PROVIDER
Cloud provider name which you will use
MINIO
Mandatory (If using any cloud other than MINIO), MINIO/AZURE/S3
DEFAULT_BUILD_LOGS_BUCKET
S3 Bucket name used for storing Build Logs
devtron-ci-log
Mandatory (If using AWS)
DEFAULT_CD_LOGS_BUCKET_REGION
Region of S3 Bucket where CD Logs are being stored
us-east-1
Mandatory (If using AWS)
DEFAULT_CACHE_BUCKET
S3 Bucket name used for storing CACHE (Do not include s3://)
devtron-ci-cache
Mandatory (If using AWS)
DEFAULT_CACHE_BUCKET_REGION
S3 Bucket region where Cache is being stored
us-east-1
Mandatory (If using AWS)
EXTERNAL_SECRET_AMAZON_REGION
Region where the cluster is setup for Devtron installation
""
Mandatory (If using AWS)
ENABLE_INGRESS
To enable Ingress (True/False)
False
Optional
INGRESS_ANNOTATIONS
Annotations for ingress
""
Optional
PROMETHEUS_URL
Existing Prometheus URL if it is installed
""
Optional
CI_NODE_LABEL_SELECTOR
Label of CI worker node
""
Optional
CI_NODE_TAINTS_KEY
Taint key name of CI worker node
""
Optional
CI_NODE_TAINTS_VALUE
Value of taint key of CI node
""
Optional
CI_DEFAULT_ADDRESS_POOL_BASE_CIDR
CIDR ranges used to allocate subnets in each IP address pool for CI
""
Optional
CI_DEFAULT_ADDRESS_POOL_SIZE
The subnet size to allocate from the base pool for CI
""
Optional
CD_NODE_LABEL_SELECTOR
Label of CD node
kubernetes.io/os=linux
Optional
CD_NODE_TAINTS_KEY
Taint key name of CD node
dedicated
Optional
CD_NODE_TAINTS_VALUE
Value of taint key of CD node
ci
Optional
CD_LIMIT_CI_CPU
CPU limit for pre and post CD Pod
0.5
Optional
CD_LIMIT_CI_MEM
Memory limit for pre and post CD Pod
3G
Optional
CD_REQ_CI_CPU
CPU request for CI Pod
0.5
Optional
CD_REQ_CI_MEM
Memory request for CI Pod
1G
Optional
CD_DEFAULT_ADDRESS_POOL_BASE_CIDR
CIDR ranges used to allocate subnets in each IP address pool for CD
""
Optional
CD_DEFAULT_ADDRESS_POOL_SIZE
The subnet size to allocate from the base pool for CD
""
Optional
GITOPS_REPO_PREFIX
Prefix for Gitops repository
devtron
Optional
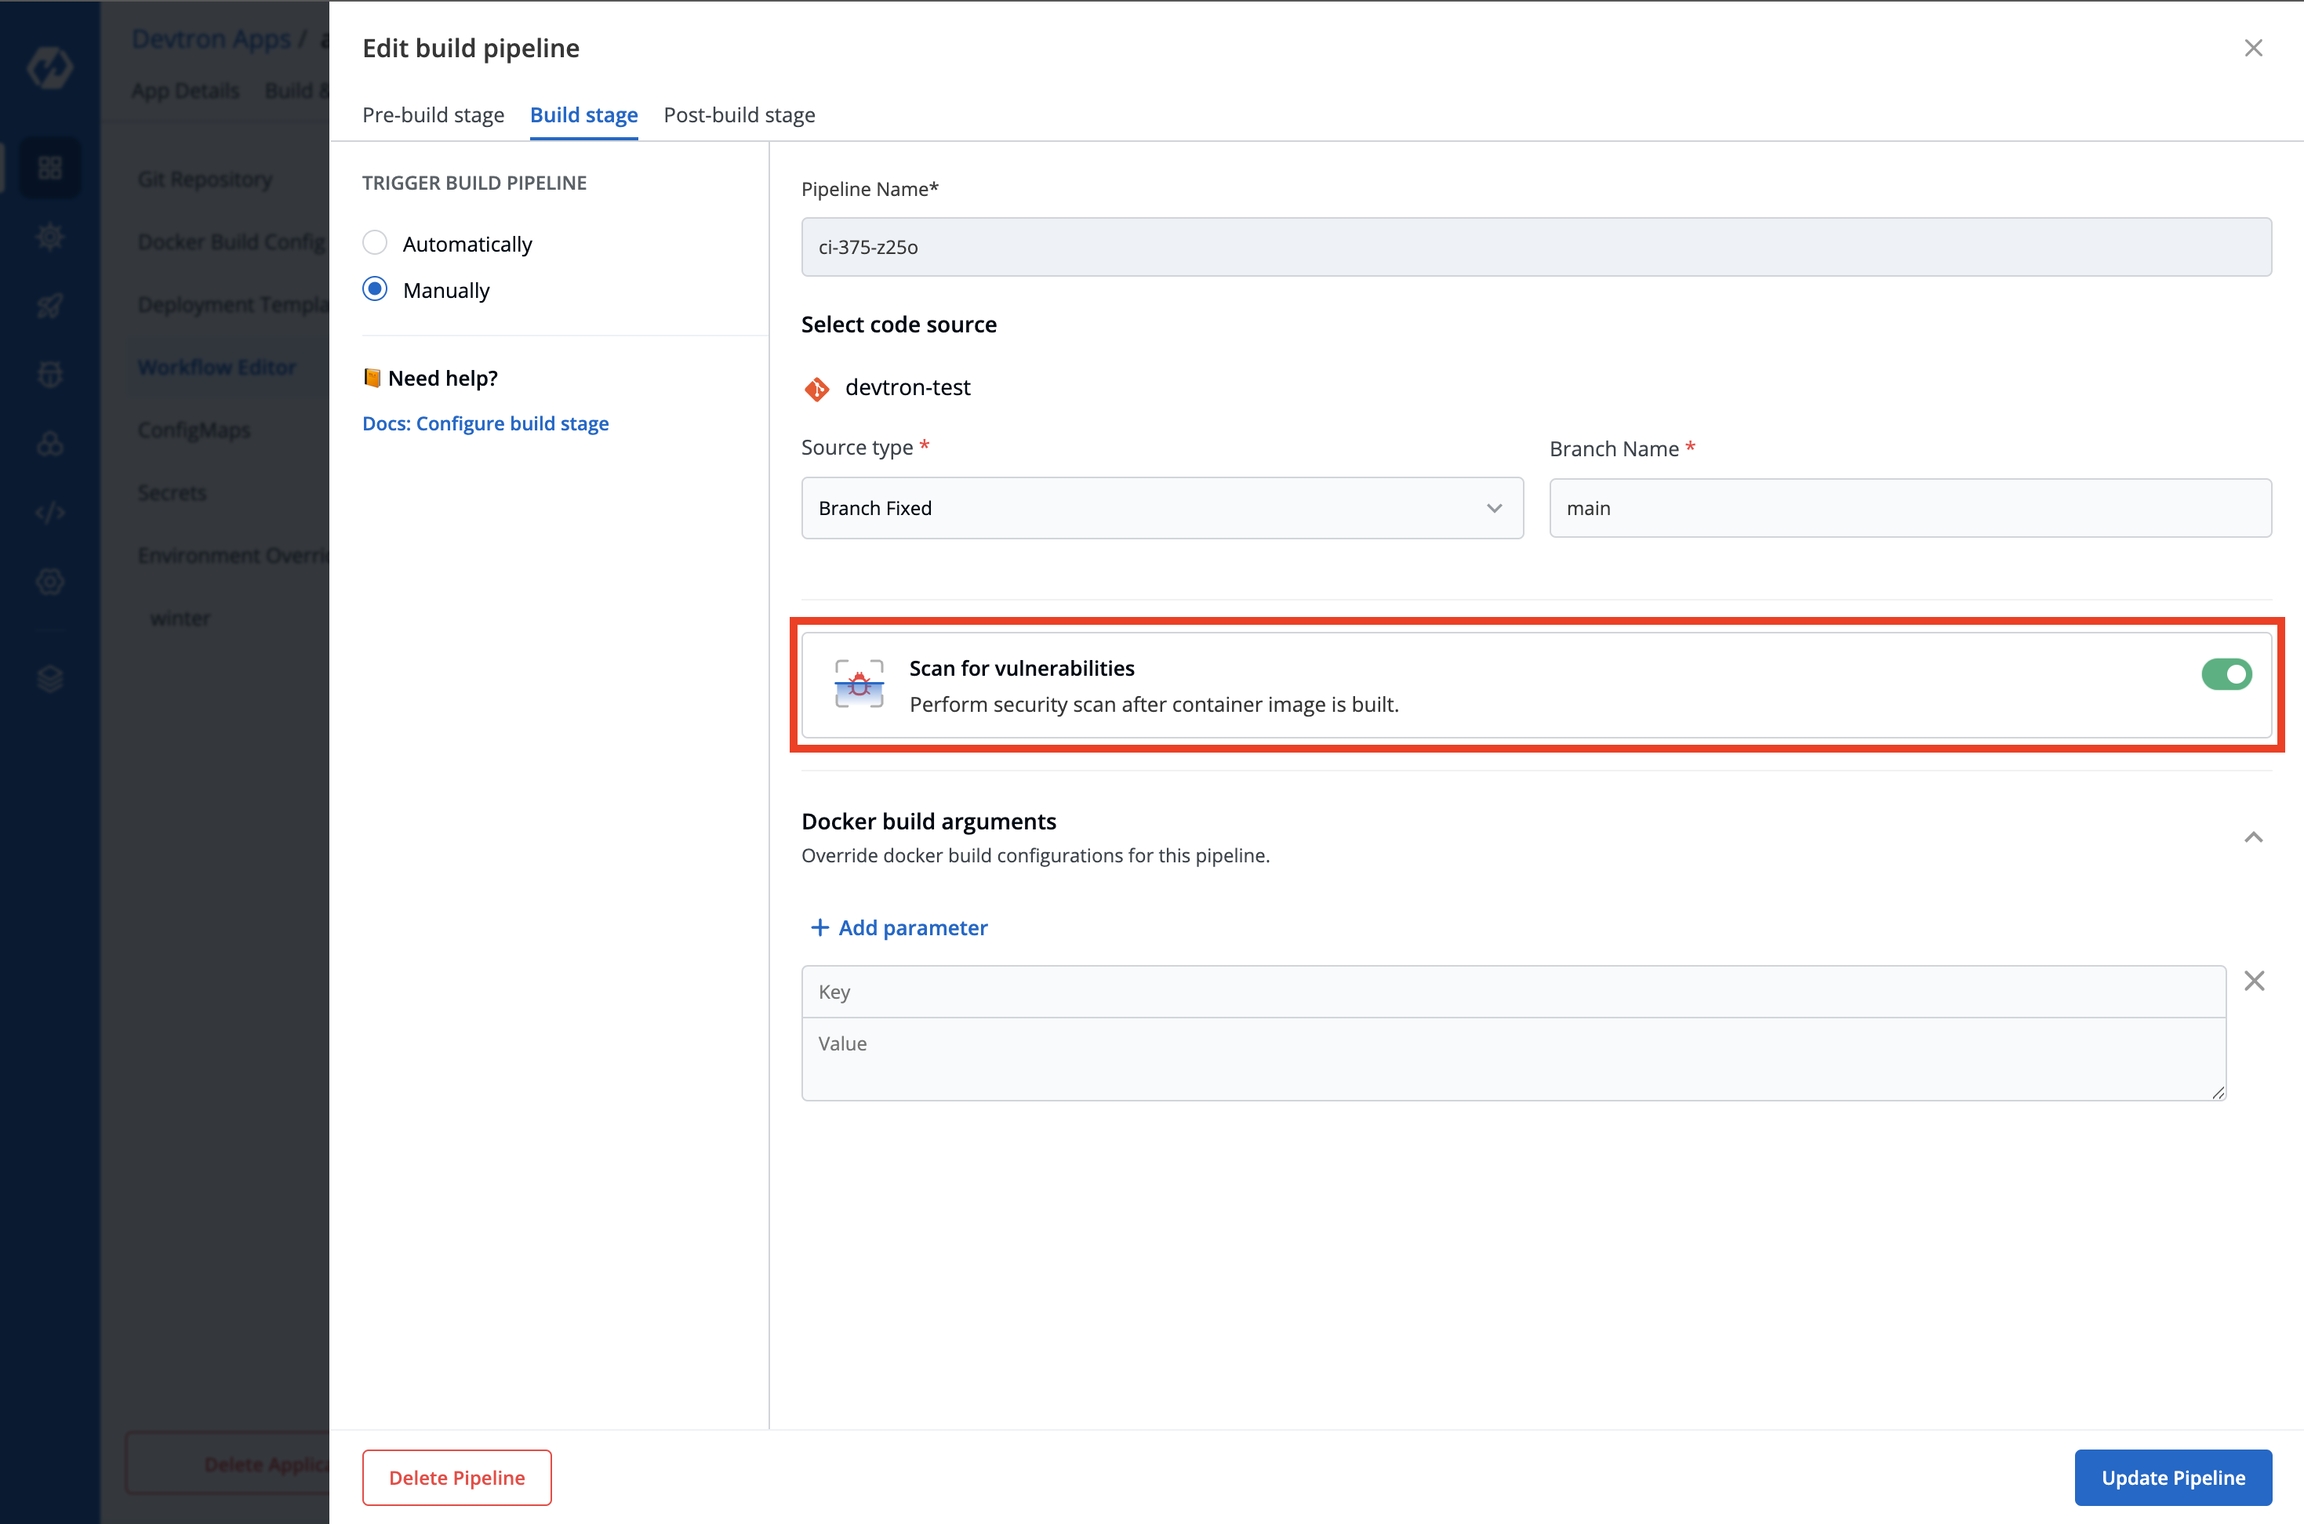
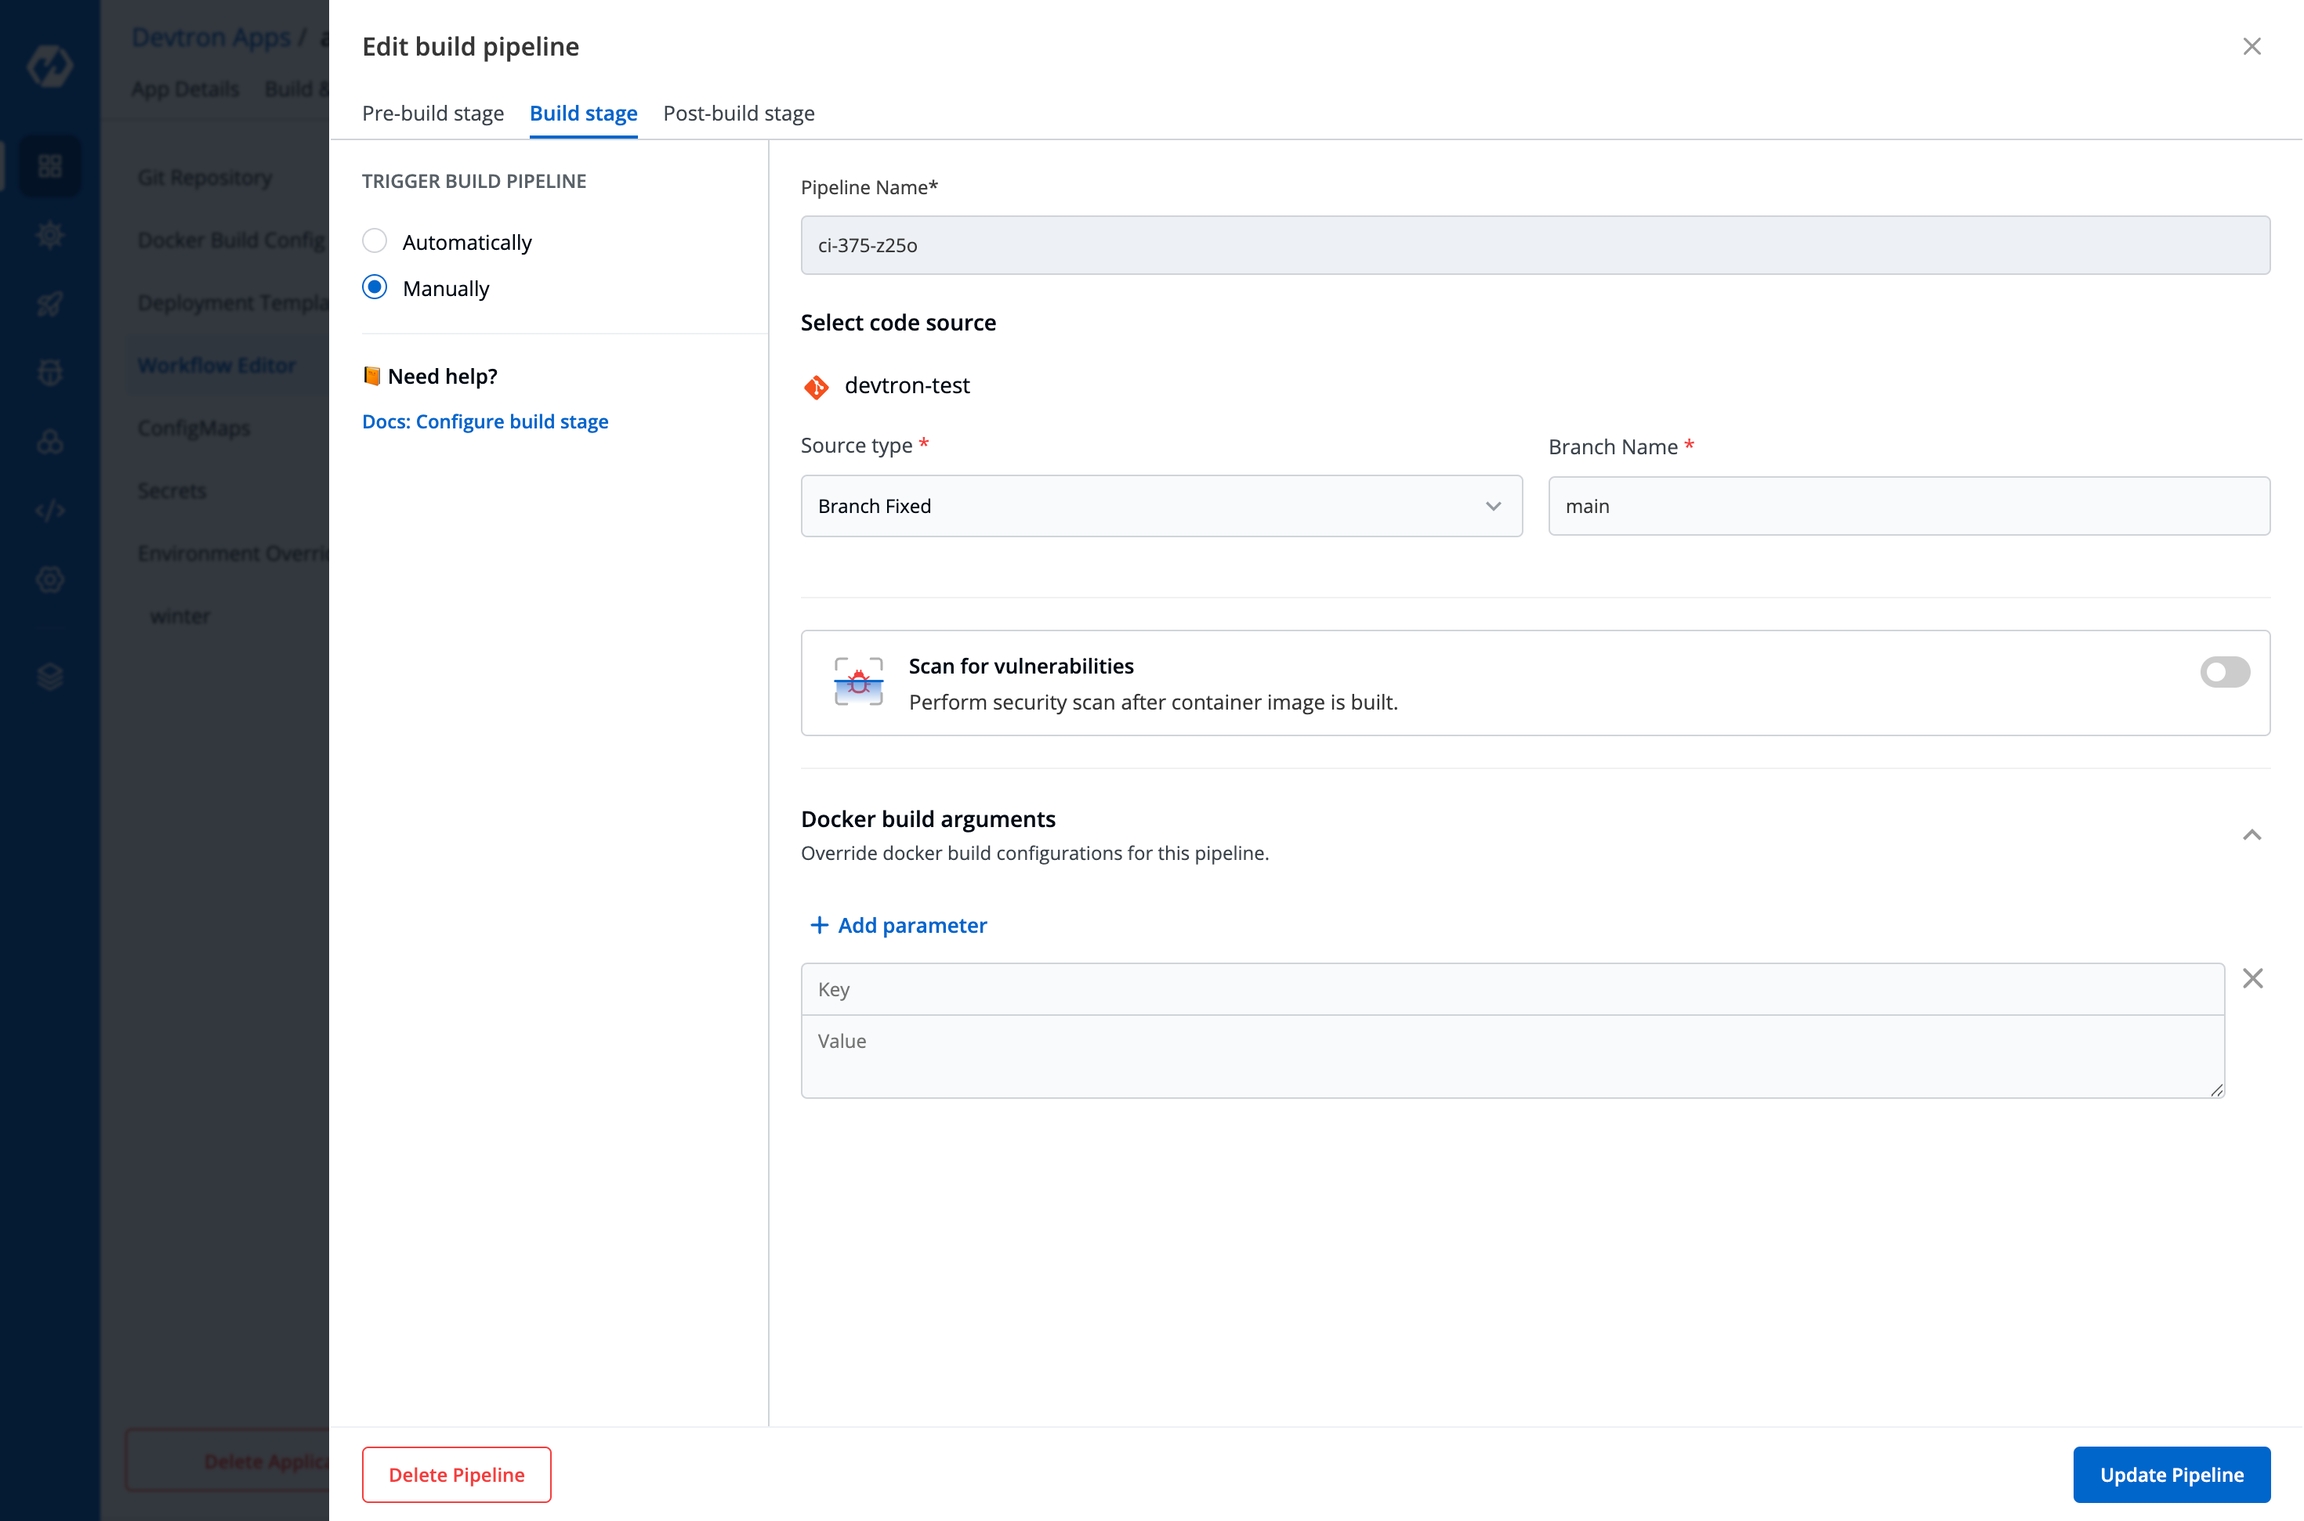
RECOMMEND_SECURITY_SCANNING
If True, security scanning is enabled by default for a new build pipeline. Users can however turn it off in the new or existing pipelines.
FORCE_SECURITY_SCANNING
If set to True, security scanning is forcefully enabled by default for a new build pipeline. Users can not turn it off for new as well as for existing build pipelines. Old pipelines that have security scanning disabled will remain unchanged and image scanning should be enabled manually for them.
HIDE_DISCORD
Hides discord chatbot from the dashboard.
Devtron is a tool integration platform for Kubernetes.
Devtron deeply integrates with products across the lifecycle of microservices,i.e., CI, CD, security, cost, debugging, and observability via an intuitive web interface.
To improve the use of Kubernetes, we employ several tools. Using these tools at the same time, however, is cumbersome and complex. This is because these tools do not communicate with one another to manage different aspects of the application lifecycle, such as CI, CD, security, cost, observability, and stabilization.
Devtron is a one-stop solution for the complexity of the tools mentioned above!
Devtron is an open-source modular product that provides a 'seamless' and 'implementation agnostic uniform interface', that can be integrated with both open-source and commercial tools across the entire lifecycle. All this is achieved while focusing on a slick user experience, including a self-serve model.
You can efficiently handle security, stability, cost, and more in a unified experience.
Workflow which understands the domain of Kubernetes, testing, CD, SecOps so that you don't have to write scripts
Reusable and composable components so that workflows are easy to construct and reason through
Deploy to multiple Kubernetes clusters on multiple cloud/on-prem from one Devtron setup.
Works for all cloud providers and on-premise Kubernetes clusters.
Multi-level security policy at global, cluster, environment, and application-level for efficient hierarchical policy management
Behavior-driven security policy
Define policies and exceptions for Kubernetes resources
Define policies for events for faster resolution
One place for all historical Kubernetes events
Access all manifests securely, such as secret obfuscation
Application metrics for CPU, RAM, HTTP status code, and latency with a comparison between new and old
Advanced logging with grep and JSON search
Intelligent correlation between events, logs for faster triangulation of issue
Auto issue identification
Fine-grained access control; control who can edit the configuration and who can deploy.
Audit log to know who did what and when
History of all CI and CD events
Kubernetes events impacting application
Relevant cloud events and their impact on applications
Advanced workflow policies like blackout window, branch environment relationship to secure build and deployment pipelines
GitOps exposed through API and UI so that you don't have to interact with git CLI
GitOps backed by Postgres for easy analysis
Enforce finer access control than Git
Deployment metrics to measure the success of the agile process. It captures MTTR, change failure rate, deployment frequency, and deployment size out of the box.
Audit log to understand the failure causes
Monitor changes across deployments and reverts easily
Application metrics only work for k8s 1.16+
Get updates on Devtron's development and chat with the project maintainers, contributors, and community members.
We at Devtron take security and our users' trust very seriously. If you believe you have found a security issue in Devtron, please responsibly disclose it by contacting us at security@devtron.ai.
Once installed Devtron has one built-in admin user with super-admin privileges that has complete access to the system. It is recommended to use admin user only for initial and global configuration and then switch to local users or configure SSO integration.
Only users with super-admin privileges have access to create SSO configuration. Devtron uses dex for authenticating a user against the identity provider.
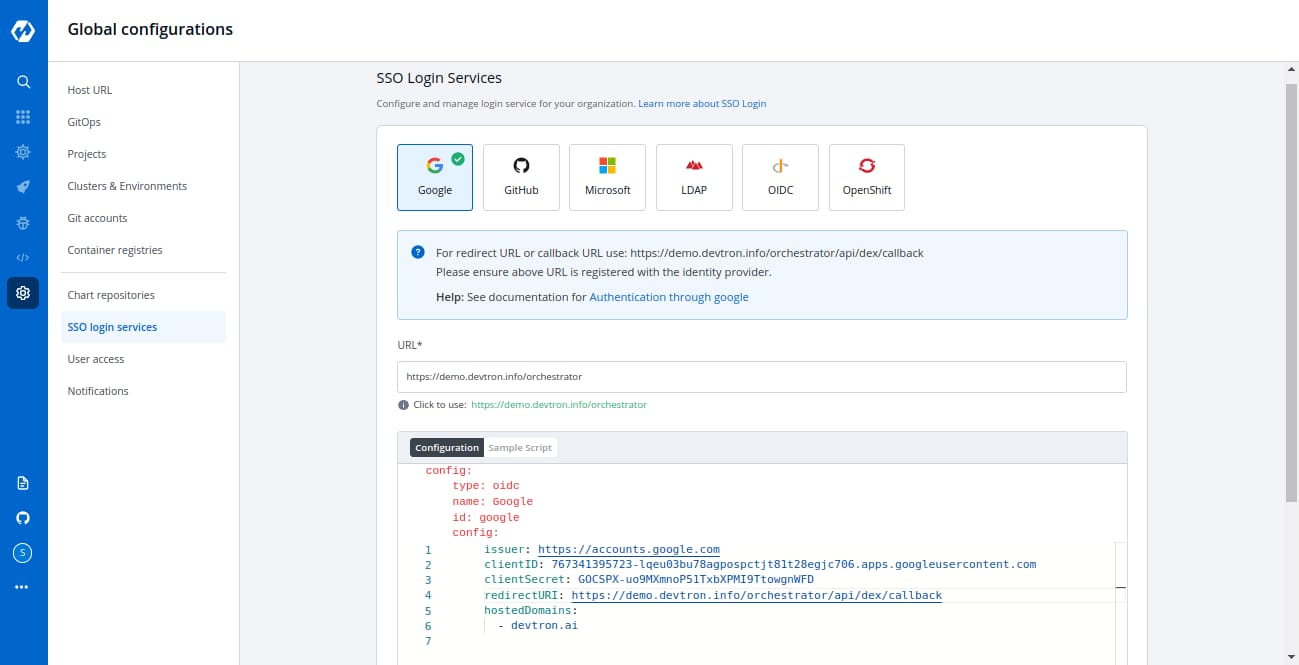
To add/edit SSO configuration please go to the left main panel -> Select Global Configurations -> Select SSO Login Services
LDAP GitHub OpenID Connect Google Microsoft OpenShift
Dex implements connectors that target specific identity providers, for each connector configuration user must have created account for the corresponding identity provider and registered an app for client key and secret. For examples see
https://dexidp.io/docs/connectors/
https://dexidp.io/docs/connectors/google/
Login as a user with super-admin privileges and go to Global Configurations -> SSO Login Services and click on any Identity Provider and fill the configuration.
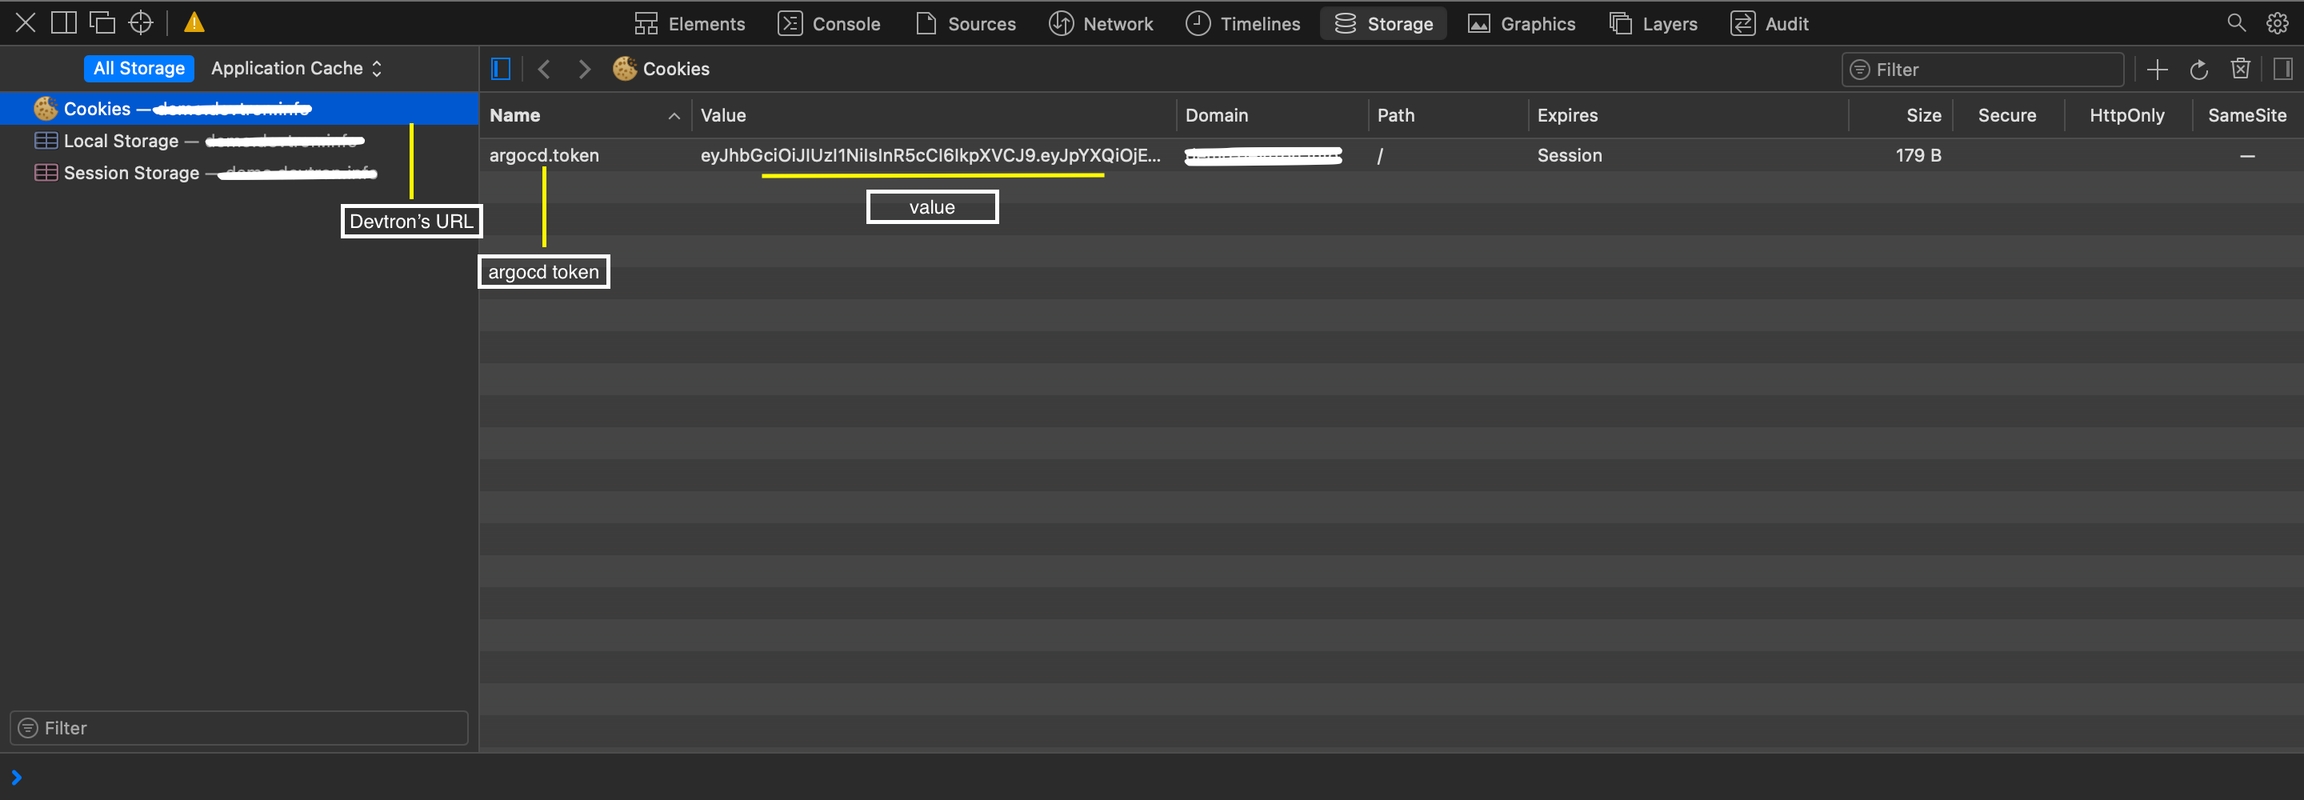
Add valid devtron application URL where it is hosted.
Fill correct redirect URL or callback URL from which you have registered with the identity provider in the previous step along with the client id and client secret shared by the identity provider.
Only single SSO login configuration can be active at one time. Whenever you create or update any SSO config, it will be activated and used by the system and previous configurations will be deleted.
Except for the domain substring, URL and redirectURI should be the same as in the screenshots.
Select Save to create and activate SSO login.
SSO configuration can be changed by the user at any later point in time by updating the configuration and clicking on the Save button at the bottom right. In case of configuration change all users will be logged out of the system and will have to login again.
type : oidc or any platform name such as (google, gitlab, github etc)
name : identity provider platform name
id : identity provider platform unique id in string. (refer to dexidp.io)
config : user can put connector details into this key. platforms may not have same structure but commons are clientID, clientSecret, redirectURI.
hostedDomains : domains authorized for SSO login.
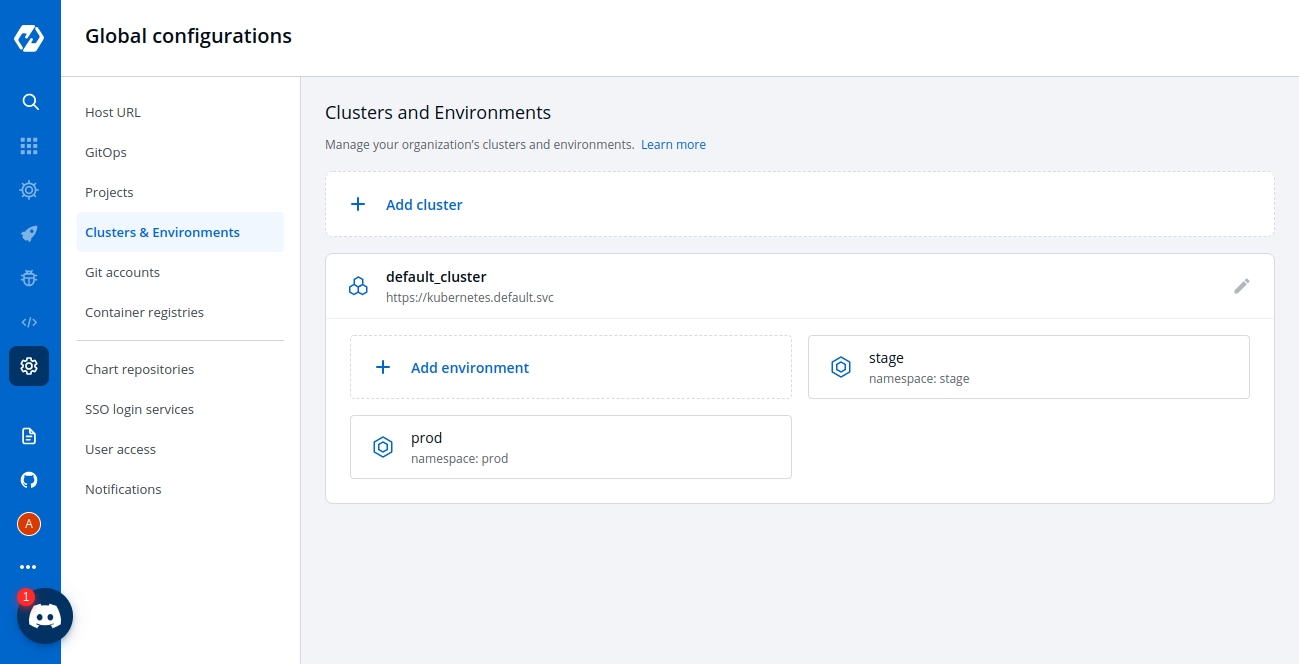
The Global configuration provides a feature of Cluster & Environment in which you can add your Kubernetes clusters and environment.
Select the Cluster & Environment section of global configuration and click on Add Cluster to add your cluster.
To add a cluster on devtron, you must have superadmin access.
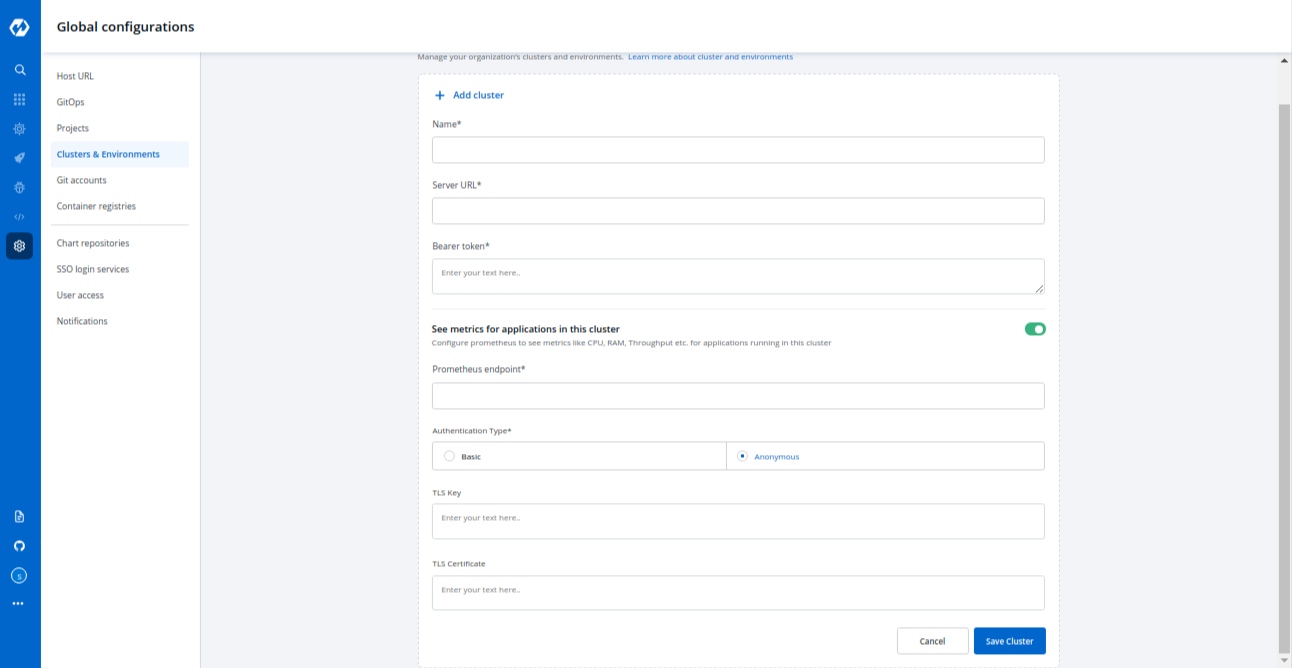
Navigate to the Global Configurations → Clusters and Environments on devtron and click on Add Cluster. Provide the below informations to add your kubernetes cluster:
Name
Kubernetes Cluster Info
Server URL
Bearer token
Prometheus Info
Prometheus endpoint
Basic
Username
Password
Anonymous
TLS Key
TLS Certificate
Give a name to your cluster inside the name box.
Provide your kubernetes cluster’s credentials.
Server URL
Provide the endpoint/URL of your kubernetes cluster.It is recommended to use a self-hosted URL instead of cloud hosted. Self-hosted URL will provide the following benefits.
(a) Disaster Recovery - It is not possible to edit the server-url of a cluster. So if you're using an eks url, For eg- *****.eu-west-1.elb.amazonaws.com it will be a tedious task to add a new cluster and migrate all the services one by one. While using a self-hosted url For eg- clear.example.com you can just point to the new cluster's server url in DNS manager and update the new cluster token and sync all the deployments.
(b) Easy cluster migrations - Cluster url is given in the name of the cloud provider used, so migrating your cluster from one provider to another will result in waste of time and effort. On the other hand, if using a self-hosted url migrations will be easy as the url is of single hosted domain independent of the cloud provider.
Bearer token
Provide your kubernetes cluster’s Bearer token for authentication purposes so that Devtron is able to communicate with your kubernetes cluster and can deploy your application in your kubernetes cluster.
Get the server url and generate the bearer token by running the following command:
Please ensure that kubectl and jq are installed on the bastion on which you’re running the command.
Prometheus is a powerful solution to provide graphical insight into your application behavior. If you want to see your application matrix against your applications deployed in kubernetes, install Prometheus in your kubernetes cluster. The below inputs are required to configure your prometheus into Devtron’s tool.
Prometheus endpoint
Provide the URL of your prometheus. Prometheus supports two types of authentication Basic and Anonymous. Select the authentication type for your Prometheus setup.
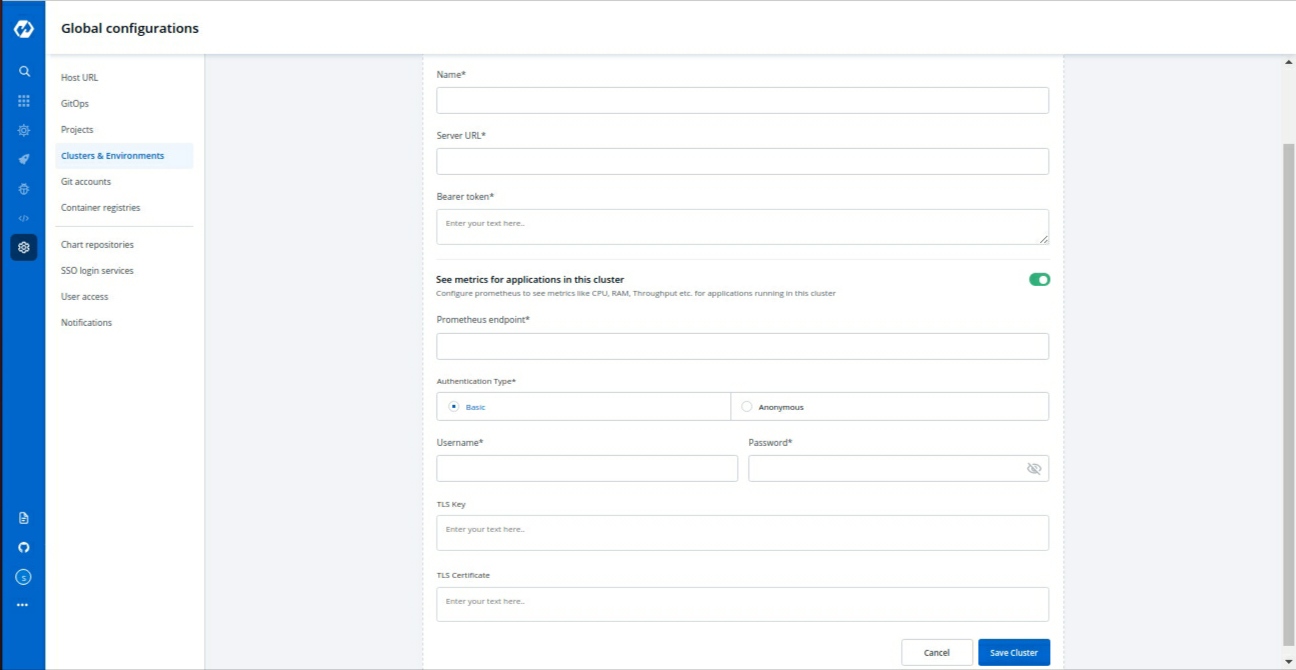
Basic
If you select the basic type of authentication then you have to provide the Username and Password of prometheus for authentication.
Anonymous
If you select Anonymous then you do not have to provide any username and password for authentication.
TLS Key & TLS Certificate
TLS key and TLS certificate both options are optional, these options are used when you use a custom URL, in that case, you can pass your TLS key and TLS certificate.
on saving or update a cluster there is a call to fetch k8s version, it will store corresponding to cluster on db. used in listing api's and app detail page for grafana url.
Check the below screenshots to know how it looks like If you select the Basic authentication type
If you select the Anonymous authentication type
Now click on Save Cluster to save your cluster information.
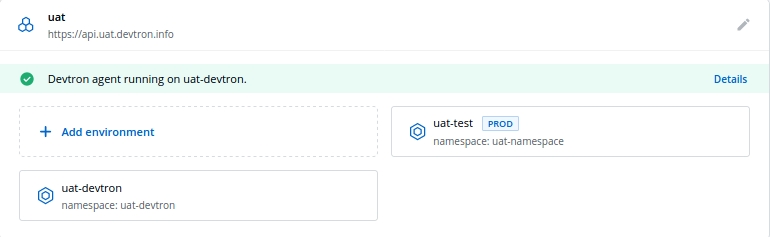
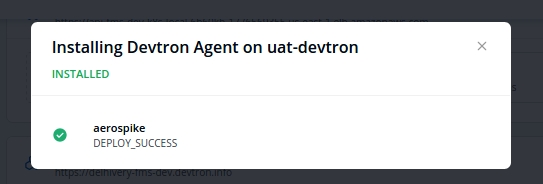
Your kubernetes cluster gets mapped with the Devtron when you save your kubernetes cluster Configuration. Now the agents of devtron will be installed on your cluster so that the components of devtron can communicate to your cluster. When the agent starts installing on your cluster, you can check the status of the agents in the Cluster & Environment tab also.
Click on Details to check what got installed inside the agents. A new window will be popped up displaying all the details about these agents.
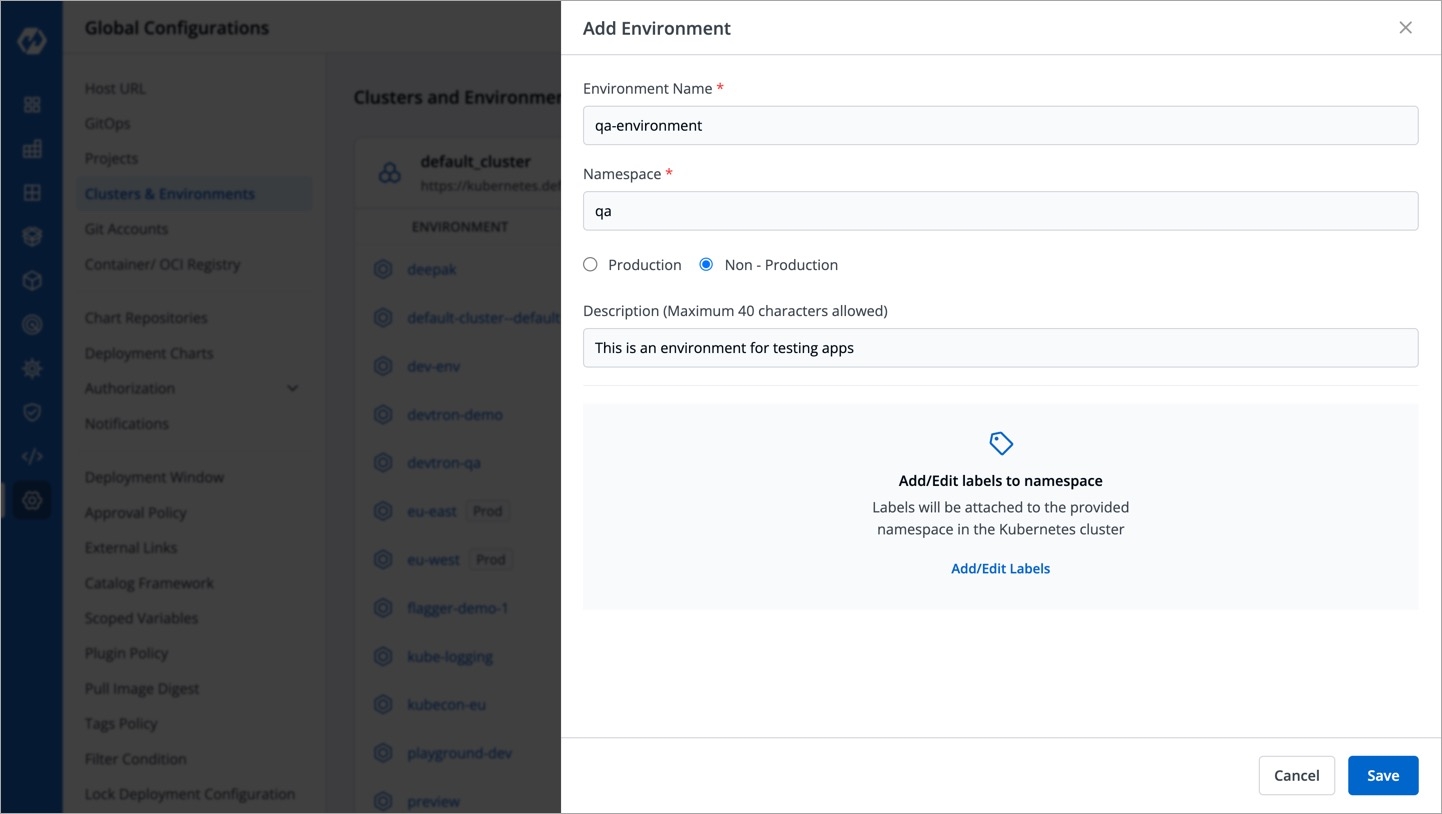
Once you have added your cluster in Cluster & Environment, you can add the environment also. Click on Add Environment, a window will be opened. Give a name to your environment in the Environment Name box and provide a namespace corresponding to your environment in the Namespace input box. Now choose if your environment is for Production purposes or for Non-production purposes. Production and Non-production options are only for tagging purposes. Click on Save and your environment will be created.
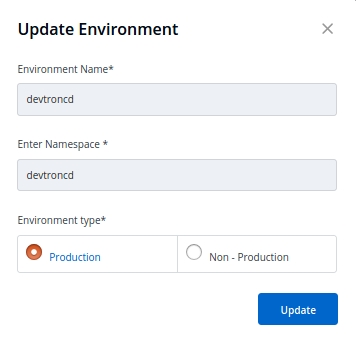
You can update an already created environment, Select and click on the environment which you want to update. You can only change Production and Non-production options here.
Note
You can not change the Environment name and Namespace name.
Click on Update to update your environment.
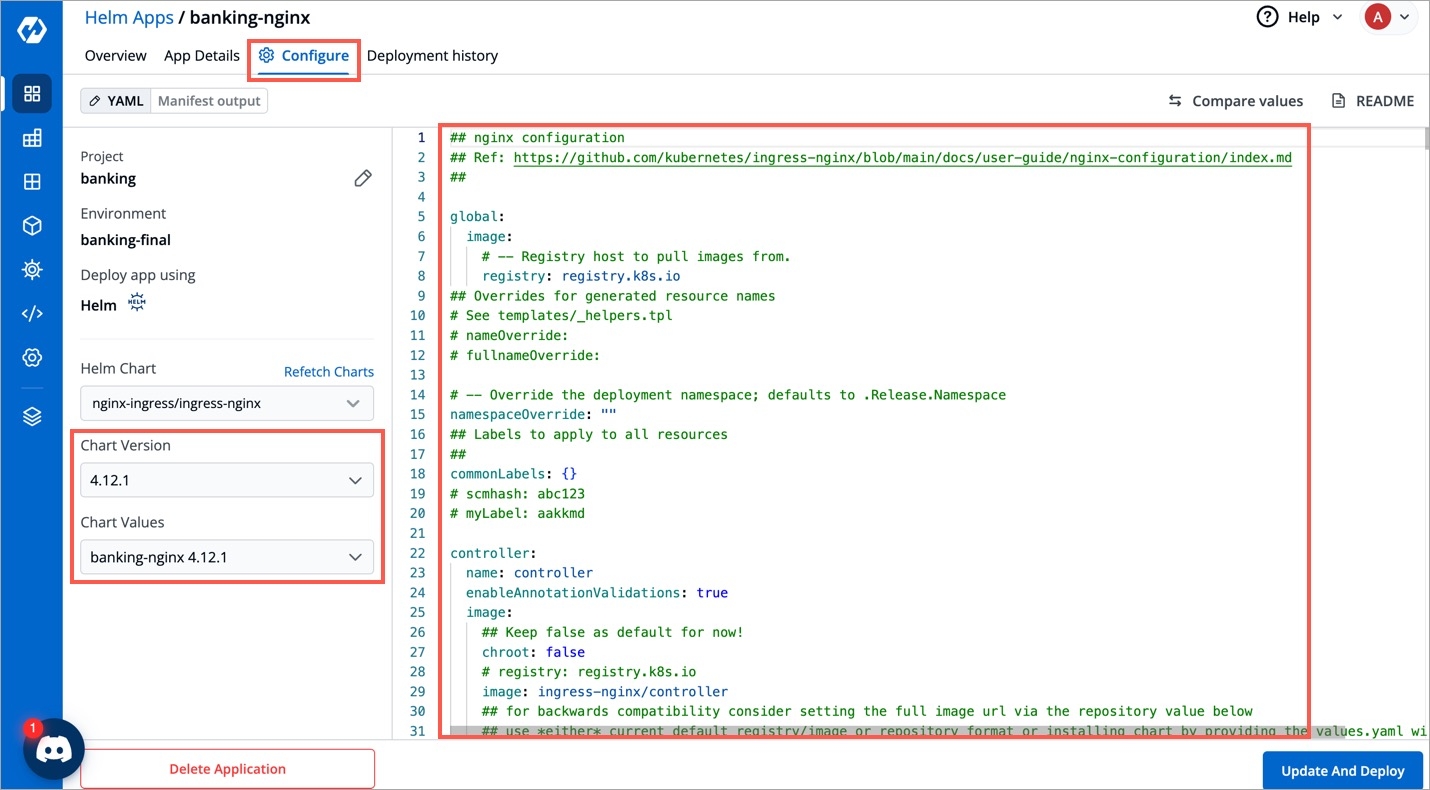
When configuring an application, you can choose which registry and repository it should use in the App Configuration > section.
Before you begin, create an , and attach only ECR policy ( AmazonEC2ContainerRegistryFullAccess ) if using Key-based auth. Or attach the ECR policy ( AmazonEC2ContainerRegistryFullAccess) to the cluster worker nodes IAM role of your Kubernetes cluster if using Role-based access.
To use the ECR container image, go to the Applications page and select your application, and then select App Configuration > .
Give the password/ corresponding to your docker hub account.
Google Container Registry (GCR) : JSON key file authentication method can be used to authenticate with username and password. Please follow for getting username and password for this registry. Please remove all the white spaces from json key and wrap it in single quote while putting in password field.
Google Artifact Registry (GAR) : JSON key file authentication method can be used to authenticate with username and password. Please follow for getting username and password for this registry. Please remove all the white spaces from json key and wrap it in single quote while putting in password field.
Azure Container Registry (ACR) : Service principal authentication method can be used to authenticate with username and password. Please follow for getting username and password for this registry.
The name that you provide in values.yaml ie. regcred is name of the secret that will be used as imagePullSecrets to pull the image from docker hub to deploy. To know how imagePullSecrets will be used in the deployment-template, please follow the .
dex config if you want to integrate login with SSO (optional) for more information check
NOTE: For using the storage containers it is mandatory to enable versioning on the storage account. to enable the same.
The following tables contain parameters and their details for Secrets and ConfigMaps that are configured during the installation of Devtron. While installing Devtron using kubectl the following parameters can be tweaked in file. If the installation is proceeded using helm3, the values can be tweaked in file.
To quickly get started, refer to the ⎈
It uses a modified version of .
Check out our . Directions for opening issues, coding standards, and notes on our development processes are all included.
Join the
Follow
Raise feature requests, suggest enhancements, report bugs at
Read the
Devtron is available under the .
This documentaion consist of authorizations available in Devtron
Parts of the documentaion
This is used to assign user to a particular group and user inherits all the permissions granted to this group. The Permission groups section contains a drop-down of all existing groups on which you have access. This is optional field and more than one groups can be selected for a user.
The advantage of the groups is to define a set of privileges like create, edit, or delete for the given set of resources that can be shared among the users within the group. Users can be added to an existing group to utilize the privileges that it grants. Any access change to group is reflected immediately in user access.
You can select the group which you are creating in the Group permissions section inside Add users.
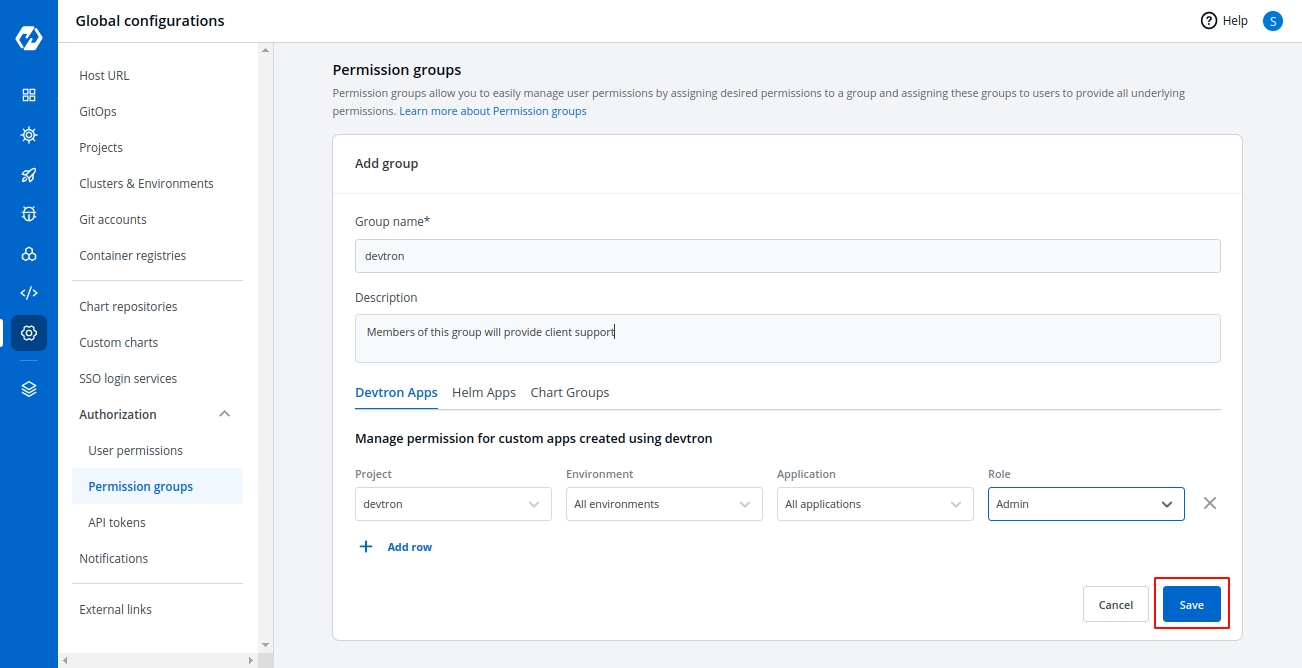
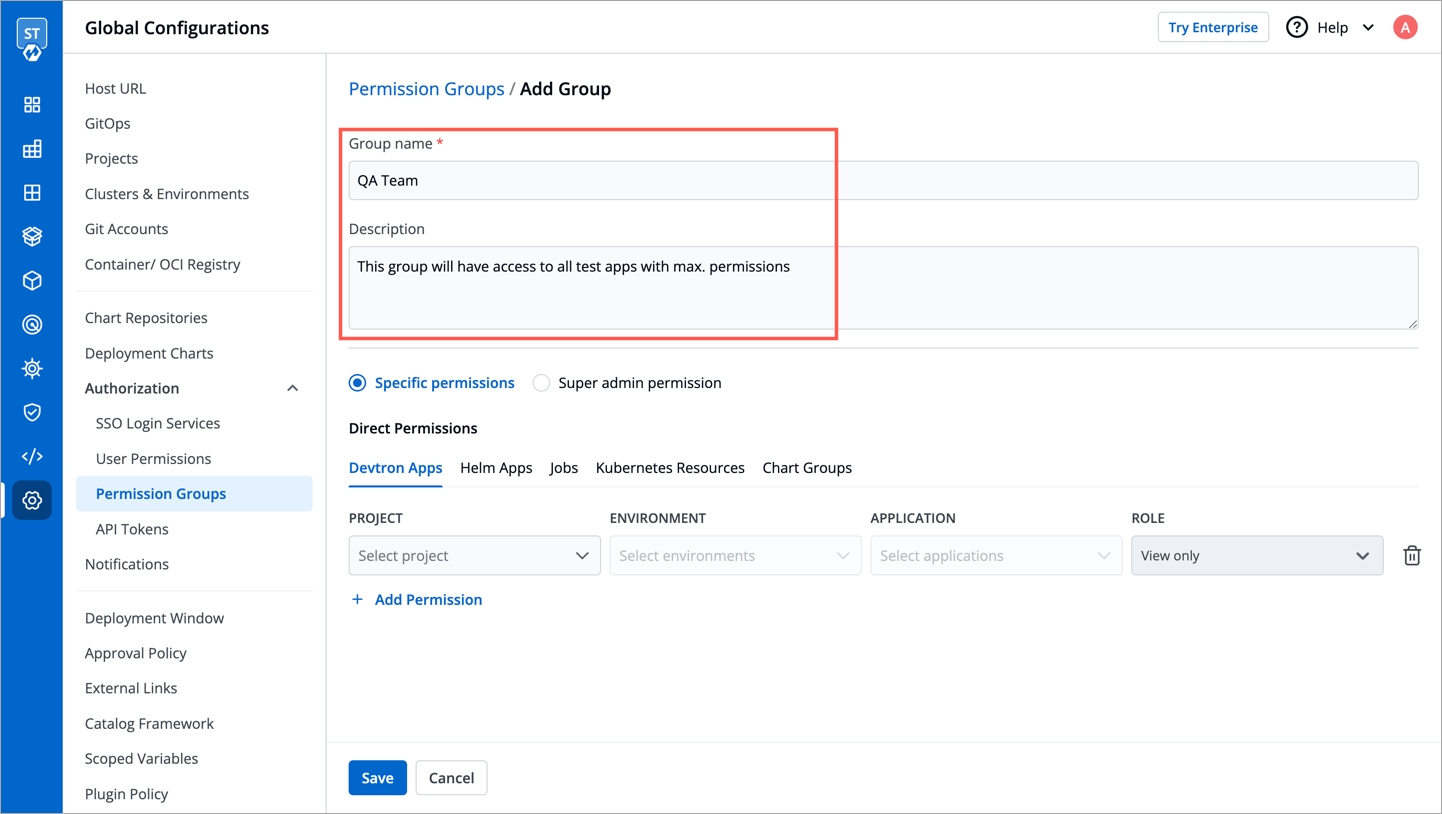
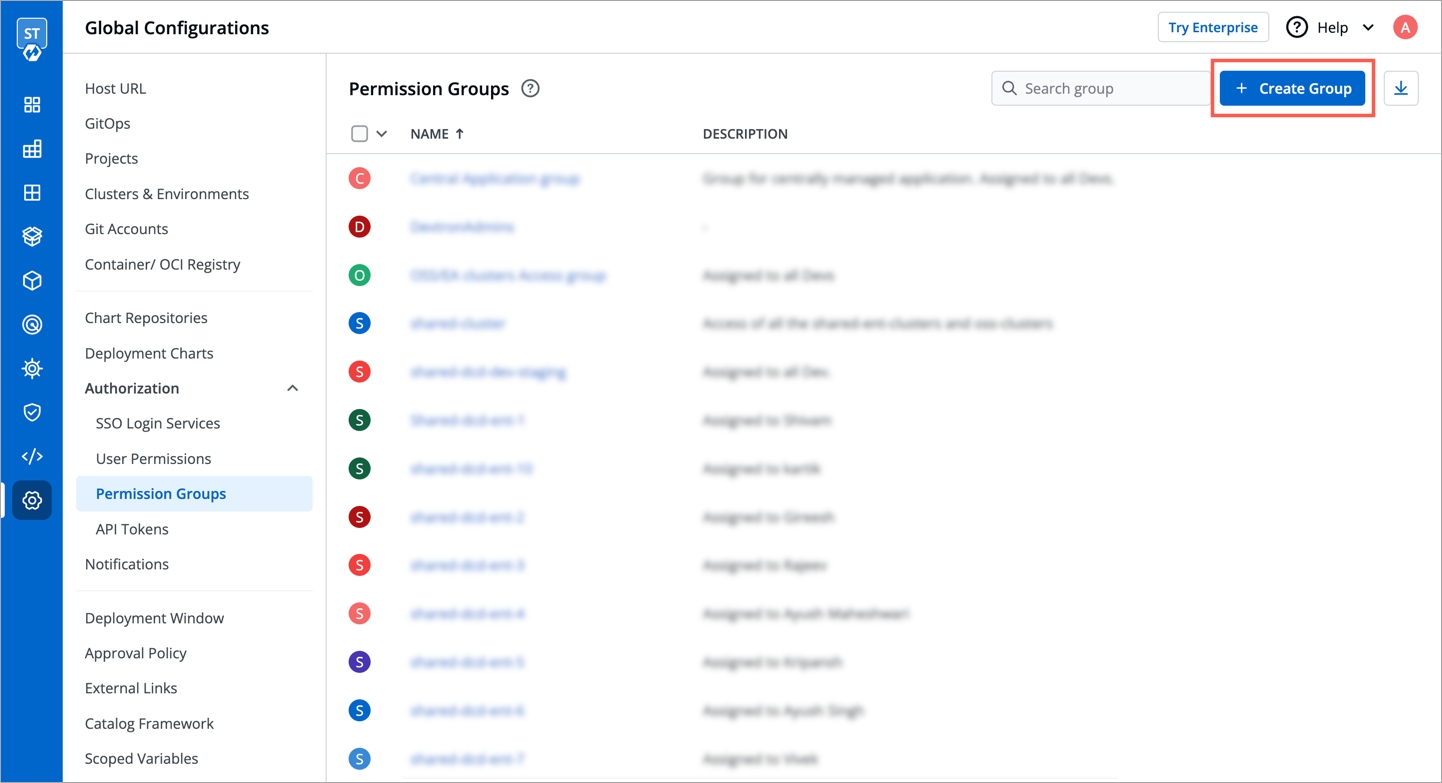
Go to Global configurations -> Authorization -> Permission group and click on Add Group to create a new group.
Enter the Group Name and Description.
Once you have given the group name and group description.
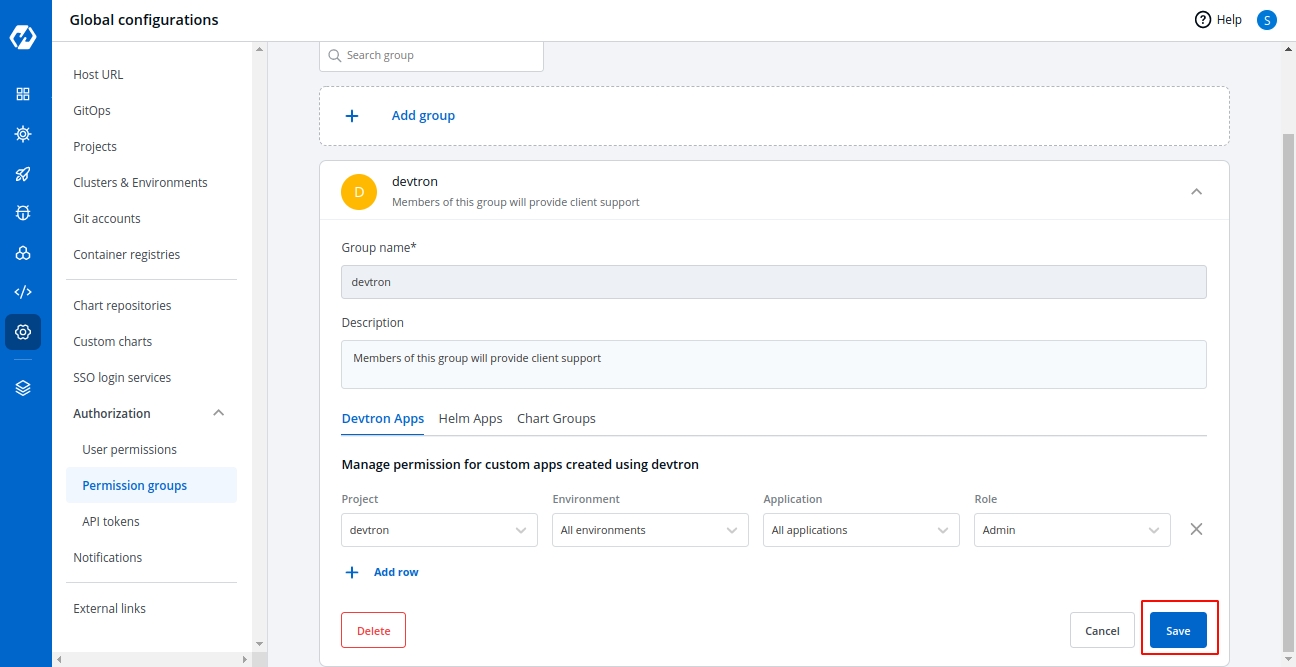
Assign the permissions of groups in the Devtron Apps, Helm Apps or Group Chart permissions section. Manage the project, environment, application and role access the same as we discuss in the user permissions section.
You can add multiple rows for the Devtron Apps and Helm Apps Permissions section.
Once you have finished assigning the appropriate permissions for the permission group, click on Save.
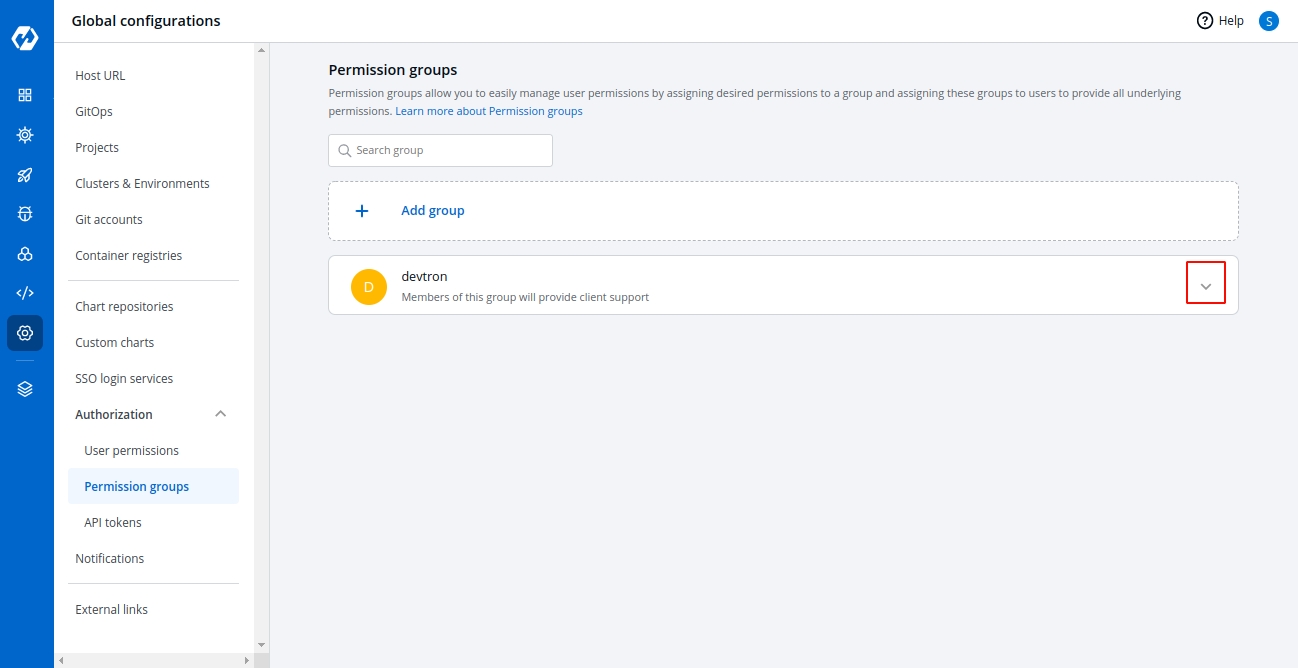
You can edit the permission groups by clicking on the downward arrow.
Then you can edit the permission group here.
Once you are done editing the permission group, click on Save.
If you want to delete the groups with particular permission group, click on Delete.
The chart group permissions for the permission groups will be managed in the same way as for the users. For reference, check Manage chart group permissions for users.
Devtron includes predefined helm charts that cover the majority of use cases. For any use case not addressed by the default helm charts, you can upload your own helm chart and use it as a custom chart in Devtron.
Who can upload a custom chart - Super admins
Who can use the custom chart - All users
A super admin can upload multiple versions of a custom helm chart.
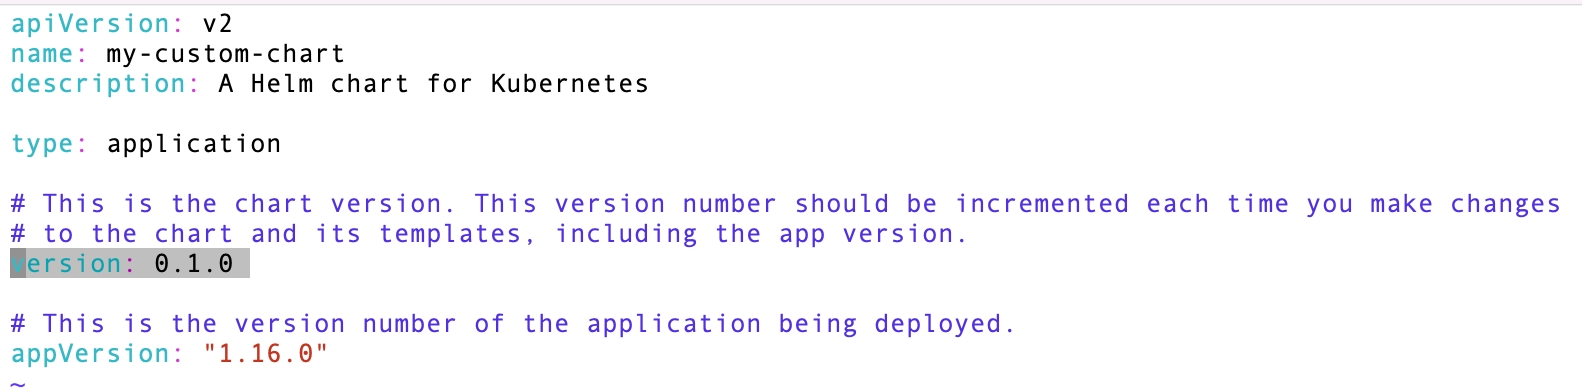
A valid helm chart, which contains Chart.yaml file with name and version fields.
Image descriptor template file - .image_descriptor_template.json.
Custom chart packaged in the *.tgz format.
Name
Required. Name of the helm chart.
Version
Required. This is the chart version. Update this value for each new version of the chart.
Description
Optional. Description of the chart.
.image_descriptor_template.jsonIt's a GO template file that should produce a valid JSON file upon rendering. This file is passed as the last argument in helm install -f myvalues.yaml -f override.yaml command.
Place the .image_descriptor_template.json file in the root directory of your chart.
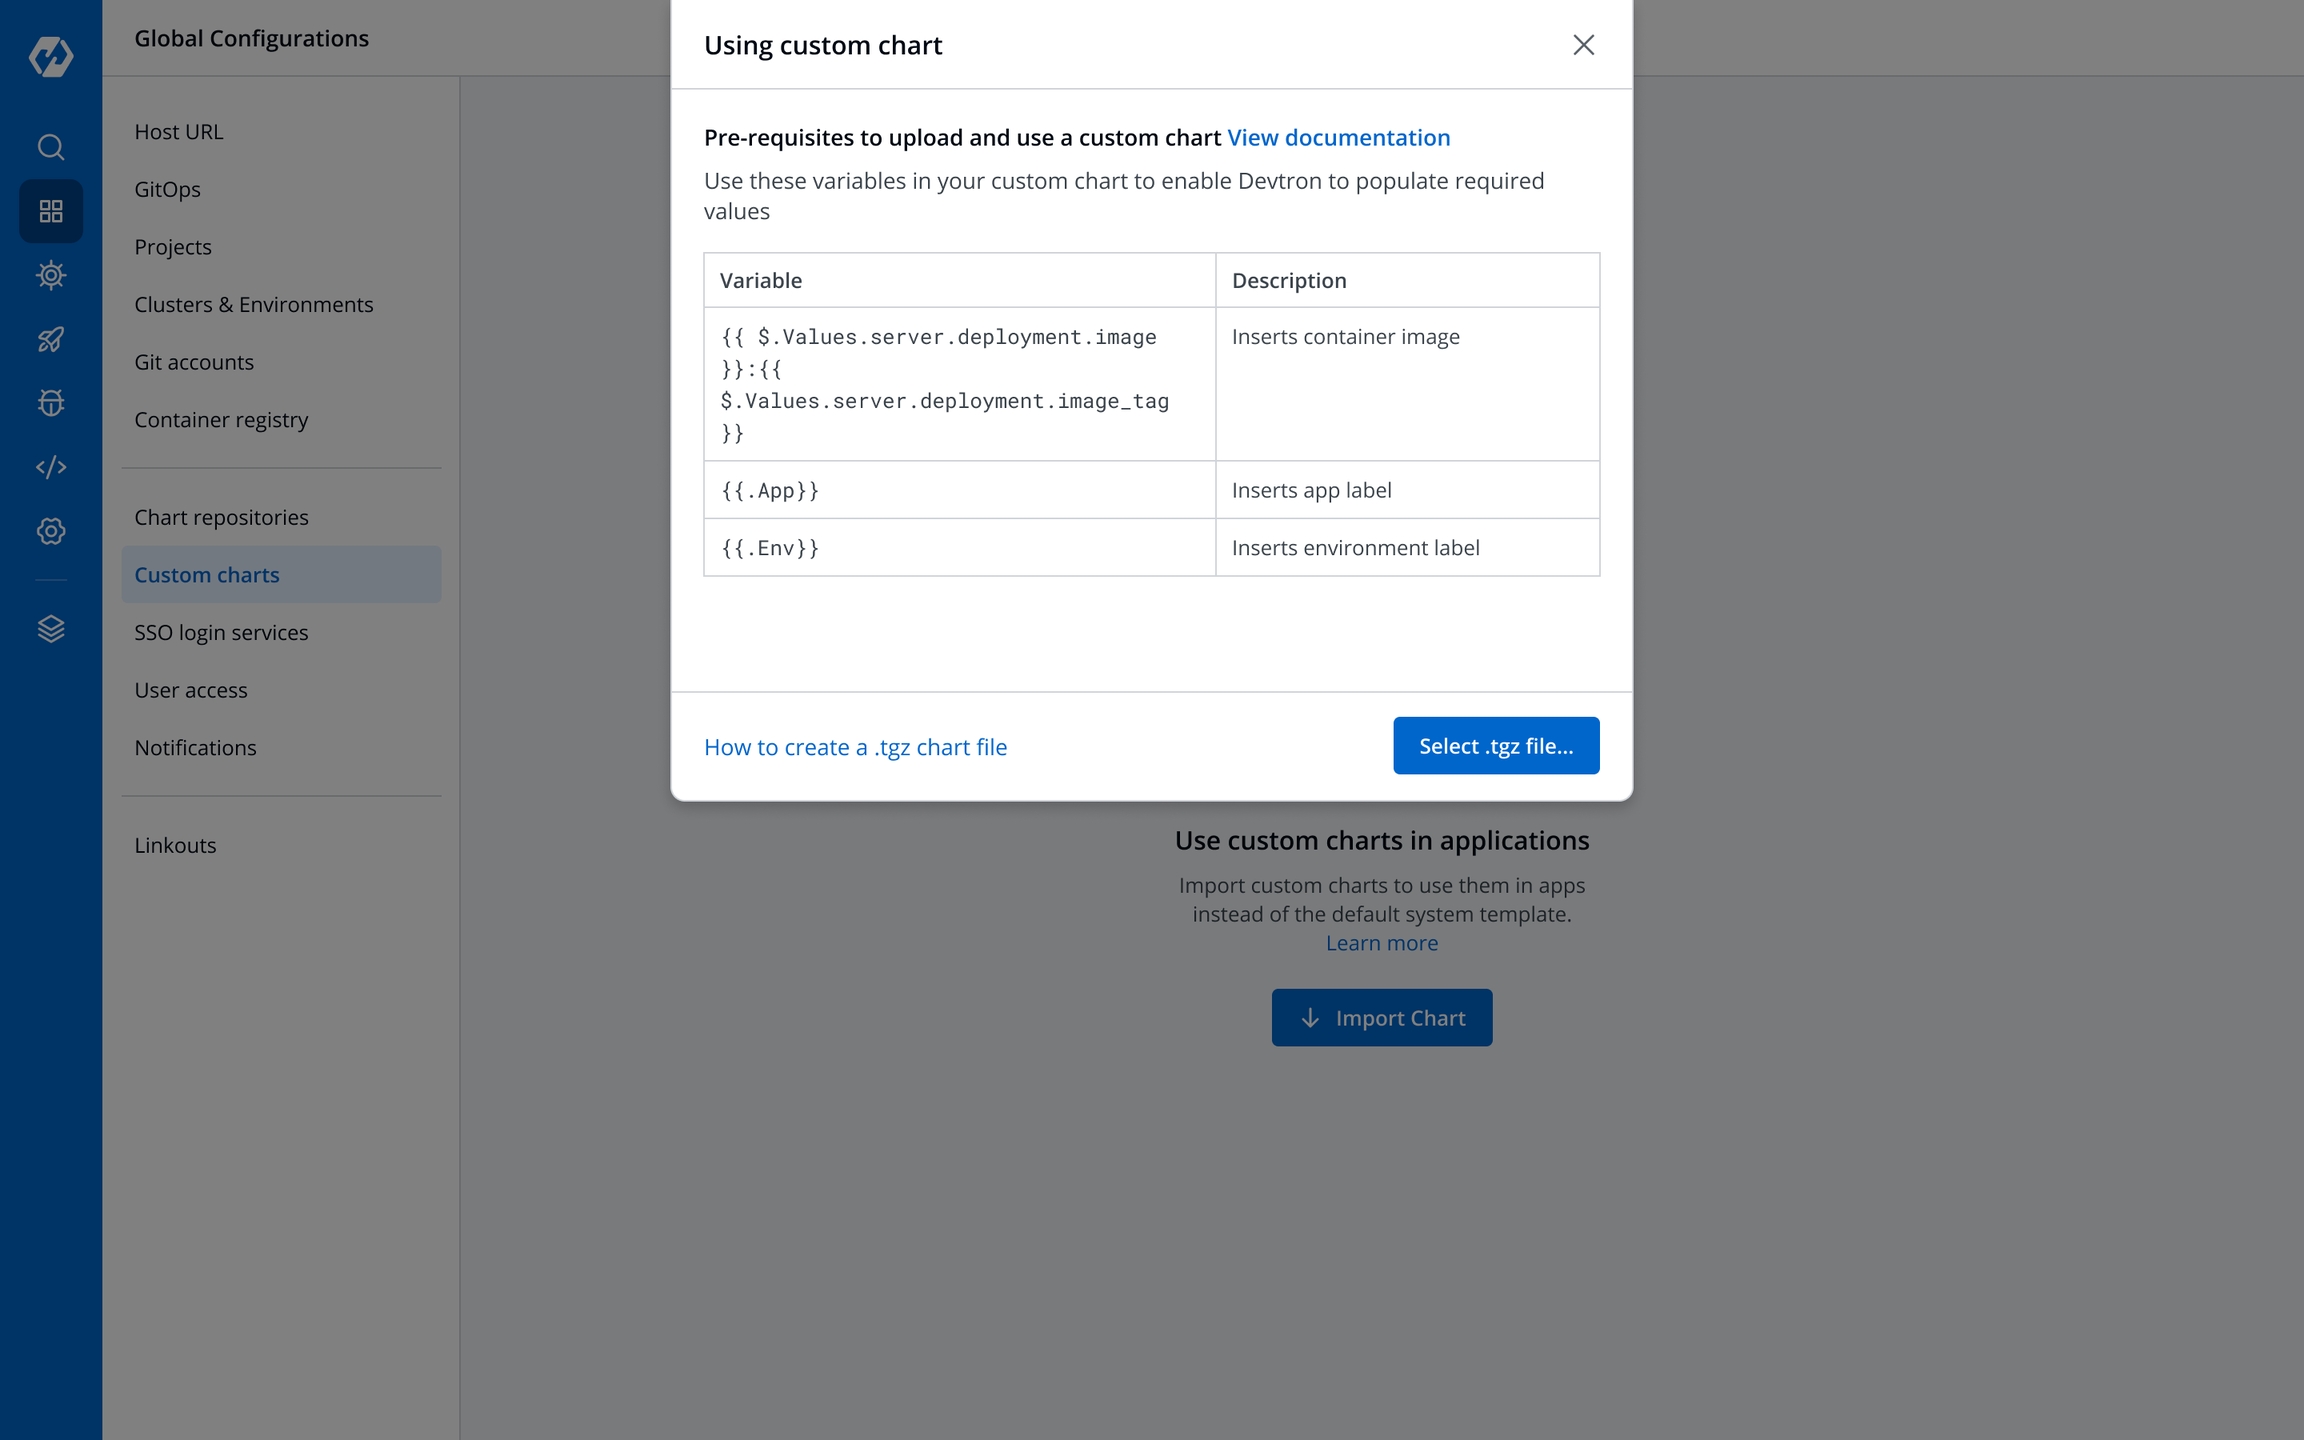
You can use the following variables in the helm template (all the placeholders are optional):
The values from the CD deployment pipeline are injected at the placeholder specified in the
.image_descriptor_template.jsontemplate file.
image_tag
The build image tag
image
Repository name
pipelineName
The CD pipeline name created in Devtron
releaseVersion
Devtron's internal release number
deploymentType
Deployment strategy used in the pipeline
app
Application's ID within the Devtron ecosystem
env
Environment used to deploy the chart
appMetrics
For the App metrics UI feature to be effective, include the appMetrics placeholder.
For example:
To create a template file to allow Devtron to only render the repository name and the tag from the CI/CD pipeline that you created, edit the
.image_descriptor_template.jsonfile as:
*.tgz formatBefore you begin, ensure that your helm chart includes both
Chart.yaml(withnameandversionfields) and.image_descriptor_template.jsonfiles.
The helm chart to be uploaded must be packaged as a versioned archive file in the format - <helm-chart-name>-vx.x.x.tgz.
The above command will create a my-custom-chart-0.1.0.tgz file.
A custom chart can only be uploaded by a super admin.
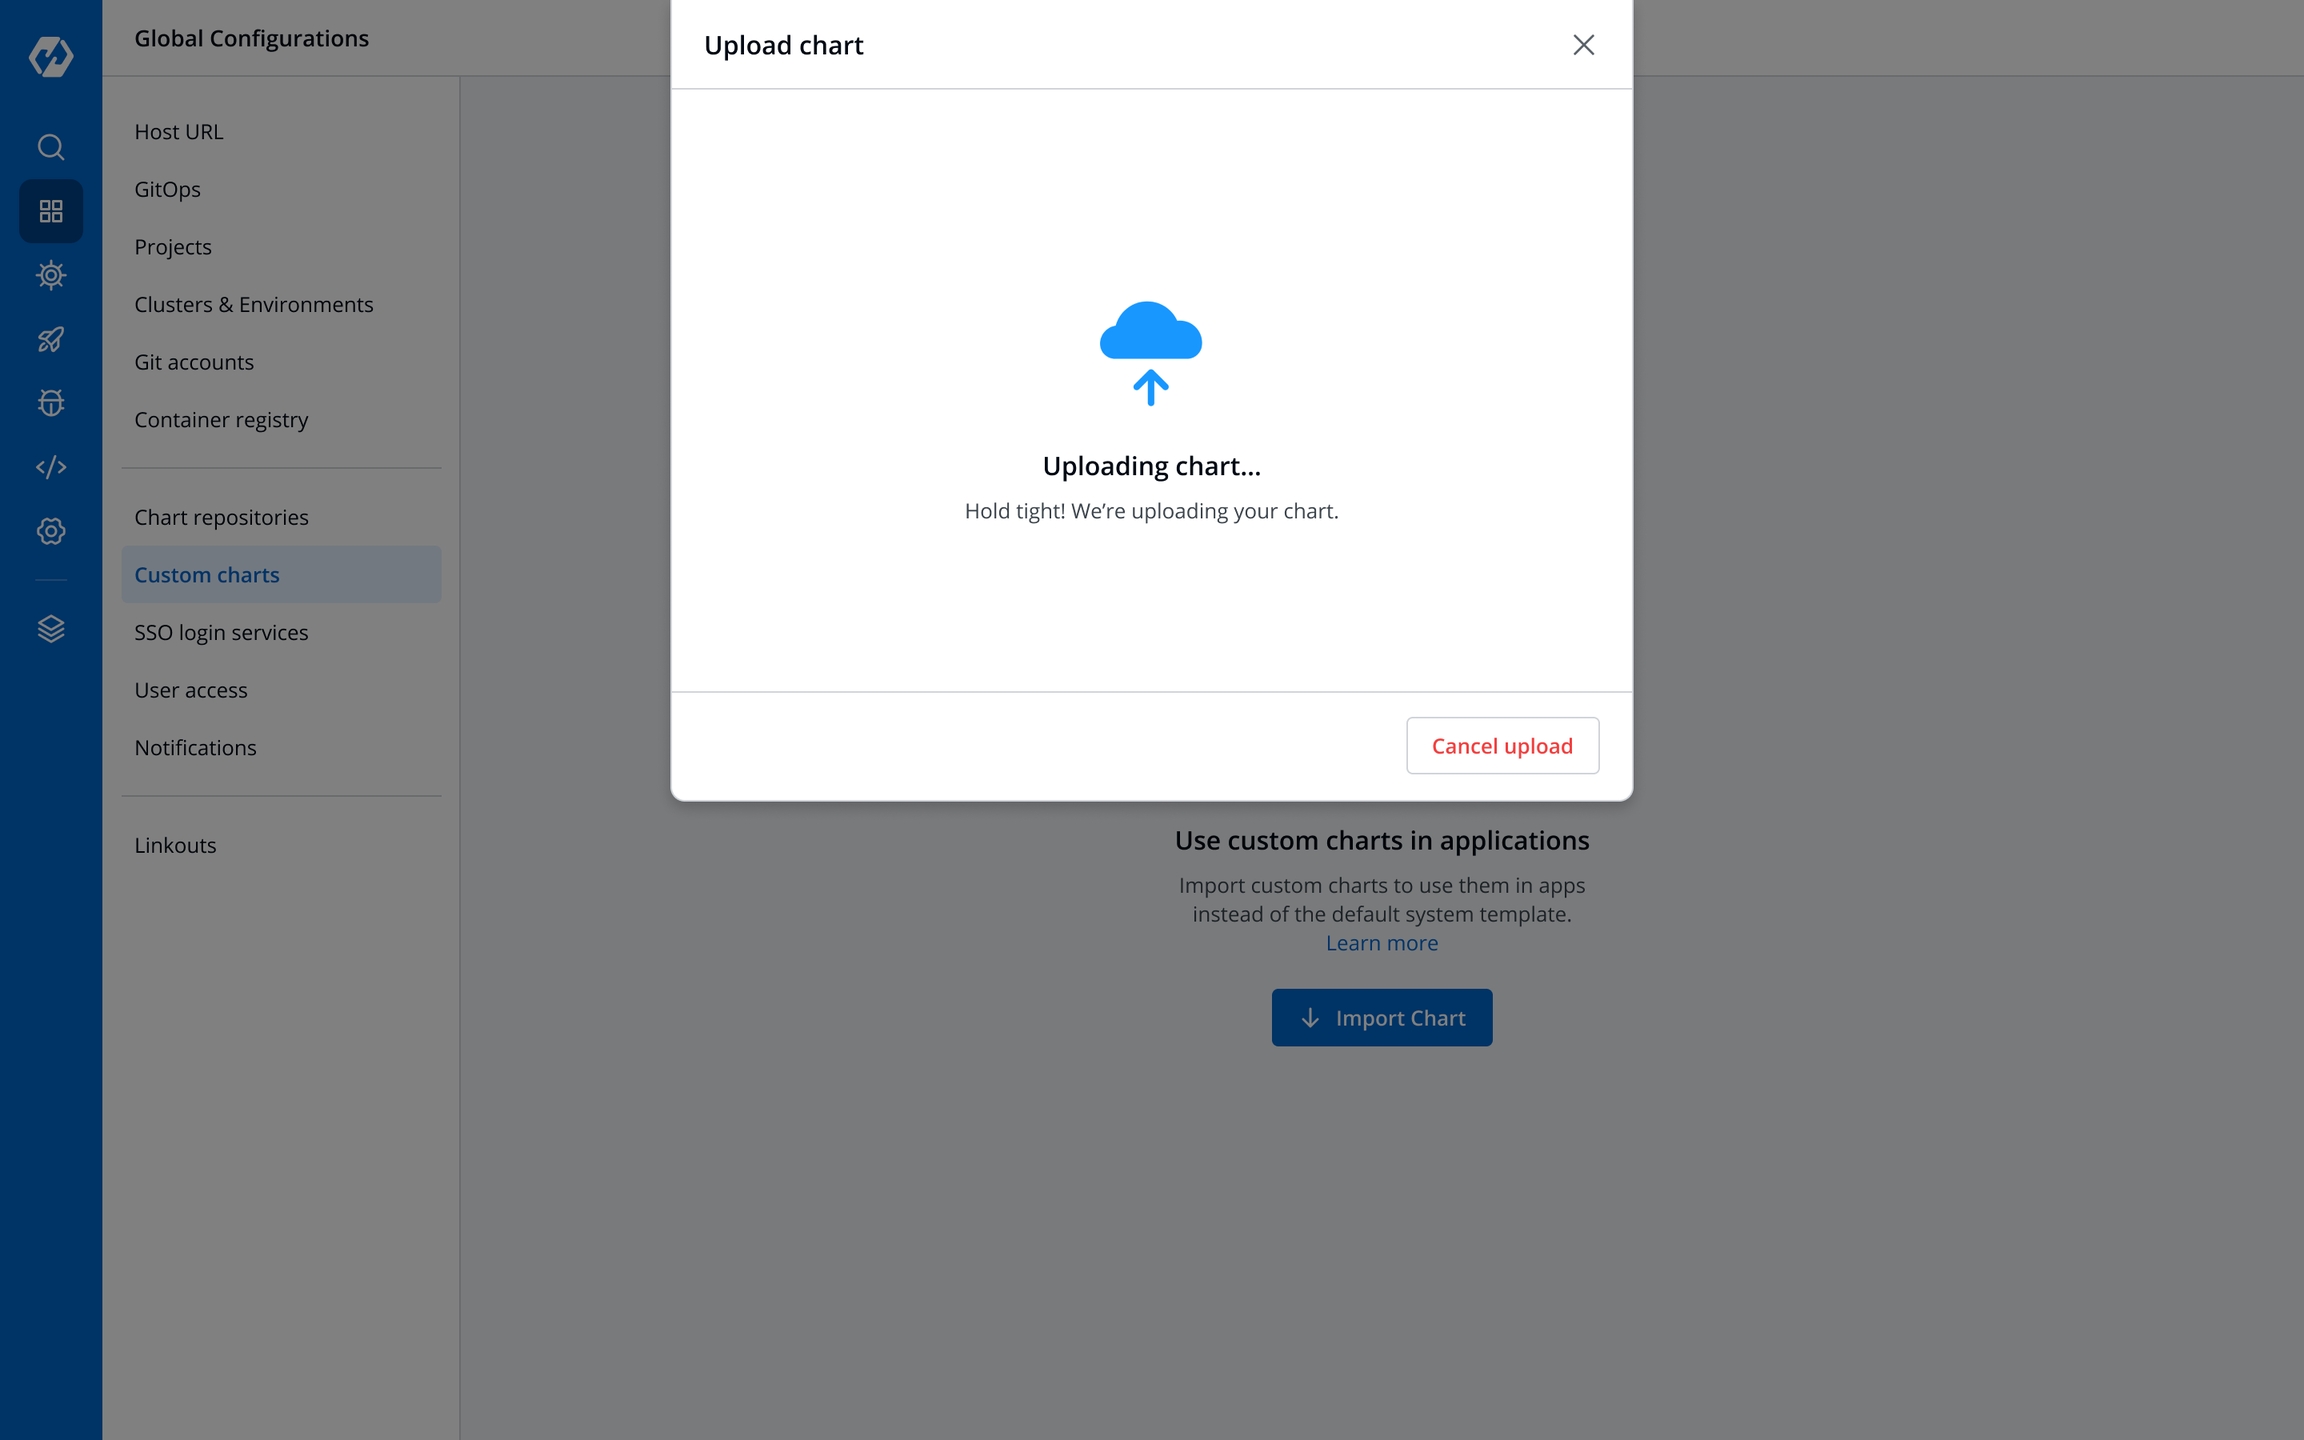
On the Devtron dashboard, select Global Configurations > Custom charts.
Select Import Chart.
Choose Select tar.gz file... and upload the packaged custom chart in the *.tgz format.
The chart is being uploaded and validated. You may also Cancel upload if required.
The uploaded archive will be validated against:
Supported archive template should be in *.tgz format.
Chart.yaml must include the name and the version number.
image_descriptor_template.json file should be present and the field format must match the format listed in the image builder template section.
The following are the validation results:
Success
The files uploaded are validated.
Enter a description for the chart and select Save or Cancel upload.
Unsupported template
Upload another chart or Cancel upload.
New version detected
You are uploading a newer version of an existing chart
Enter a Description and select Save to continue uploading, or Cancel upload.
Already exists
There already exists a chart with the same version.
Edit the version and re-upload the same chart using Upload another chart.
Upload a new chart with a new name using Upload another chart.
Cancel upload.
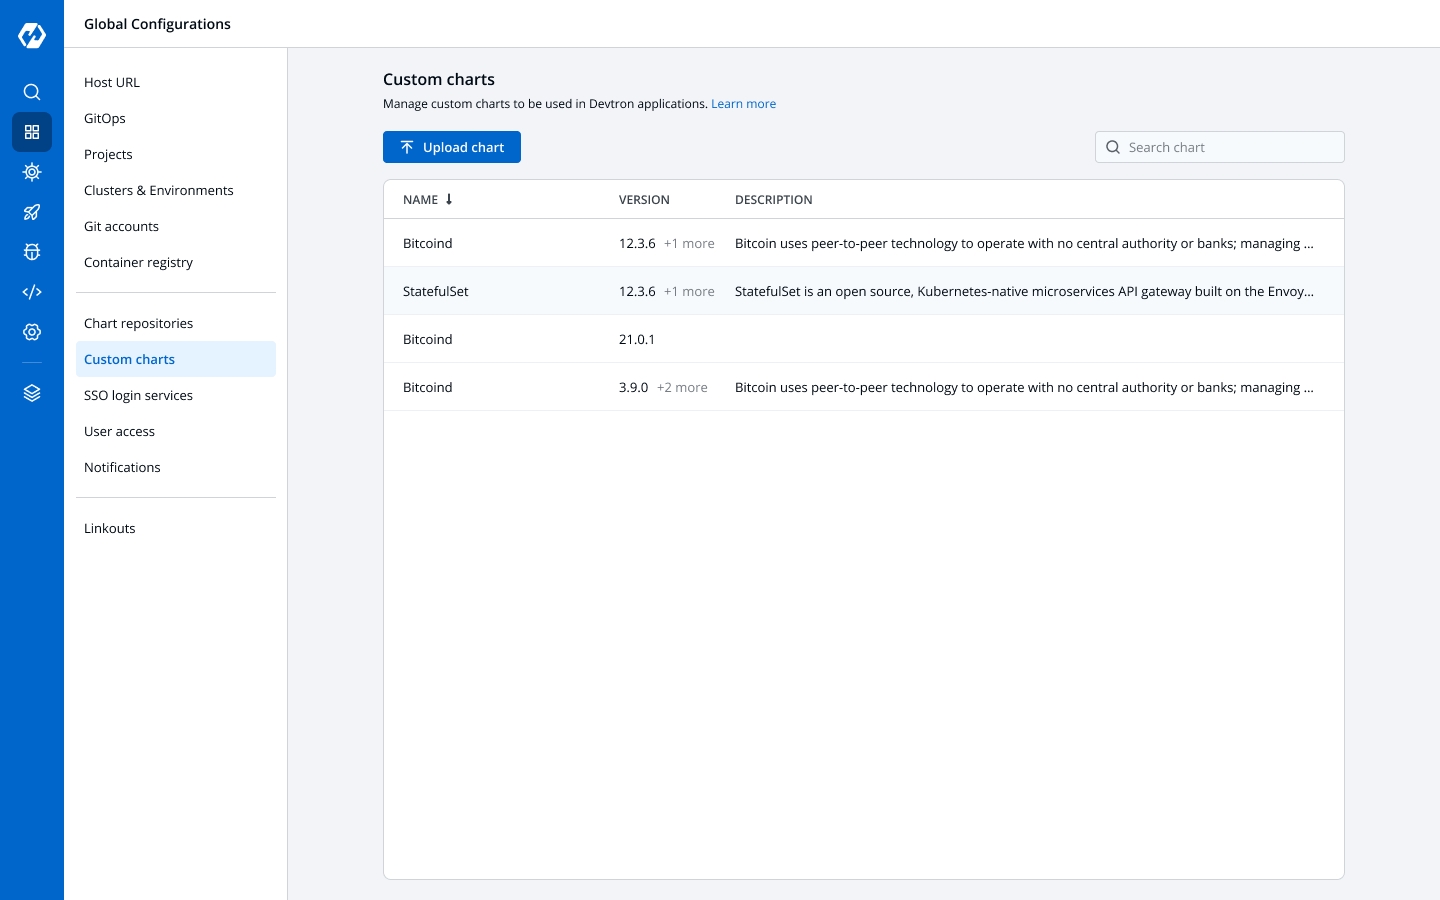
All users can view the custom charts.
To view a list of available custom charts, go to Global Configurations > Custom charts page.
The charts can be searched with their name, version, or description.
Info:
To modify a particular object, it looks in namespace devtroncd for the corresponding configmap as mentioned in the mapping below:
argocd
argocd-override-cm
GitOps
clair
clair-override-cm
container vulnerability db
clair
clair-config-override-cm
Clair configuration
dashboard
dashboard-override-cm
UI for Devtron
gitSensor
git-sensor-override-cm
microservice for Git interaction
guard
guard-override-cm
validating webhook to block images with security violations
postgresql
postgresql-override-cm
db store of Devtron
imageScanner
image-scanner-override-cm
image scanner for vulnerability
kubewatch
kubewatch-override-cm
watches changes in ci and cd running in different clusters
lens
lens-override-cm
deployment metrics analysis
natsOperator
nats-operator-override-cm
operator for nats
natsServer
nats-server-override-cm
nats server
natsStreaming
nats-streaming-override-cm
nats streaming server
notifier
notifier-override-cm
sends notification related to CI and CD
devtron
devtron-override-cm
core engine of Devtron
devtronIngress
devtron-ingress-override-cm
ingress configuration to expose Devtron
workflow
workflow-override-cm
component to run CI workload
externalSecret
external-secret-override-cm
manage secret through external stores like vault/AWS secret store
grafana
grafana-override-cm
Grafana config for dashboard
rollout
rollout-override-cm
manages blue-green and canary deployments
minio
minio-override-cm
default store for CI logs and image cache
minioStorage
minio-storage-override-cm
db config for minio
apiVersion, kind, metadata.name in the multiline string is used to match the object which needs to be modified. In this particular case it will look for apiVersion: extensions/v1beta1, kind: Ingress and metadata.name: devtron-ingress and will apply changes mentioned inside update: as per the example inside the metadata: it will add annotations owner: app1 and inside spec.rules.http.host it will add http://change-me.
Once we have made these changes in our local system we need to apply them to a Kubernetes cluster on which Devtron is installed currently using the below command:
Run the following command to make these changes take effect:
Our changes would have been propagated to Devtron after 20-30 minutes.
The overall resources required for the recommended production overrides are:
cpu
6
memory
13GB
The production overrides can be applied as pre-devtron installation as well as post-devtron installation in the respective namespace.
If you want to install a new Devtron instance for production-ready deployments, this is the best option for you.
Create the namespace and apply the overrides files as stated above:
After files are applied, you are ready to install your Devtron instance with production-ready resources.
If you have an existing Devtron instance and want to migrate it for production-ready deployments, this is the right option for you.
In the existing namespace, apply the production overrides as we do it above.
Chart.yaml is the metadata file that gets created when you create a .
The archive file do not match the .
New by selecting Upload chart.
The custom charts can be used from the section.
The deployment strategy for a custom chart is fetched from the custom chart template and cannot be configured in the .
In certain cases, you may want to override default configurations provided by Devtron. For example, for deployments or statefulsets you may want to change the memory or CPU requests or limit or add node affinity or taint tolerance. Say, for ingress, you may want to add annotations or host. Samples are available inside the directory.
Let's take an example to understand how to override specific values. Say, you want to override annotations and host in the ingress, i.e., you want to change devtronIngress, copy the file . This file contains a configmap to modify devtronIngress as mentioned above. Please note the structure of this configmap, data should have the key override with a multiline string as a value.
In case you want to change multiple objects, for eg in argocd you want to change the config of argocd-dex-server as well as argocd-redis then follow the example in .
To use Devtron for production deployments, use our recommended production overrides located in . This configuration should be enough for handling up to 200 microservices.
his feature helps you manage the notifications for your build and deployment pipelines. You can receive the notifications on Slack or via e-mail.
Click on Global Configurations -> Notifications
Click on Configurations and you will see Devtron support two types of configurations SES Configurations or Slack Configurations.
You can manage the SES configuration to receive e-mails by entering the valid credentials. Make sure your e-mail is verified by SES.
Click on Add and configure SES.
Configuration Name
Give a name to the SES Configuration
Access Key ID
Valid AWS Access Key ID
Secret Access Key
Valid AWS Secret Access Key
AWS Region
Select the AWS Region from the drop-down menu
E-mail
Enter the SES verified e-mail id on which you wish to receive e-mail notifications
Click on Save to save your SES configuration or e-mail ID
You can manage the Slack configurations to receive notifications on your preferred Slack channel.
Click on Add to add new Slack Channel.
Slack Channel
Name of the Slack channel on which you wish to receive notifications.
Webhook URL
Project
Select the project name to control user access
Click on Save and your slack channel will be added.
Click on Add New to receive new notification.
Send To
Select Pipelines
Then, to fetch pipelines of an application, project and environment.
Choose a filter type(environment, project or application)
You will see a list of pipelines corresponding to your selected filter type, you can select any number of pipelines. For each pipeline, there are 3 types of events Trigger, Success, and Failure. Click on the checkboxes for the events, on which you want to receive notifications.
Click on Save when you are done with your Slack notification configuration.
Send To
Click on the Send To box, select your e-mail address/addresses on which you want to send e-mail notifications. Make sure e-mail id are SES Verified.
Select Pipelines
To fetch pipelines of an application, project and environment.
Choose a filter type(environment, project or application)
You will see a list of pipelines corresponding to your selected filter type, you can select any number of pipelines. For each pipeline, there are 3 types of events Trigger, Success, and Failure. Click on the checkboxes for the events, on which you want to receive notifications.
Click on Save once you have configured the e-mail notification.
Use the following command to get the dashboard URL:
You will get the result something as shown below:
The hostname aaff16e9760594a92afa0140dbfd99f7-305259315.us-east-1.elb.amazonaws.com as mentioned above is the Loadbalancer URL where you can access the Devtron dashboard.
You can also do a CNAME entry corresponding to your domain/subdomain to point to this Loadbalancer URL to access it at a custom domain.
devtron.yourdomain.com
CNAME
aaff16e9760594a92afa0140dbfd99f7-305259315.us-east-1.elb.amazonaws.com
For admin login, use the username as admin, and run the following command to get the admin password:
Please make sure that you do not have anything inside namespaces devtroncd, devtron-cd devtron-ci, and devtron-demo as the below steps will clean everything inside these namespaces
Devtron can be updated from the Devtron Stack Manager > About Devtron section.
Select Update to Devtron
The update process may show one of the following statuses, with details available for tracking, troubleshooting, and additional information:
Updating Devtron also updates the installed integrations.
Like any enterprise product, Devtron supports fine grained access control to the resources based on
Type of action allowed on the Devtron resources (Create Vs View)
Sensitivity of the data (Editing image Vs Editing memory)
Access can be added to the User either directly or via Groups.
Devtron supports 5 levels of access:
View: User with view only access has the least privilege. This user can only view combination of environments, applications and helm charts on which access has been granted to the user. This user cannot view sensitive data like secrets used in applications or charts.
Build and Deploy: In addition to view privilege mentioned in above, user with build and deploy permission can build and deploy the image of permitted applications and helm charts to permitted environments.
Admin: User with admin access can create, edit, delete and view permitted applications in permitted projects.
Manager: User with manager access can do everything that an admin type user can do, in addition they can also give and revoke access of users for the applications and environments of which they are manager.
Super Admin: User with super admin privilege has unrestricted access to all Devtron resources. Super admin can create, modify, delete and view any Devtron resource without any restriction; its like Superman without the weakness of Kryptonite. Super Admin can also add and delete user access across any Devtron resource, add delete git repository credentials, container registry credentials, cluster and environment.
To control the access of User and Group-
Go to the left main panel -> Select Global Configurations -> Select User Access
Click on Add User, to add one or multiple users.
When you click on Add User, you will see 6 options to set permission for users which are as follow:
Email addresses
Assign super admin permissions
Group Permissions
Devtron Apps Permissions
Project
Environment
Applications
Roles
Helm Apps Permissions
Project
Environment or cluster/namespace
Applications
Permission
Chart group permissions
In the Email address box, you have to provide the mail ID of the user to whom you want to give access to your applications.
IMP Please note that Email address should be same as that in the email field in the JWT token returned by OIDC provider.
Click on Save and your user will be saved with super admin permissions.
We suggest that super admin privileges should be given to only select few.
If you don’t want to assign super admin permissions then you have to provide the rest of the information.
Access to devtron applications can be given to user by attaching permission directly to his/her email id through the Devtron Apps section. This section has 4 options to manage the permissions of your users.
Project
Select a project from the drop-down to which you want to give permission to the users. You can select only one project at a time if you want to select more than one project then click Add row.
Environment
In the Environment section, you can select one or more than one or all environments at a time. Click on the environment section, you will see a drop-down of your environments and select any environment on which you want to give permission to the user.
IMP If all environments option is selected then user gets access to all current environments and any new environment which gets associated with this application later.
Applications
Similarly, you can select Applications from the drop-down corresponding to your selected Environments. In this section, you can also give permissions to one or more than one or to all applications at a time.
IMP If all applications option is selected then user gets access to all current applications and any new application which gets associated with this project later.
Roles
Inside the Role, you actually choose which type of permissions you want to give to the users.
You can add multiple rows, for Devtron app permission.
Once you have finished assigning the appropriate permissions for the listed users, Click on Save.
Access to devtron applications can be given to user by attaching permission directly to his/her email id through the Devtron Apps section. This section has 4 options to manage the permissions of your users.
Project
Select a project from the drop-down to which you want to give permission to the users. You can select only one project at a time if you want to select more than one project then click Add row.
Environment or cluster/namespace
In the Environment section, you can select one or more than one or all environments at a time. Click on the environment section, you will see a drop-down of your environments and select any environment on which you want to give permission to the user.
IMP If all environments option is selected then user gets access to all current environments and any new environment which gets associated with this application later.
Applications
Similarly, you can select Applications from the drop-down corresponding to your selected Environments. In this section, you can also give permissions to one or more than one or to all applications at a time.
IMP If all applications option is selected then user gets access to all current applications and any new application which gets associated with this project later.
Permission
Inside the Role, you actually choose which type of permissions you want to give to the users.
You can also manage the access of users to Chart Groups in your project.
NOTE: You can only give users the ability to create or edit, not both.
Click on the checkbox of Create, if you want the users to create, view, edit, or delete the chart groups.
To permit a user to only edit the chart groups, check Specific chart group from Edit drop-down. In the following field, select the chart group for which you want to grant the user edit permission.
Go to Edit drop-down, if you want to allow or deny users to edit the chart groups.
Select on Deny option from the drop-down, if you want to restrict the users to edit the chart groups.
Select the Specific Charts option from the drop-down and then select the chart groups for which you want to allow users to edit, from the other drop-down menu.
Click on Save, once you have configured all the required permissions for the users.
You can edit the user permissions, by clicking on the downward arrow.
Then you can edit the user permissions here.
After you have done editing the user permissions, click on Save.
If you want to delete the user/users with particular permissions, click on Delete.
Enter the valid
When you click on the Send to box, a drop-down will appear, select your slack channel name if you have already configured Slack Channel. If you have not yet configured the Slack Channel, Click on
If you have not yet configured SES, Click on
This page helps you to install Devtron without any integrations. Integrations can be added later using .
Install if you haven't done that already!
To use the CI/CD capabilities with Devtron, users can Install the .
If you check the option Assign super admin permissions, the user will get full access to your system and the rest of the options will disappear. Please check to see permission levels. Only users with super admin permissions can assign super admin permissions to a user.
There are four different view access levels/Role available for both User and Group as described :
There are four different view access levels/Role available for both User and Group as described :
View
Yes
No
No
No
No
Build and Deploy
Yes
No
No
No
Yes
Admin
Yes
Yes
Yes
Yes
Yes
Manager
Yes
Yes
Yes
Yes
Yes
Super Admin
Yes
Yes
Yes
Yes
Yes
View Only
Yes
No
No
No
Build and Deploy
Yes
No
No
No
Admin
Yes
Yes
Yes
Yes
Manager
Yes
Yes
Yes
Yes
Super Admin
Yes
Yes
Yes
Yes
Manager
Yes
Yes
Yes
Super Admin
Yes
Yes
Yes
Super Admin
Yes
Yes
Yes
View
Only can view chart groups
Create
Can create, view, edit or delete
Edit
Deny: Can't edit chart groups
Specific chart groups: can edit specific chart group
If you want to check the current version of Devtron you are using, please use the following command.
5.1 Upgrade Devtron to latest version
OR
5.2 Upgrade Devtron to a custom version. You can find the latest releases from Devtron on Github https://github.com/devtron-labs/devtron/releases
If you want to check the current version of Devtron you are using, please use the following command.
5.1 Upgrade Devtron to latest version
OR
5.2 Upgrade Devtron to a custom version. You can find the latest releases from Devtron on Github https://github.com/devtron-labs/devtron/releases
Delete the respective resources i.e, nats-operator , nats-streaming and nats-server using the following commands.
Verify the deletion of resources using the following commands.
Set reSync: true in the installer object, this will initiate upgrade of the entire Devtron stack, you can use the following command to do this.
Initializing
The update is being initialized.
Updating
Devtron is being updated to the latest version.
Failed
Unknown
Status is unknown at the moment and will be updated shortly.
Request timed out
Git Accounts allow you to connect your code source with Devtron. You will be able to use these git accounts to build the code using the CI pipeline.
Global Configuration helps you to add a Git provider. Click on Add git account button at the top of the Git Account Section. To add a new git provider, add the details as mentioned below.
Name
Git Host
URL
Authentication type
Provide a Name to your Git provider. This name will be displayed in the the Git Provider drop-down inside the Git Material configuration section.
It is the git provider on which corresponding application git repository is hosted. By default you will get Bitbucket and GitHub but you can add many as you want clicking on [+ Add Git Host].
Here provide the type of authentication required by your version controller. Devtron supports three types of authentications. You can choose the one that suits you the best.
Anonymous
If authentication type is set as Anonymous then you do not need to provide any username, password/authentication token or SSH key. Just click on Save to save the git account provider details.
If authentication type is set as
Anonymous, only public git repository will be accessible.
User Auth
If you select User Auth then you have to provide the Username and either of Password or Auth Token for the authentication of your version controller account. Click on Save to save the git account provider details.
SSH Key
If you choose SSH Key then you have to provide the Private SSH Key corresponding to the public key added in your version controller account. Click on Save to save the git account provider details.
You can update your saved git account settings at anytime. To update the git account:
Click on the git account which you want to update.
Make the required changes
Click on Update to save the changes.
Updates can only be made within one Authentication type or one protocol type, i.e. HTTPS(Anonymous or User Auth) & SSH. You can update from Anonymous to User Auth & vice versa, but not from Anonymous/User Auth to SSH or reverse.
Disabled git accounts will be unavailable for use in future applications. Applications already using a disabled git account will not be affected.
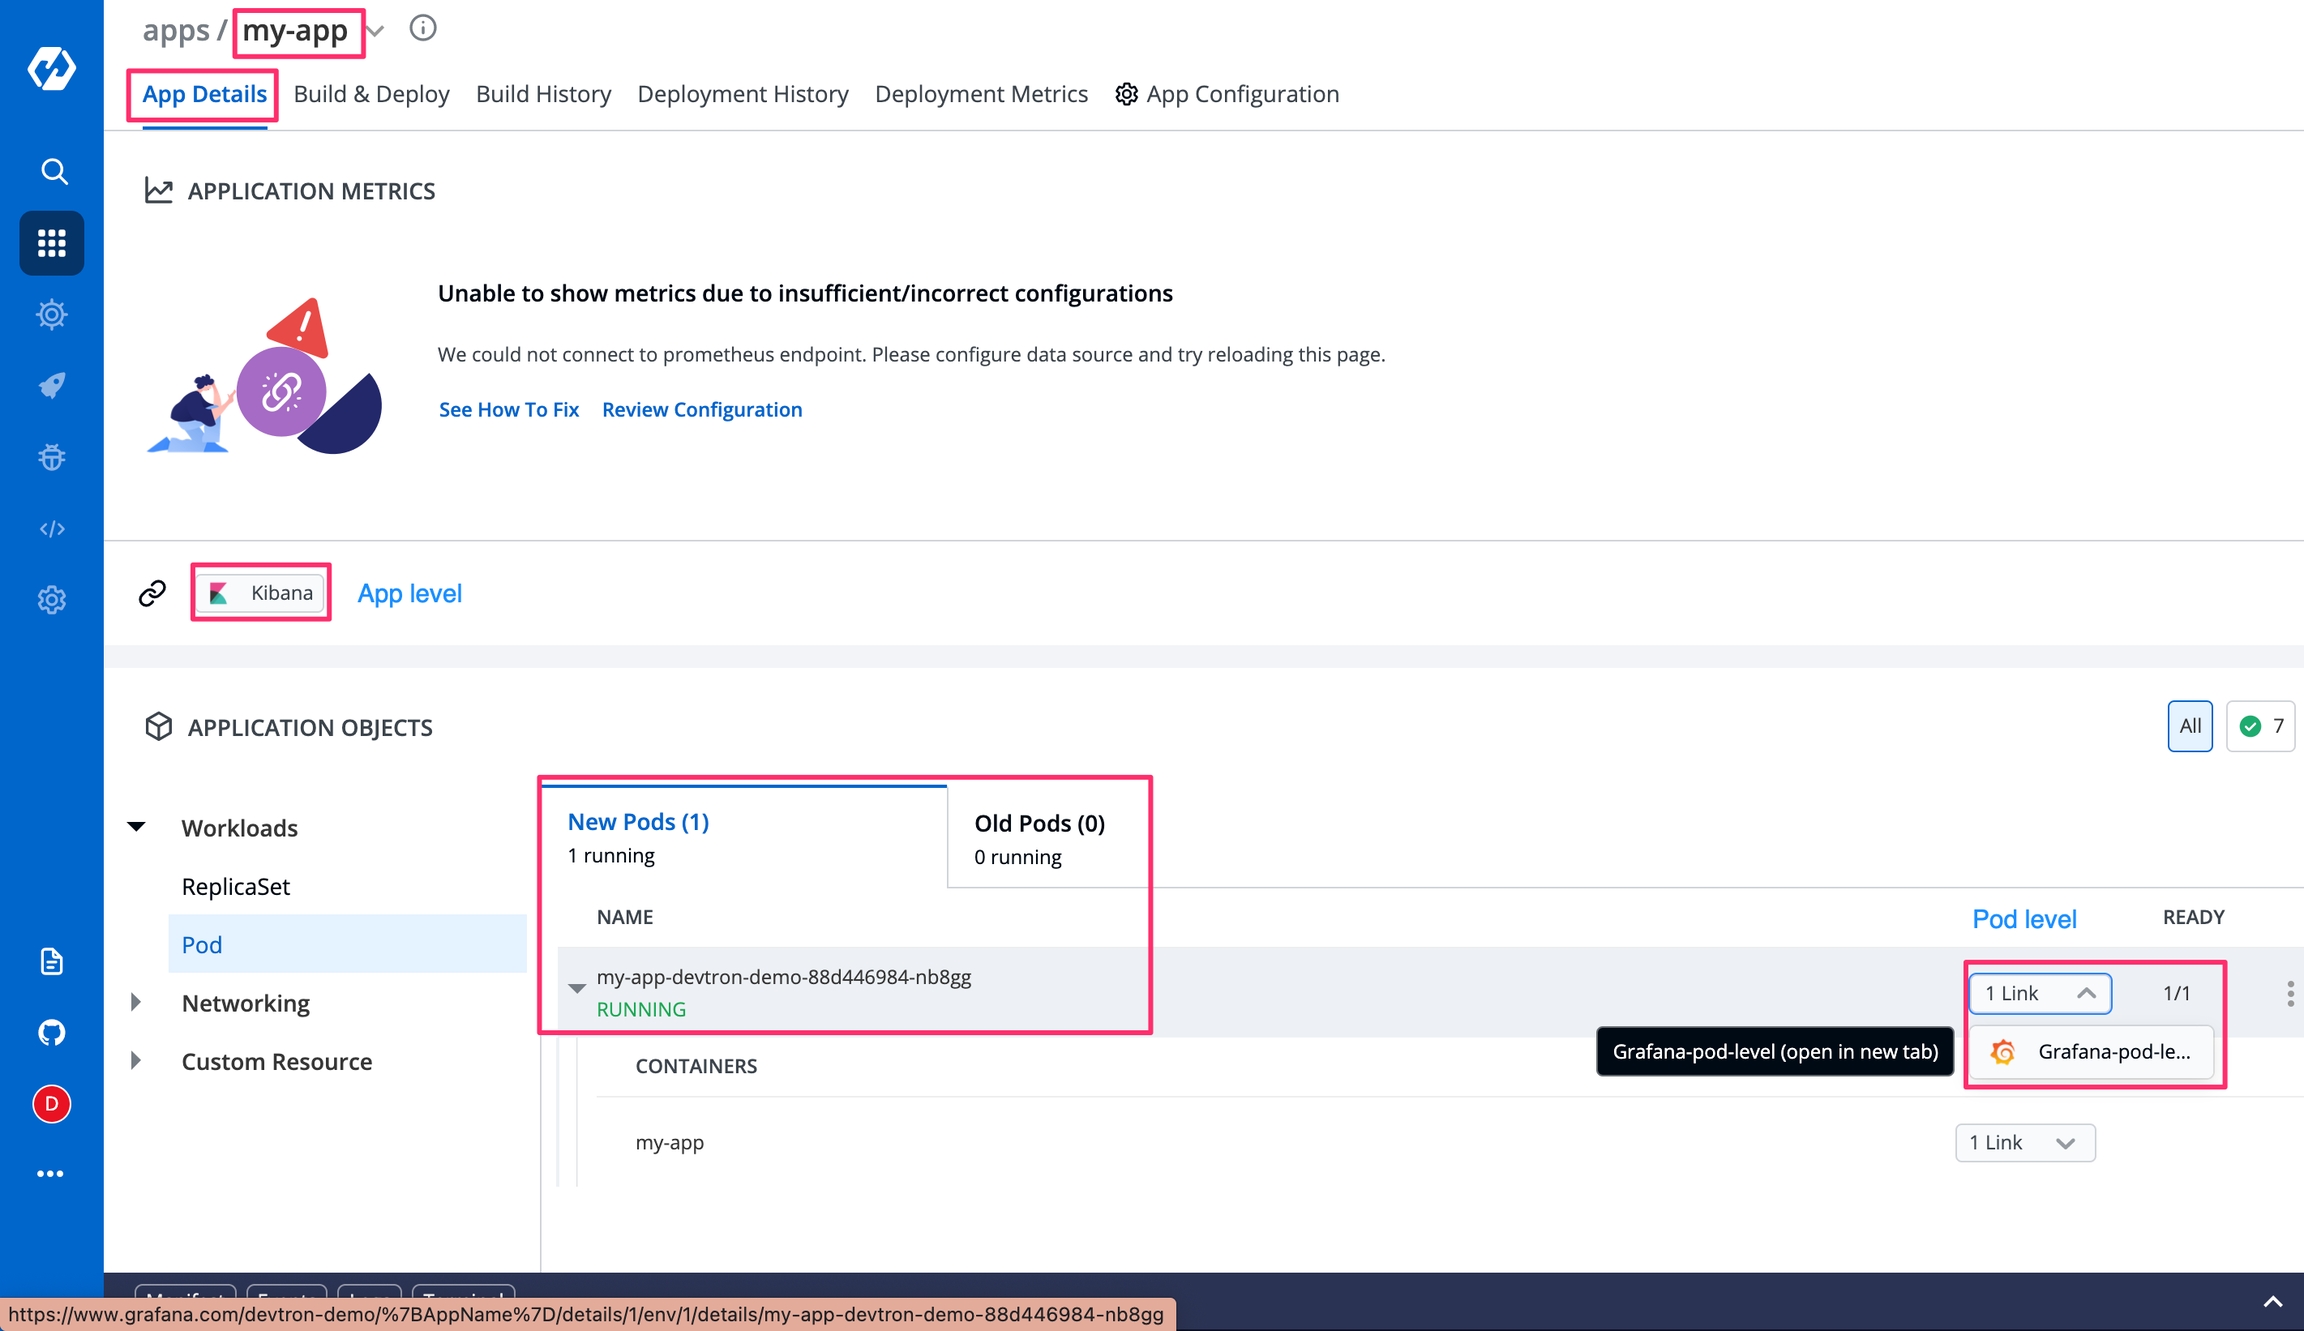
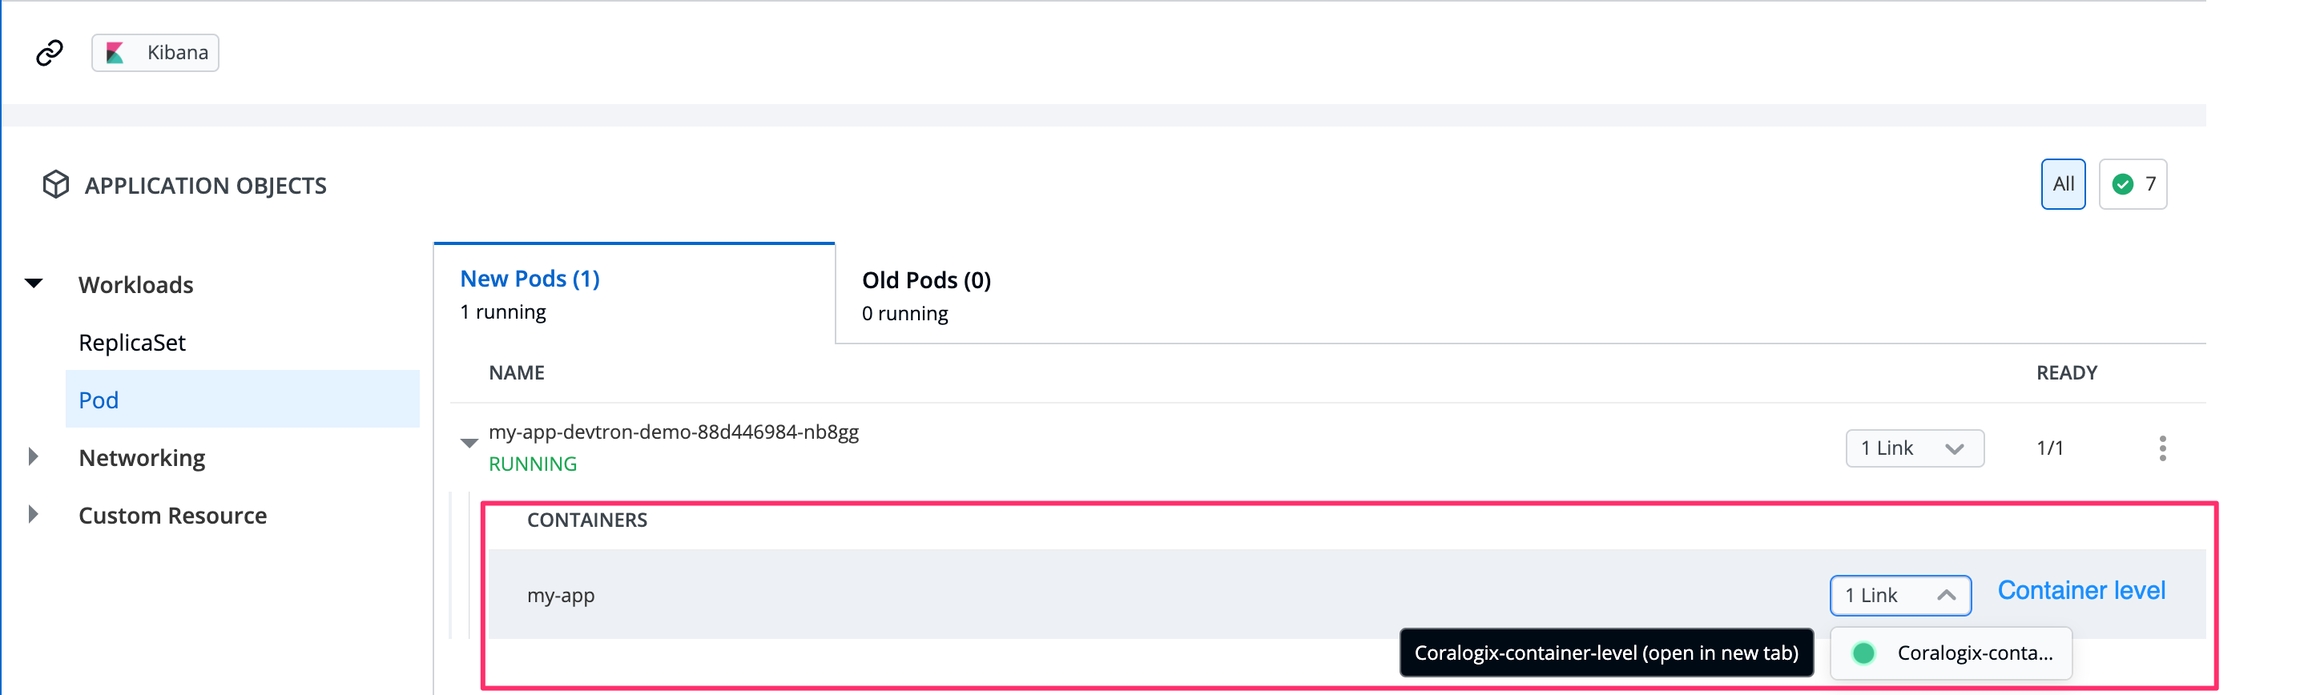
External links allow you to connect to the third-party Monitoring Tools within your Devtron dashboard for seamlessly monitoring/debugging/logging/analyzing your applications. The Monitoring Tool is available as a bookmark at various component levels, such as application, pods, and container.
To monitor/debug an application using a specific Monitoring Tool (such as Grafana, Kibana, etc.), you may need to navigate to the tool's page, then to the respective app/resource page.
External links take you directly to the tool's page, which includes the context of the application, environment, pod, and container.
Before you begin, configure an application in the Devtron dashboard.
Super admin access*
Monitoring tool URL
On the Devtron dashboard, select Global Configurations from the left navigation pane.
Select External links.
Select Add link.
On the Add link page, enter the following fields:
Monitoring Tool
Select a Monitoring Tool from the drop-down list. To add a different tool, select 'Other'.
Name
Enter a user-defined name for the Monitoring Tool
Clusters
Choose the clusters for which you want to configure the selected tool.
Select more than one cluster name, to enable the link on multiple clusters
Select 'Cluster: All', to enable the link on the existing clusters and future clusters
URL Template
The configured URL Template is used by apps deployed on the selected clusters. By combining one or more of the env variables, a URL with the structure shown below can be created: http://www.domain.com/{namespace}/{appName}/details/{appId}/env/{envId}/details/{podName} The env variables:
{appName}
{appId}
{envId}
{namespace}
Note: The env variables will be dynamically replaced by the values that you used to configure the link.
Note: To add multiple links, select + Add another at the top-left corner.
Select Save.
On this page, the configured external links can be filtered/searched, as well as edited/deleted.
Select Global Configurations > External links.
Filter and search the links based on the tool's name or a user-defined name.
Edit a link by selecting the edit icon next to an external link.
Delete an external link by selecting the delete icon next to a link. The bookmarked link will be removed in the clusters for which it was configured.
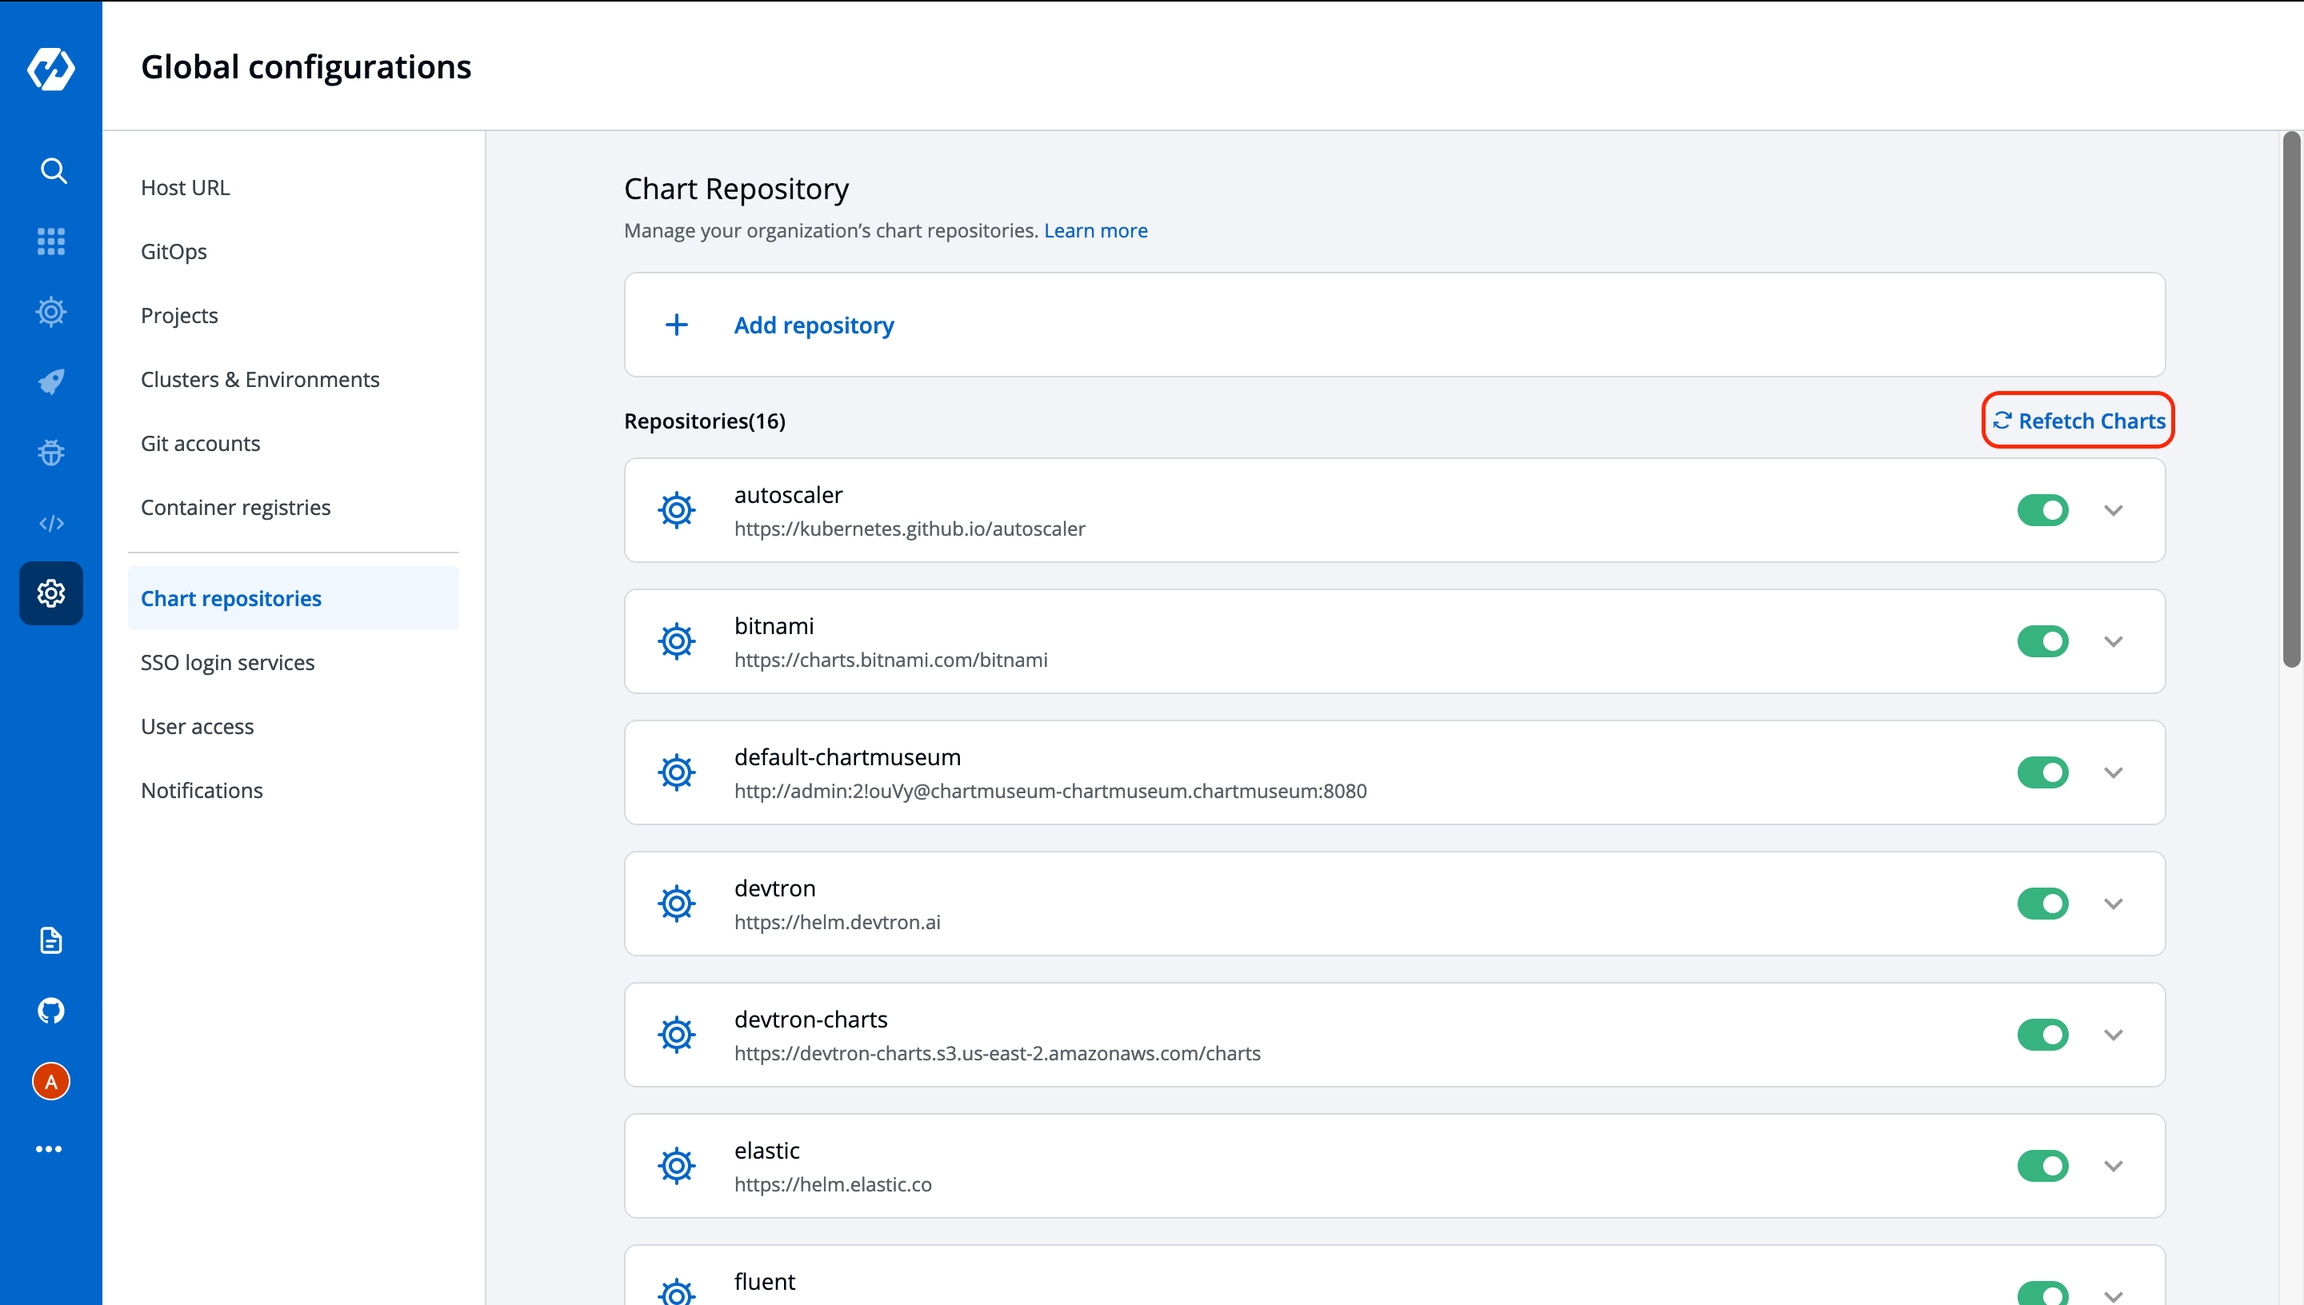
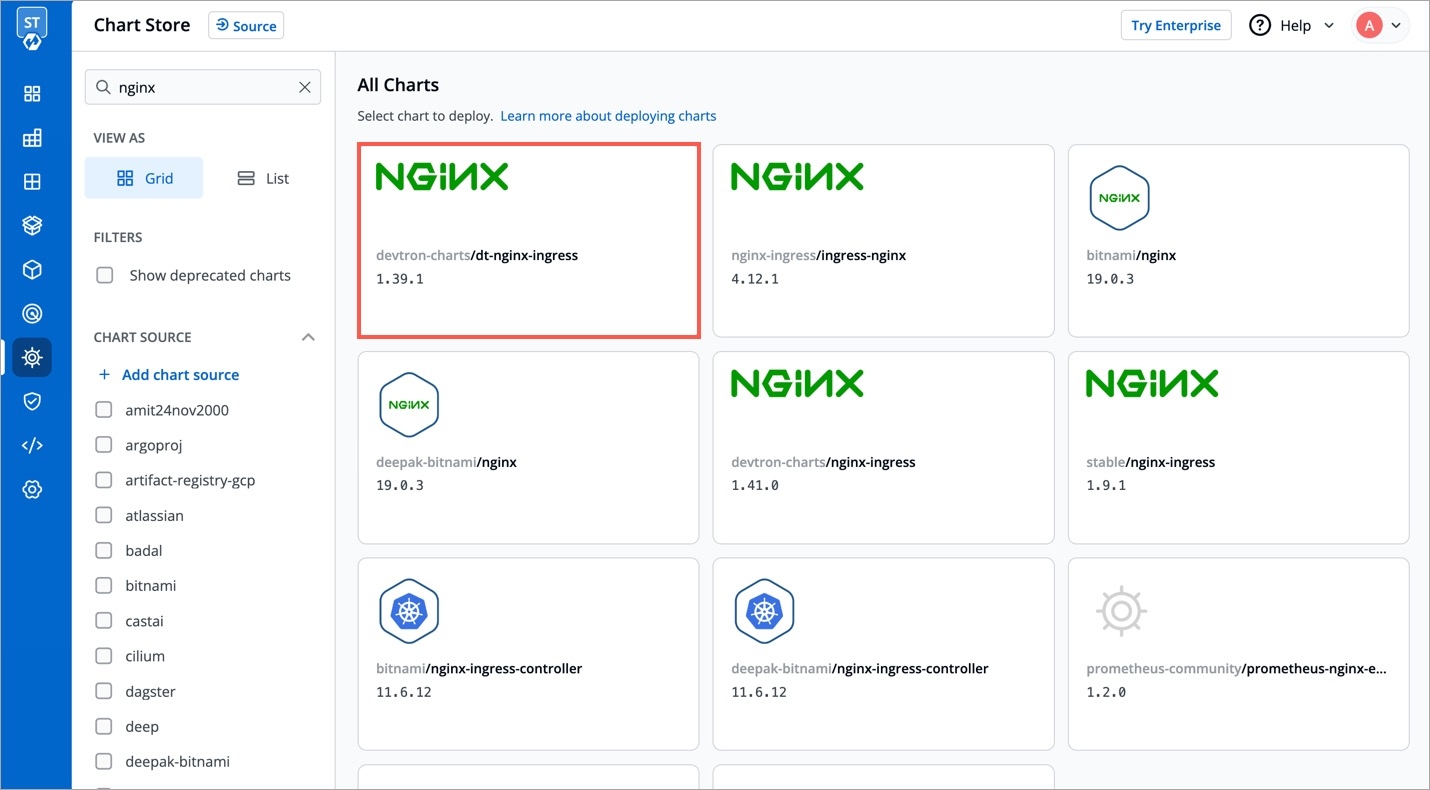
This feature allows you to add more chart repositories to Devtron. Once added they will be available in the Discover section of the Chart Store.
Note : After the successfull installation of Devtron, click on
Refresh Chartsto sync & download all the default charts listed on the dashboard.
Select the Chart Repository section of global configuration and click on Add Repository button at the top of the Chart Repository Section. To add new chart, you need to provide three inputs as below:
Name
URL
Authentication type
Provide a Name to your Chart Repository. This name is added as prefix to the name of the chart in the listing on the helm chart section of application.
Here you have to provide the type of Authentication required by your version controller. We support three types of authentications, You can choose the one that suits you the best.
Anonymous
If you select Anonymous then you do not have to provide any username, password, or authentication token. Just click on Save to save your chart repository details.
Password/Auth token
If you select Password/Auth token, then you have to provide the Access Token for the authentication of your version controller account inside the Access token box. Click on Save to save your chart repository details.
User Auth
If you choose User Auth then you have to provide the Username and Password of your version controller account. Click on Save to save your chart repository details.
You can update your saved chart repository settings at any point in time. Just click on the chart repository which you want to update. Make the required changes and click on Update to save you changes.
Note: You can enable and disable your chart repository setting. If you enable it, then you will be able to see that enabled chart in
Discoversection ofChart Store.
Update failed. You may retry the upgrade or .
The request to install has hit the maximum number of retries. You may retry the installation or for further assistance.
Provide the URL. For example- for Github, for GitLab, etc.
You can enable or disable a git account. Enabled git accounts will be available to be used in Application configuration > .
*External links can only be added/managed by a super admin, but other users can on their app's page.
{podName}: If used, the link will only be visible at the pod level on the page.
{containerName}: If used, the link will only be visible at the container level on the page.
The users (admin and others) can access the configured external link from the page.
Learn more about
Provide the URL. For example- github.com for Github, for GitLab, etc.
Learn more about
In the previous step, we discussed Git Configurations. In this section, we will provide information on the Docker Build Configuration.
Docker build configuration is used to create and push docker images in the docker registry of your application. You will provide all the docker related information to build and push docker images in this step.
To add docker build configuration, You need to provide three sections as given below:
Image store
Checkout path
Advanced
In Image store section, You need to provide two inputs as given below:
Docker registry
Docker repository
In this field, add the name of your docker repository. The repository that you specify here will store a collection of related docker images. Whenever an image is added here, it will be stored with a new tag version.
If you are using docker hub account, you need to enter the repository name along with your username. For example - If my username is kartik579 and repo name is devtron-trial, then enter kartik579/devtron-trial instead of only devtron-trial.
Checkout path including inputs:
Git checkout path
Docker file (relative)
In this field, you have to provide the Git checkout path of your repository. This repository is the same that you had defined earlier in git configuration details.
Here, you provide a relative path where your docker file is located. Ensure that the dockerfile is present on this path.
Before selecting a custom target platform, please ensure that the architecture and the operating system is supported by the registry type you are using, otherwise builds will fail. Devtron uses BuildX to build images for mutiple target Platforms, which requires higher CI worker resources. To allocate more resources, you can increase value of the following parameters in the devtron-cm configmap in devtroncd namespace.
LIMIT_CI_CPU
REQ_CI_CPU
REQ_CI_MEM
LIMIT_CI_MEM
To edit the devtron-cm configmap in devtroncd namespace:
If target platform is not set, Devtron will build image for architecture and operating system of the k8s node on which CI is running.
The Target Platform feature might not work in minikube & microk8s clusters as of now.
Docker build arguments is a collapsed view including
Key
Value
Only one docker image can be created even for multi-git repository applications as explained in the .
Select the docker registry that you wish to use. This registry will be used to .
Using this option, users can build images for a specific or multiple architectures and operating systems (target platforms). They can select the target platform from the drop-down or can type to select a custom target platform.
This field will contain the key parameter and the value for the specified key for your . This field is Optional. (If required, this can be overridden at later)
Projects are nothing but a logical grouping of your applications so that you can manage and control the access level of users. We will discuss User Access in the next step.
Click on the Projects inside the Global configuration tab. Click on Add projects and give a name to your project and press the Save button to save your project


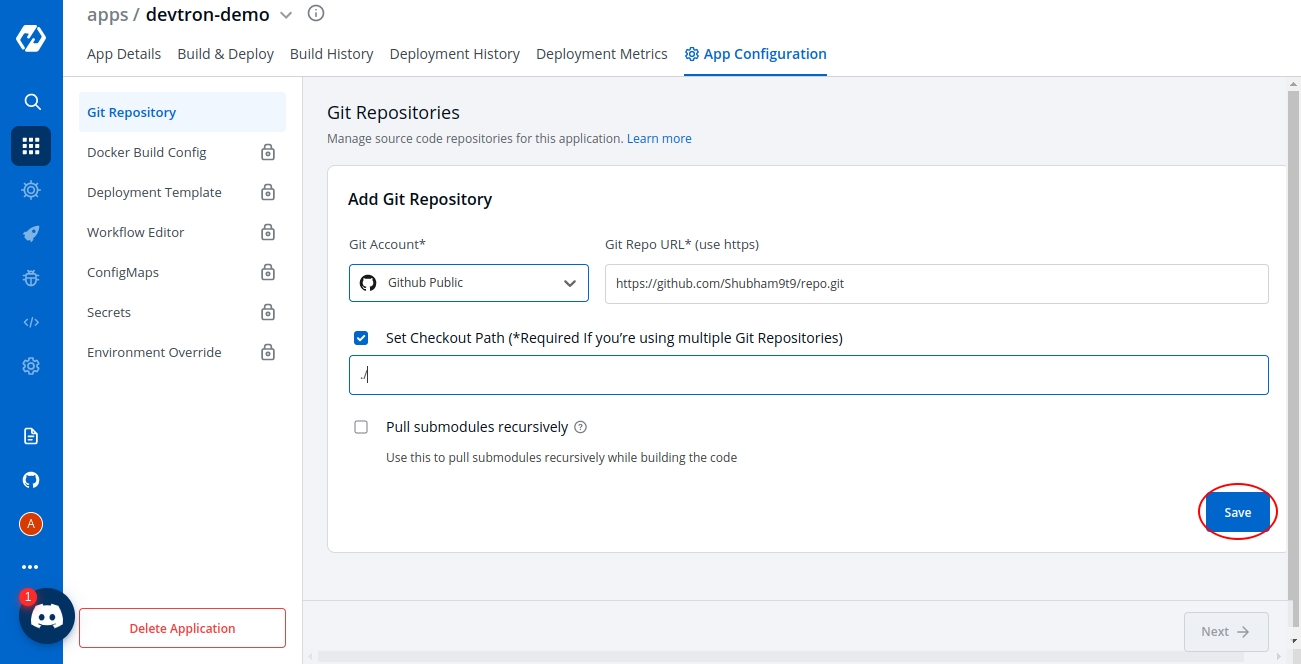
Git Repository is used to pull your application source code during the CI step. Select Git Repository section of the App Configuration. Inside Git Repository when you click on Add Git Repository you will see three options as shown below:
Git Account
Git Repo URL
Checkout Path
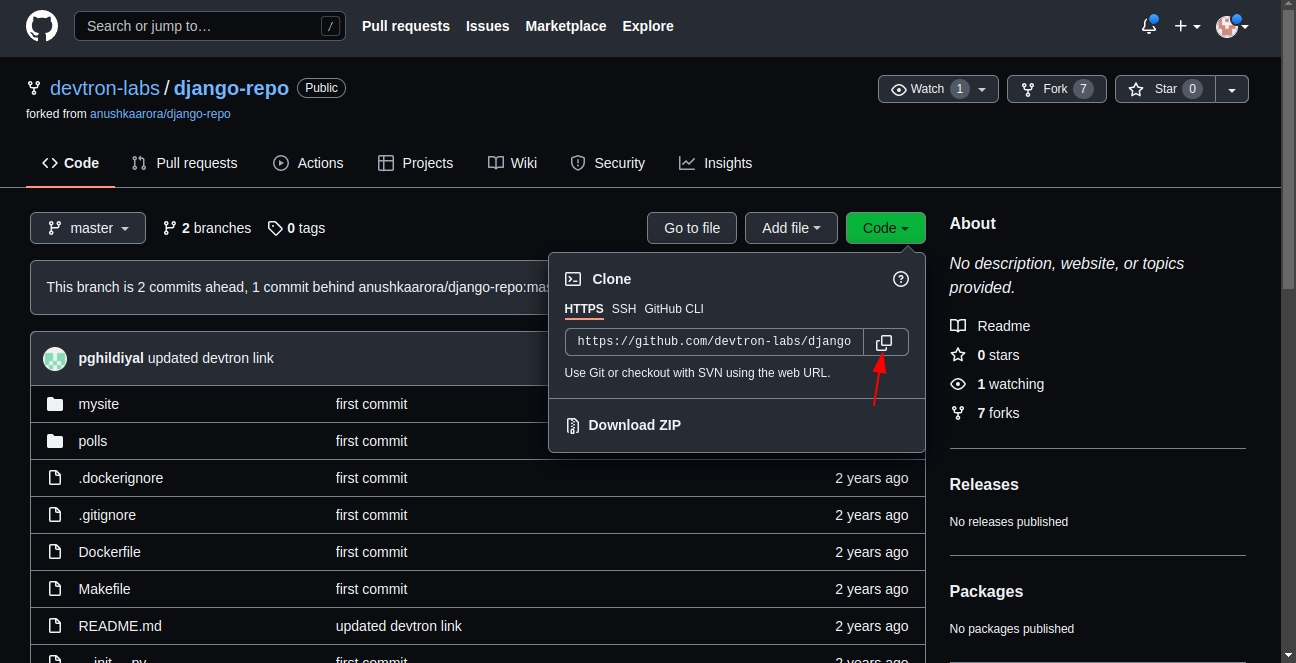
You can find this URL by clicking on the '⤓ code' button on your git repository page.
Note:
Copy the HTTPS/SSH url of the repository
After clicking on checkbox, git checkout path field appears. The git checkout path is the directory where your code is pulled or cloned for the repository you specified in the previous step.
This field is optional in case of a single git repository application and you can leave the path as default. Devtron assigns a directory by itself when the field is left blank. The default value of this field is ./
If you want to go with a multi-git approach, then you need to specify a separate path for each of your repositories. The first repository can be checked out at the default ./ path as explained above. But, for all the rest of the repositories, you need to ensure that you provide unique checkout paths. In failing to do so, you may cause Devtron to checkout multiple repositories in one directory and overwriting files from different repositories on each other.
As we discussed, Devtron also supports multiple git repositories in a single application. To add multiple repositories, click on add repo and repeat steps 1 to 3. Repeat the process for every new git repository you add. Ensure that the checkout paths are unique for each.
Let’s look at this with an example:
Due to security reasons, you may want to keep sensitive configurations like third party API keys in a separate access restricted git repositories and the source code in a git repository that every developer has access to. To deploy this application, code from both the repositories is required. A multi-git support will help you to do that.
Few other examples, where you may want to have multiple repositories for your application and will need multi git checkout support:
To make code modularize, you are keeping front-end and back-end code in different repositories.
Common Library extracted out in different repo so that it can be used via multiple other projects.
Due to security reasons you are keeping configuration files in different access restricted git repositories.
The checkout path is used by Devtron to assign a directory to each of your git repositories. Once you provide different checkout paths for your repositories, Devtron will clone your code at those locations and these checkout paths can be referenced in the docker file to create docker image for the application. Whenever a change is pushed to any the configured repositories, the CI will be triggered and a new docker image file will be built based on the latest commits of the configured repositories and pushed to the container registry.
Devtron also supports multiple git repositories in a single deployment. We will discuss this in detail in the multi git option .
In this section, you have to select the git account of your code repository. If the authentication type of the Git account is anonymous, only public git repository will be accessible. If you are using a private git repository, you can configure your git provider via .
Inside the git repo URL, you have to provide your code repository’s URL. For Example-
Please make sure that you've added your in the repo.
This checkbox is optional and is used for pulling present in a repo. The submodules will be pulled recursively and same auth method which is used for parent repo will be used for submodules.
Note: Even if you add multiple repositories, only one image will be created based on the docker file as shown in the .


A deployment configuration is a manifest for the application. It defines the runtime behavior of the application.
Devtron includes deployment template for both default as well as custom charts created by a super admin.
To configure a deployment chart for your application:
Go to Applications and create a new application.
Go to App Configuration page and configure your application.
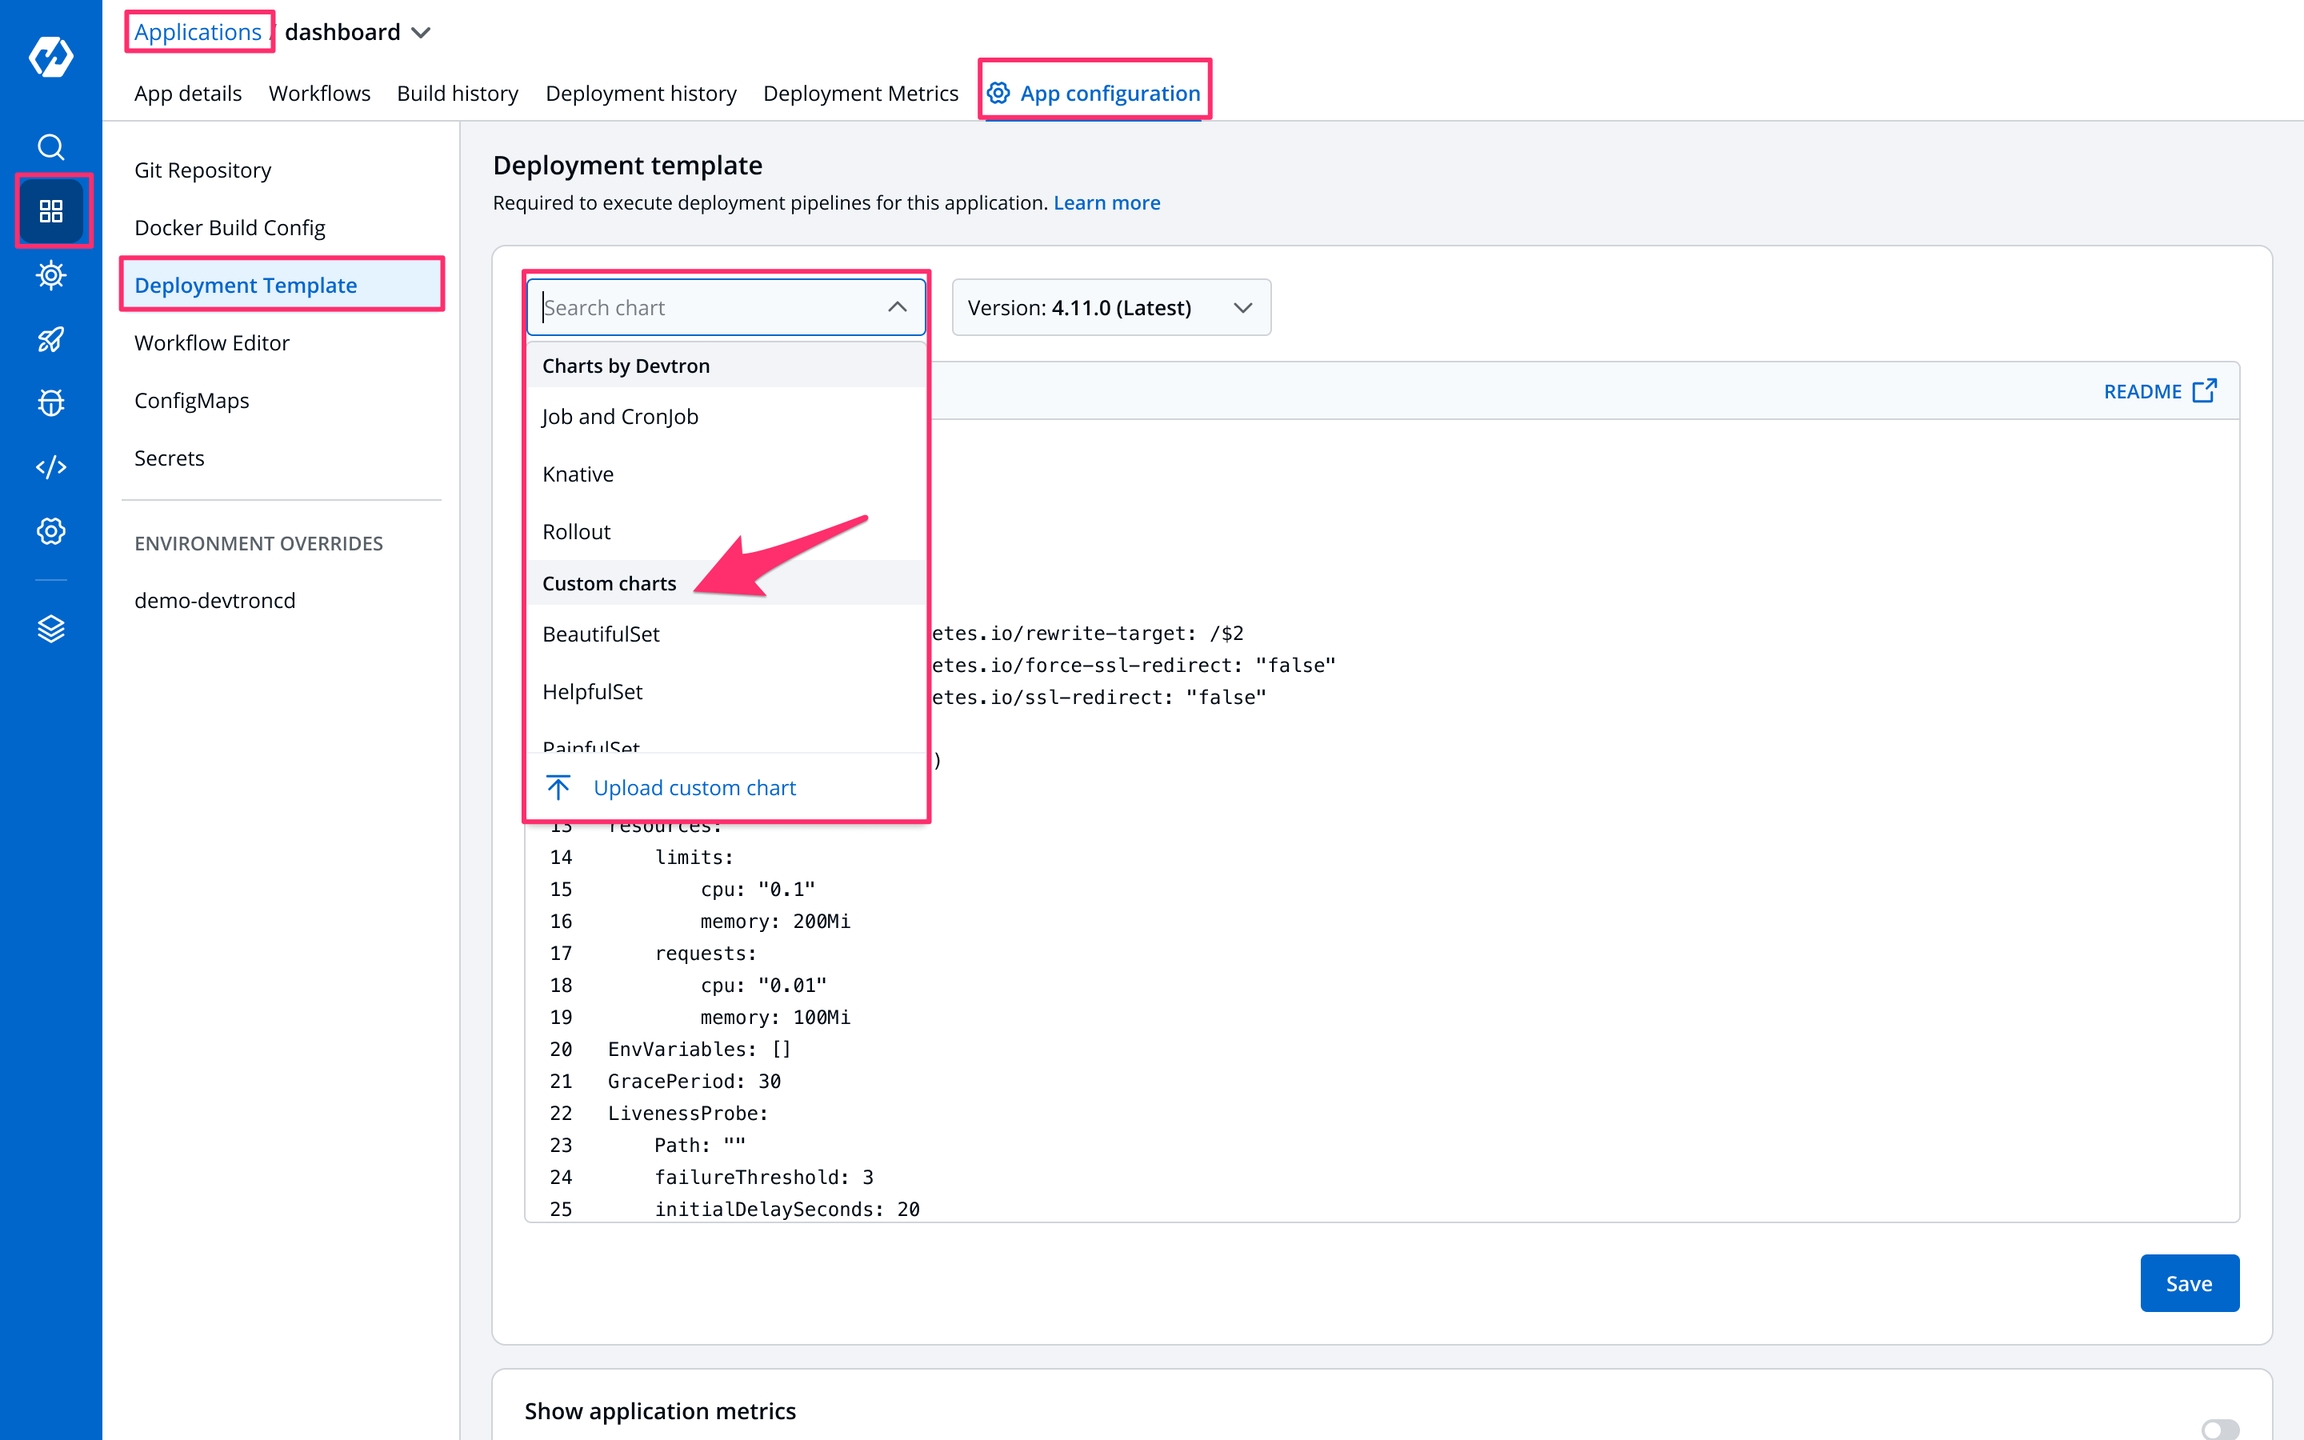
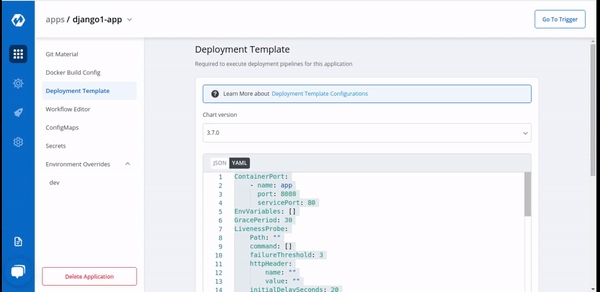
On the Deployment Template page, select the drop-down under Chart type.
You can select a chart in one of the following ways:
Knative
Users can select the available custom charts from the drop-down list.
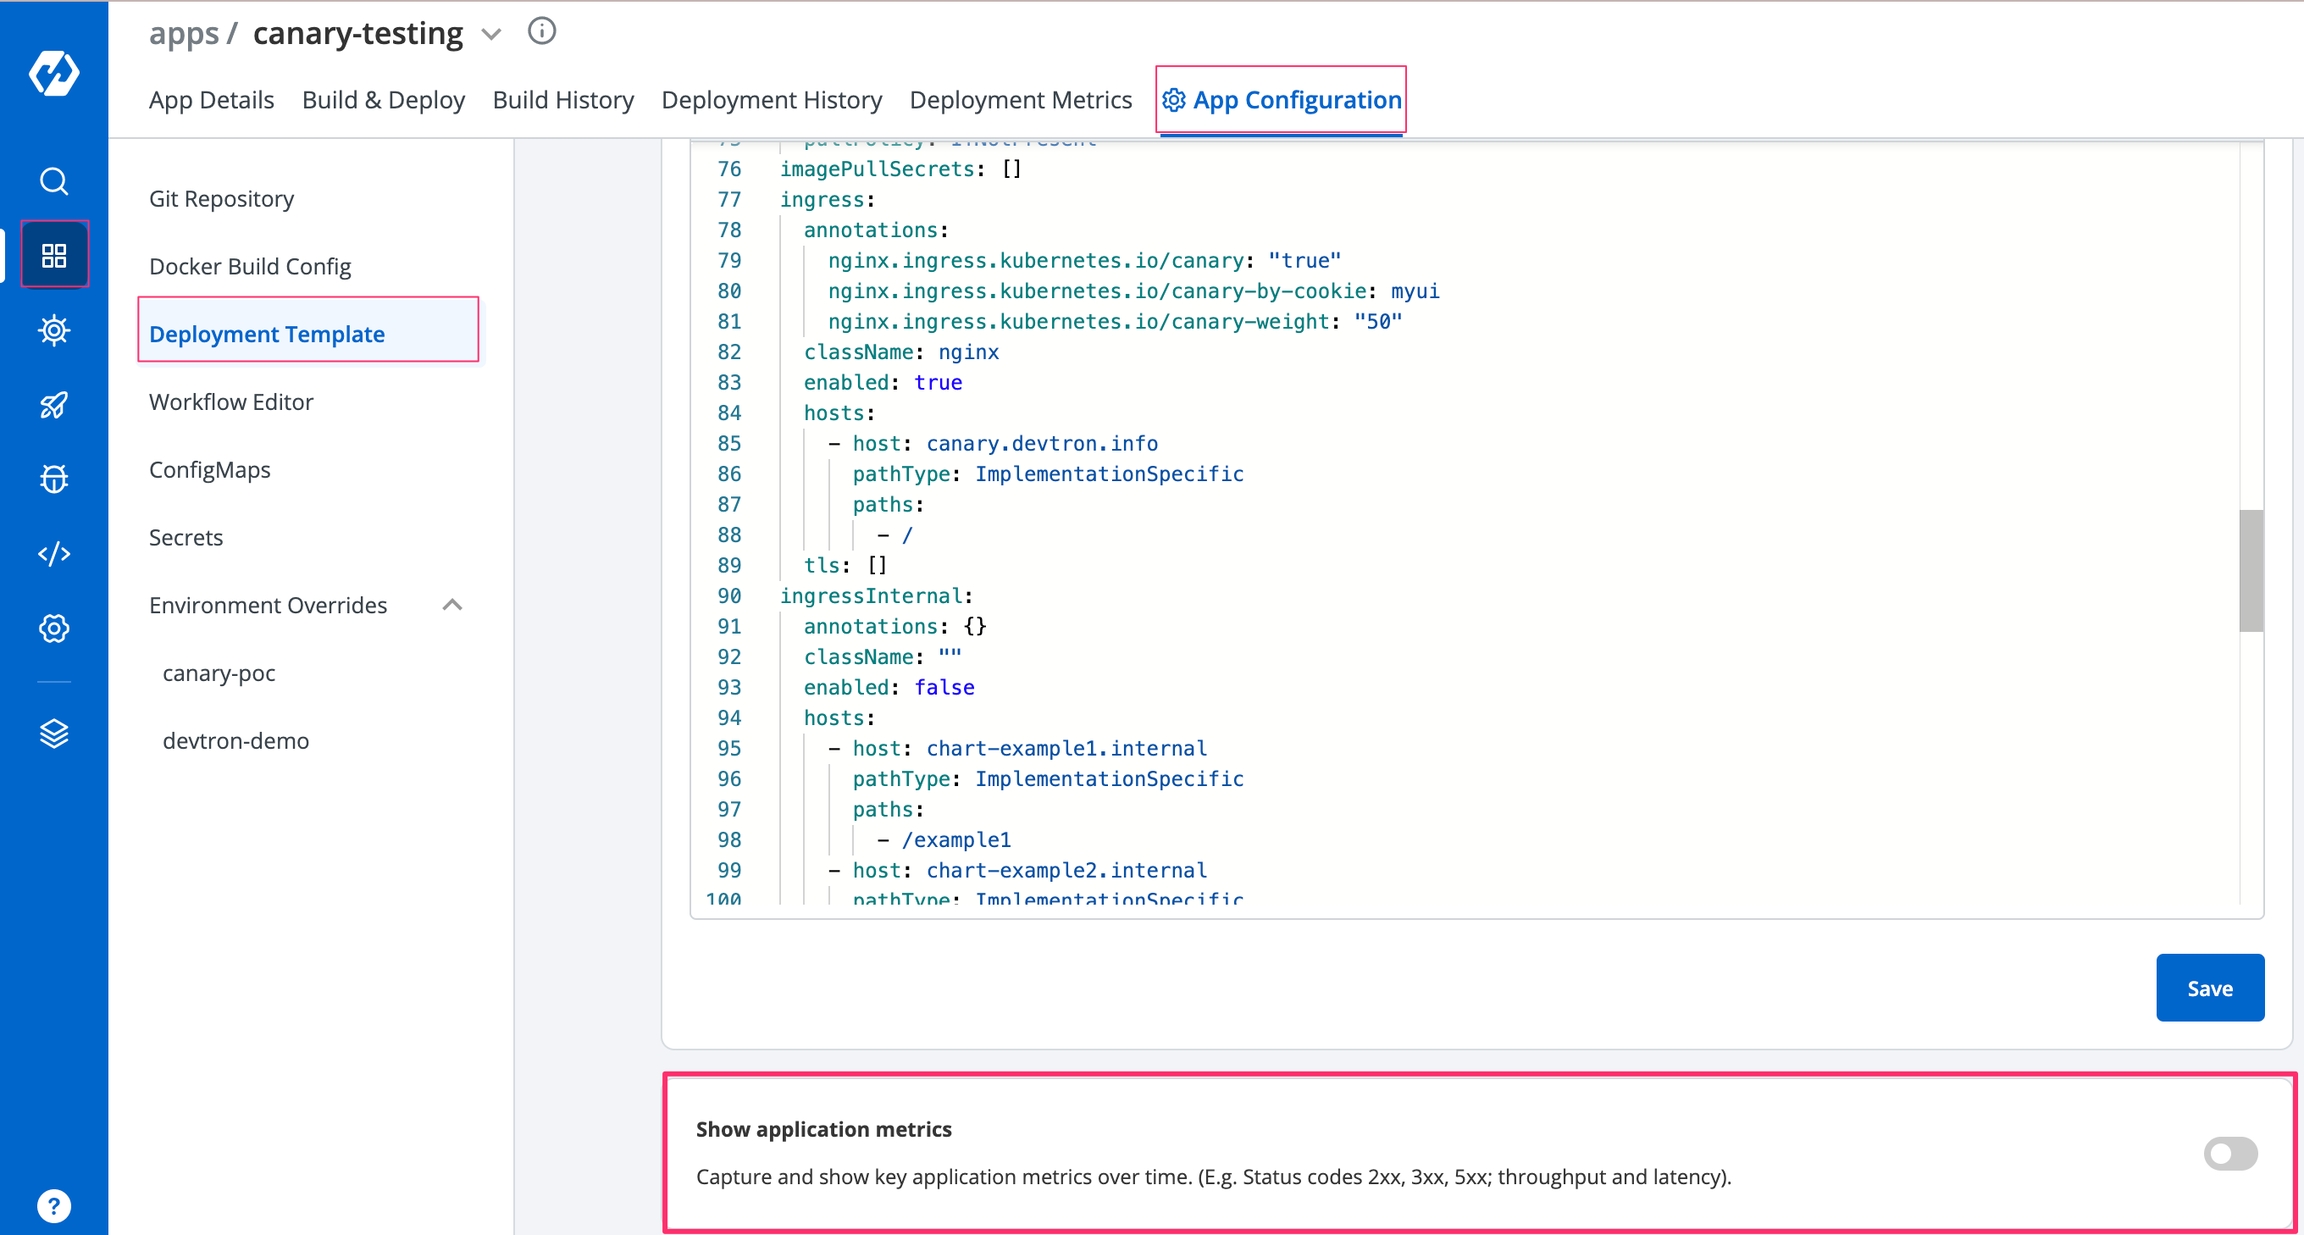
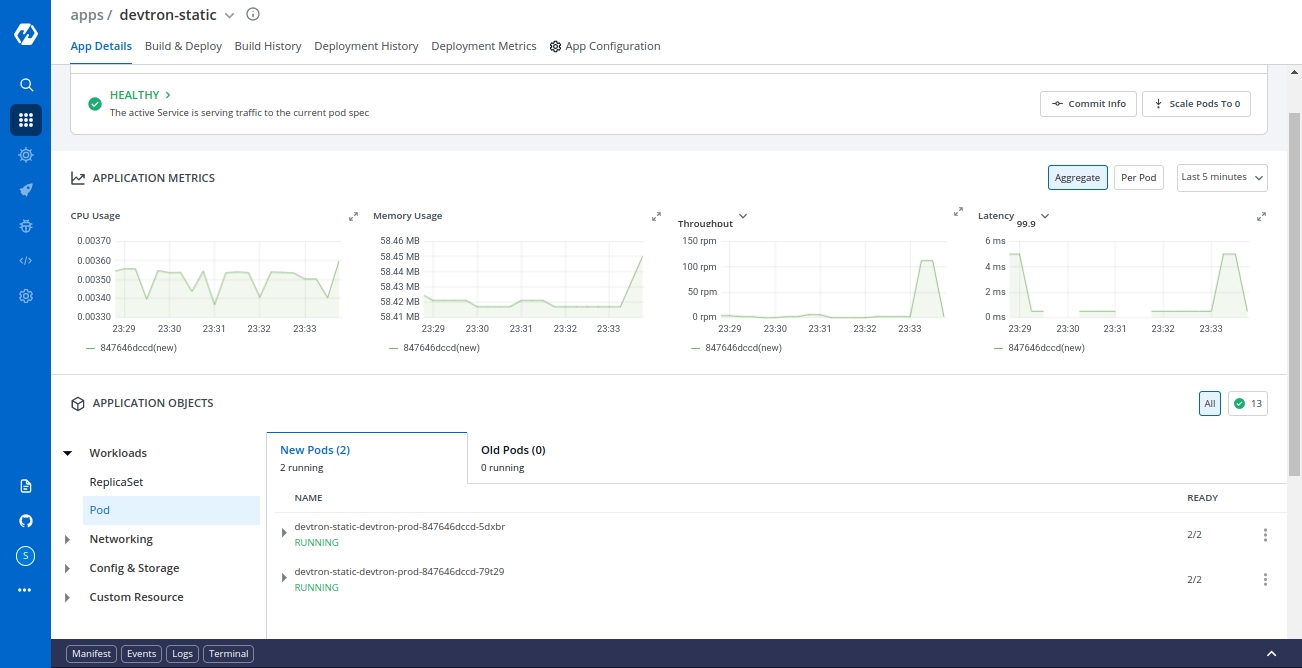
Enable show application metrics toggle to view the application metrics on the App Details page.
IMPORTANT: Enabling Application metrics introduces a sidecar container to your main container which may require some additional configuration adjustments, we recommend you to do load test after enabling it in a non-prod environment before enabling it in production environment.
Select Save to save your configurations.
Custom charts are added by a super admin from the section.
A can be uploaded by a super admin.
The CI pipeline includes Pre and Post-build steps to validate and introduce checkpoints in the build process.
The pre/post plugins allow you to execute some standard tasks, such as Code analysis, Load testing, Security scanning, and so on. You can build custom pre/post tasks or use one from the standard preset plugins provided by Devtron.
Each Pre/Post-build stage is executed as a series of events called tasks and includes custom scripts. You could create one or more tasks that are dependent on one another for execution. In other words, the output variable of one task can be used as an input for the next task to build a CI runner.
The tasks will run following the execution order.
The tasks may be re-arranged by using drag-and-drop; however, the order of passing the variables must be followed.
Pre-Build/Post-Build
Sonarqube
K6 Load testing
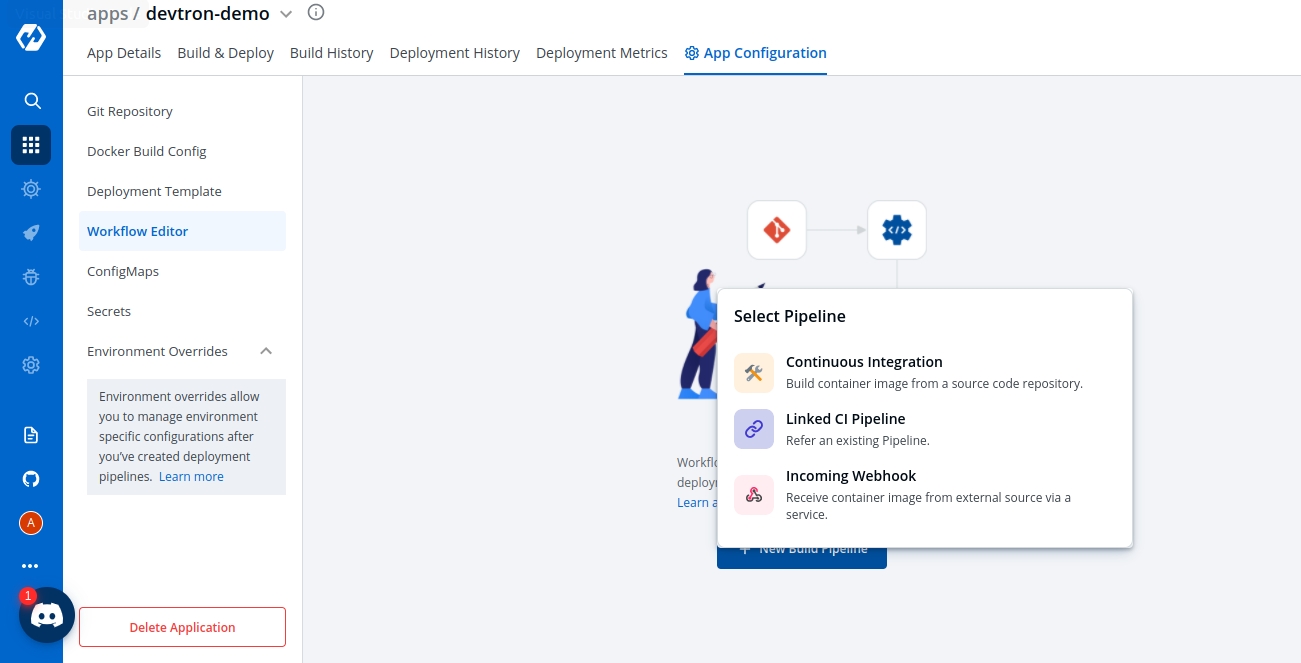
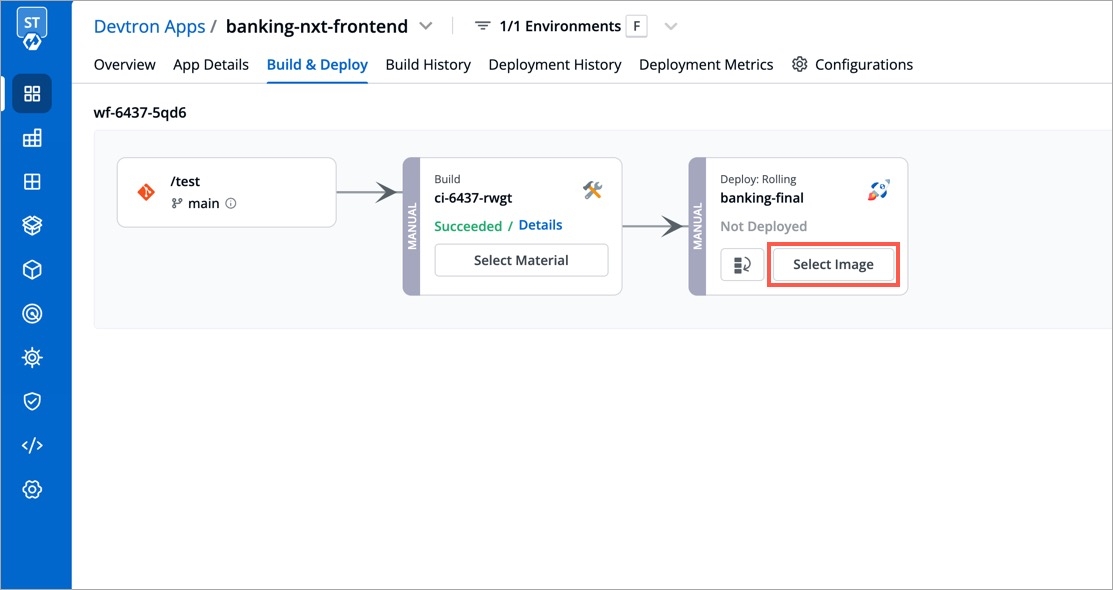
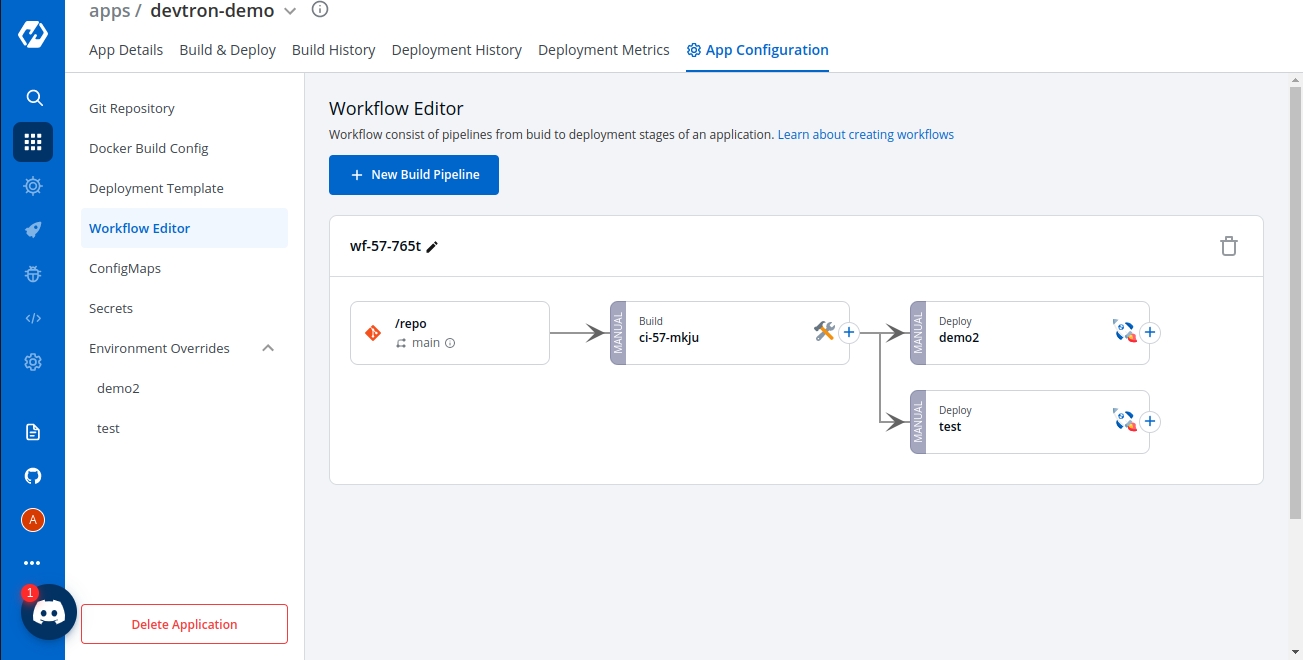
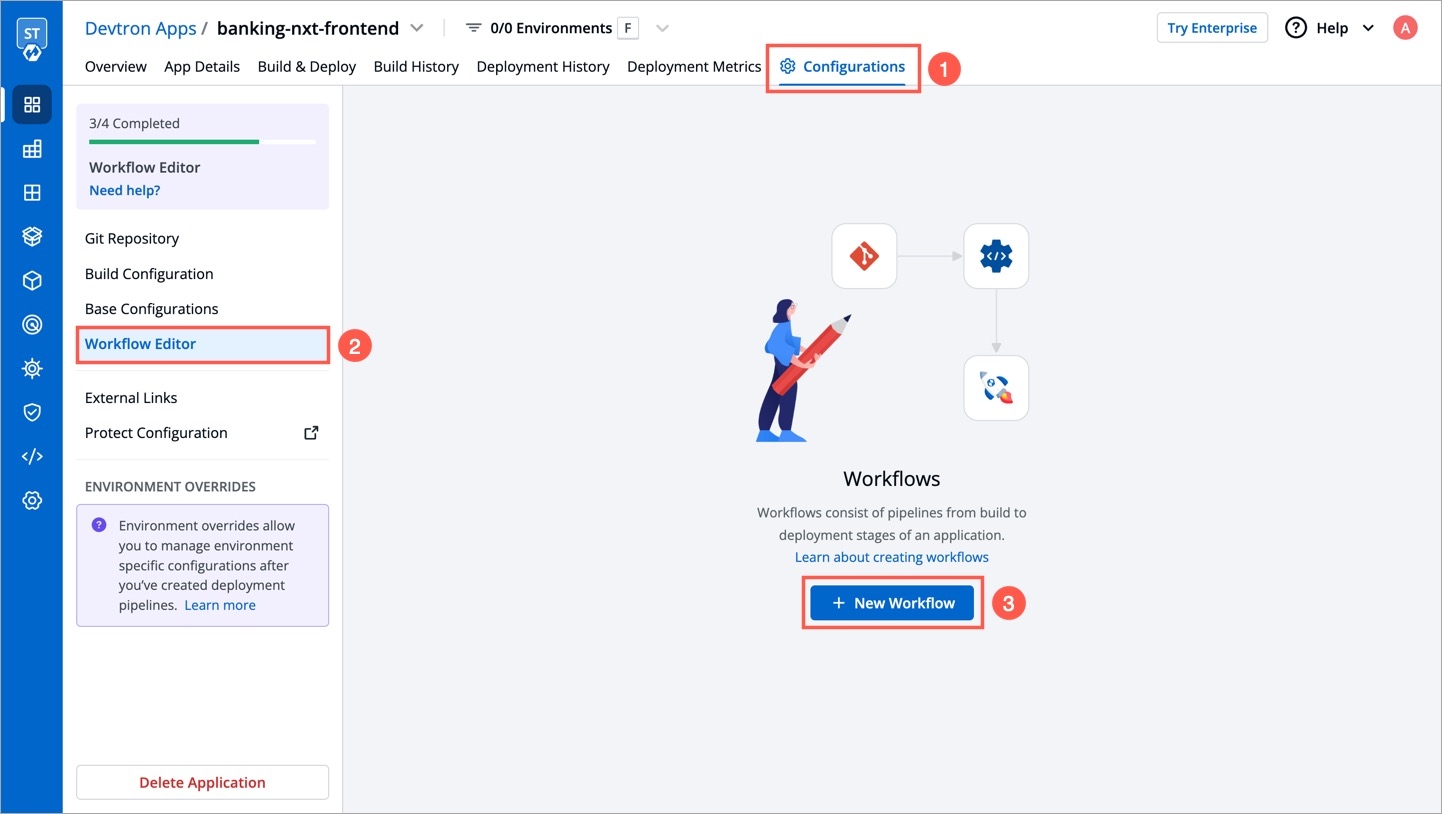
Go to Applications and select your application from the Devtron Apps tabs.
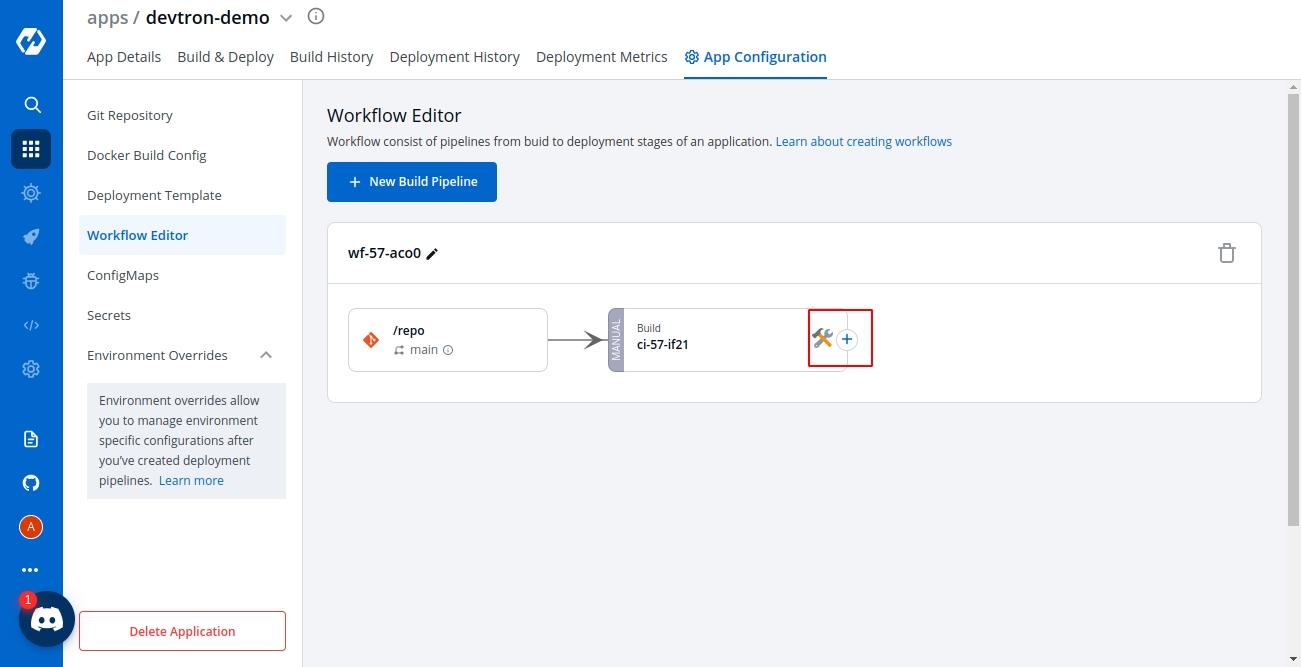
From the App Configuration tab select Workflow Editor.
Select the build pipeline for editing the stages.
Devtron CI pipeline includes the following build stages:
Pre-build stage: The tasks in this stage run before the image is built.
Build stage: In this stage, the build is triggered from the source code that you provide.
Post-build stage: The tasks in this stage are triggered once the build is complete.
You can create a task either by selecting one of the available preset plugins or by creating a custom script.
Prerequisite: Set up Sonarqube, or get the API keys from an admin.
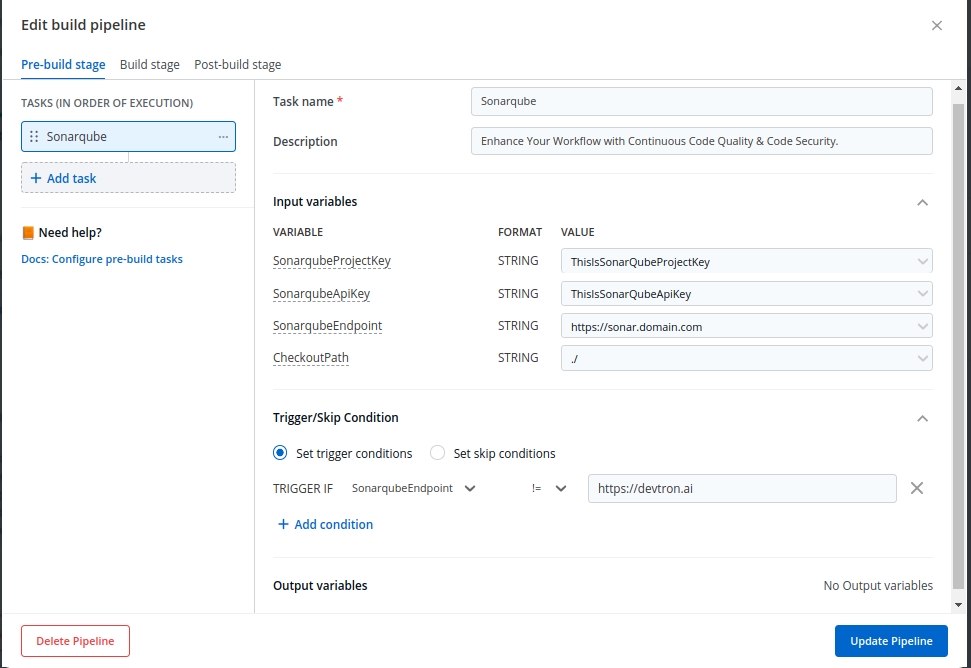
The example shows a Post-build stage with a task created using a preset plugin - Sonarqube.
On the Edit build pipeline screen, select the Post-build stage (or Pre-build).
Select + Add task.
Select Sonarqube from PRESET PLUGINS.
Task name
Required
A relevant name for the task
Description
Optional
A descriptive message for the task
Input variables
Optional
VALUE: A value for the input variable. The value may be any of the values from the previous build stages, a global variable, or a custom value
Trigger/Skip Condition
Optional
A conditional statement to execute or skip the task
SonarqubeProjectKey
String
Project key of sonarqube account.
SonarqubeApiKey
String
Api key of sonarqube account.
SonarqubeEndpoint
String
Api endpoint of sonarqube account.
CheckoutPath
String
Checkout path of git material.
Select Update Pipeline.
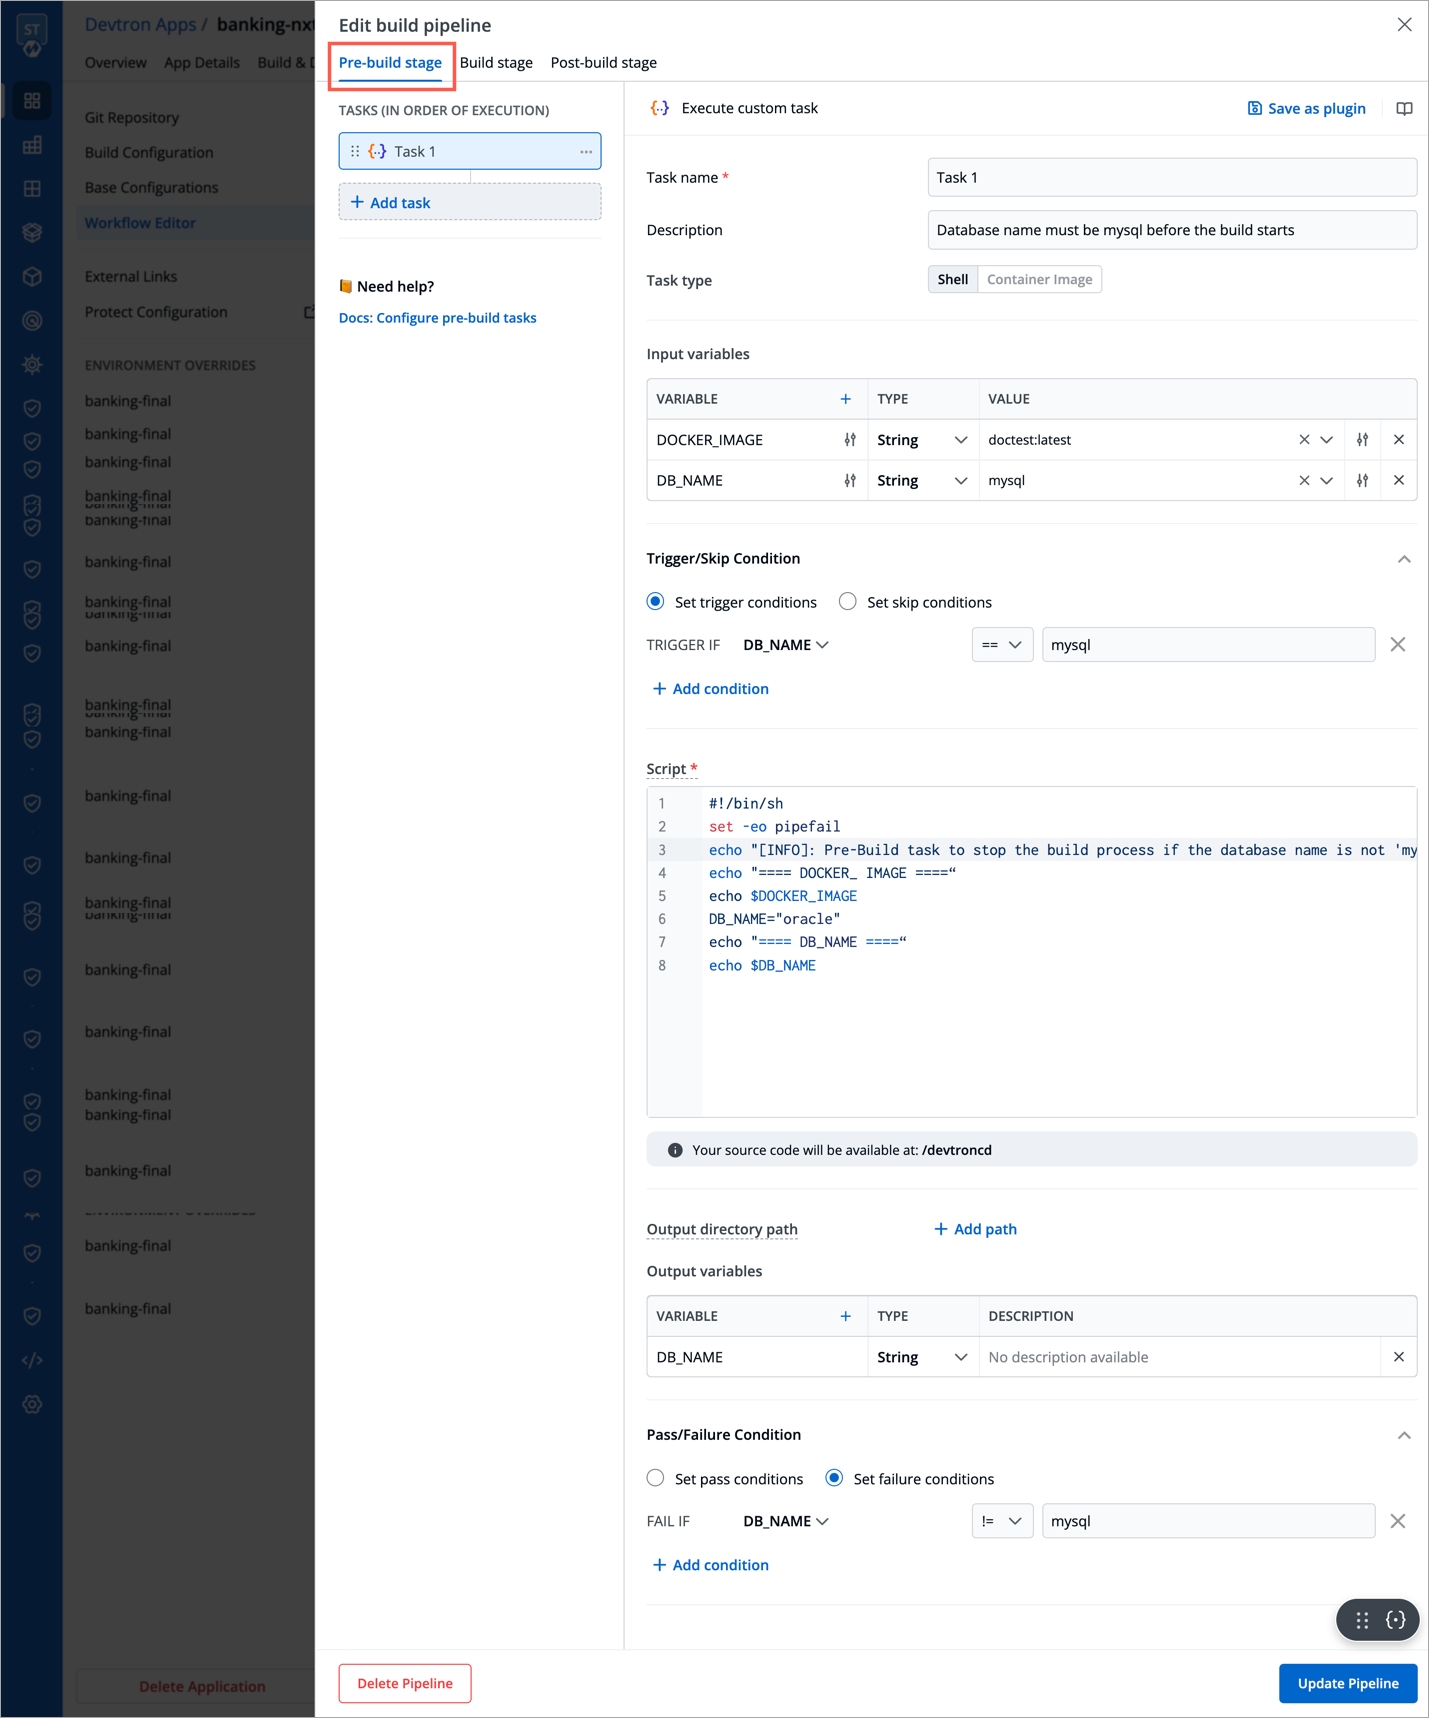
On the Edit build pipeline screen, select the Pre-build stage.
Select + Add task.
Select Execute custom script.
Select the Task type as Shell.
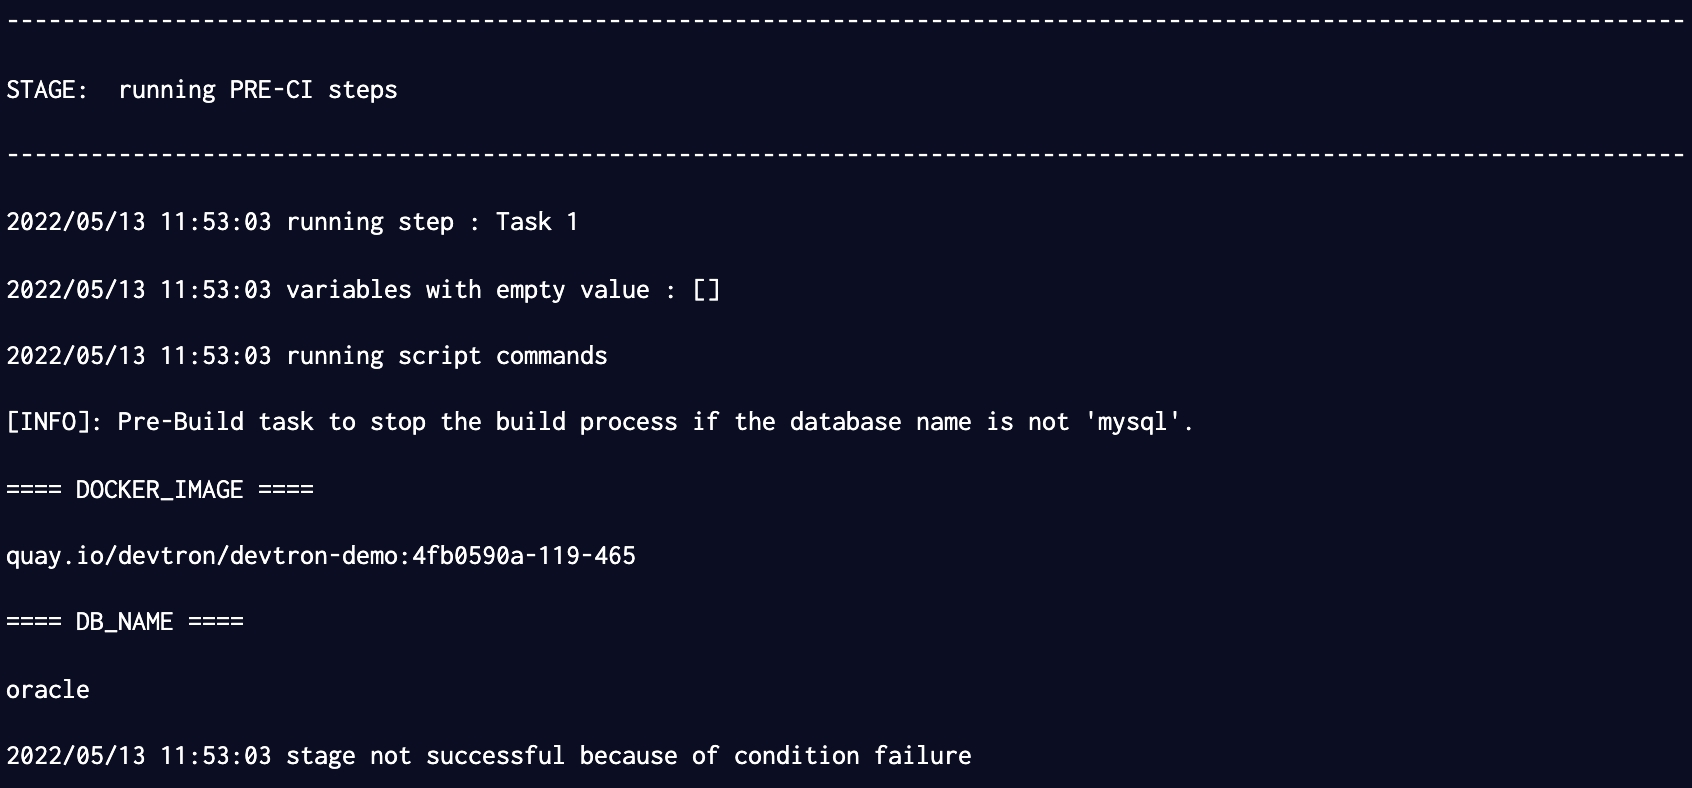
Consider an example that creates a Shell task to stop the build if the database name is not "mysql". The script takes 2 input variables, one is a global variable (DOCKER_IAMGE), and the other is a custom variable (DB_NAME) with a value "mysql". The task triggers only if the database name matches "mysql". If the trigger condition fails, this Pre-build task will be skipped and the build process will start. The variable DB_NAME is declared as an output variable that will be available as an input variable for the next task. The task fails if DB_NAME is not equal to "mysql".
Task name
Required
A relevant name for the task
Description
Optional
A descriptive message for the task
Task type
Optional
Shell: Custom shell script goes here
Input variables
Optional
Variable name: Alphanumeric chars and (_) only
Source or input value: The variable's value can be global, output from the previous task, or a custom value. Accepted data types include: STRING | BOOL | NUMBER | DATE
Description: Relevant message to describe the variable.
Trigger/Skip condition
Optional
A conditional statement to execute or skip the task
Script
Required
Custom script for the Pre/Post-build tasks
Output directory path
Optional
Output variables
Optional
Environment variables that are passed as input variables for the next task.
Pass/Failure Condition (Optional): Conditional statements to determine the success/failure of the task. A failed condition stops the execution of the next task and/or build process
Select Update Pipeline.
Here is a screenshot with the failure message from the task:
Select the Task type as Container image.
This example creates a Pre-build task from a container image. The output variable from the previous task is available as an input variable.
Task name
Required
A relevant name for the task
Description
Optional
A descriptive message for the task
Task type
Optional
Container image
Input variables
Optional
Variable name: Alphanumeric chars and (_) only
Source or input value: The variable's value can be global, output from the previous task, or a custom value Accepted data types include: STRING | BOOL | NUMBER | DATE
Description: Relevant message to describe the variable
Trigger/Skip condition
Optional
A conditional statement to execute or skip the task
Container image
Required
Select an image from the drop-down list or enter a custom value in the format <image>:<tag>
Mount custom code
Optional
Enable to mount the custom code in the container. Enter the script in the box below.
Mount above code at (required): Path where the code should be mounted
Command
Optional
The command to be executed inside the container
Args
Optional
The arguments to be passed to the command mentioned in the previous field
Port mapping
Optional
The port number on which the container listens. The port number exposes the container to outside services
Mount code to container
Optional
Mounts the source code inside the container. Default is "No". If set to "Yes", enter the path
Mount directory from host
Optional
Mount any directory from the host into the container. This can be used to mount code or even output directories
Output directory path
Optional
Directory path for the script output files such as logs, errors, etc.
Select Update Pipeline.
Secrets and configmaps both are used to store environment variables but there is one major difference between them: Configmap stores key-values in normal text format while secrets store them in base64 encrypted form. Devtron hides the data of secrets for the normal users and it is only visible to the users having edit permission.
Secret objects let you store and manage sensitive information, such as passwords, authentication tokens, and ssh keys. Embedding this information in secrets is safer and more flexible than putting it verbatim in a Pod definition or in a container image.
Click on Add Secret to add a new secret.
Name
Provide a name to your Secret
Data Type
Data Volume
Specify if there is a need to add a volume that is accessible to the Containers running in a pod.
Use secrets as Environment Variable
Select this option if you want to inject Environment Variables in your pods using Secrets.
Use secrets as Data Volume
Select this option if you want to configure a Data Volume that is accessible to Containers running in a pod. Ensure that you provide a Volume mount path for the same.
Key-Value
Provide a key and the corresponding value of the provided key.
Specify the volume mount folder path in Volume Mount Path, a path where the data volume needs to be mounted. This volume will be accessible to the containers running in a pod.
For multiple files mount at the same location you need to check sub path bool field, it will use the file name (key) as sub path. Sub Path feature is not applicable in case of external configmap except AWS Secret Manager, AWS System Manager and Hashi Corp Vault, for these cases Name (Secret key) as sub path will be picked up automatically.
File permission will be provide at the configmap level not on the each key of the configmap. it will take 3 digit standard permission for the file.
Click on Save Secret to save the secret.
You can see the Secret is added.
You can update your secrets anytime later, but you cannot change the name of your secrets. If you want to change your name of secrets then you have to create a new secret.
To update secrets, click on the secret you wish to update.
Click on Update Secret to update your secret.
You can delete your secret. Click on your secret and click on the delete sign to delete your secret.
There are five Data types that you can use to save your secret.
Kubernetes Secret: The secret that you create using Devtron.
Kubernetes External Secret: The secret data of your application is fetched by Devtron externally. Then the Kubernetes External Secret is converted to Kubernetes Secret.
AWS Secret Manager: The secret data of your application is fetched from AWS Secret Manager and then converted to Kubernetes Secret from AWS Secret.
AWS System Manager: The secret data for your application is fetched from AWS System Secret Manager and all the secrets stored in AWS System Manager are converted to Kubernetes Secret.
Hashi Corp Vault: The secret data for your application is fetched from Hashi Corp Vault and the secrets stored in Hashi Corp Vault are converted to Kubernetes Secret.
Note: The conversion of secrets from various data types to Kubernetes Secrets is done within Devtron and irrespective of the data type, after conversion, the Pods access secrets normally.
In some cases, it may be that you already have secrets for your application on some other sources and you want to use that on devtron. External secrets are fetched by devtron externally and then converted to kubernetes secrets.
The secret that is already created and stored in the environment and being used by devtron externally is referred here as Kubernetes External Secret. For this option, devtron will not create any secret by itself but they can be used within the pods. Before adding secret from kubernetes external secret, please make sure that secret with the same name is present in the environment. To add secret from kubernetes external secret, follow the steps mentioned below:
Navigate to Secrets of the application.
Click on Add Secret to add a new secret.
Select Kubernetes External Secret from dropdown of Data type.
Provide a name to your secret. Devtron will search secret in the environment with the same name that you mention here.
Before adding any external secrets on devtron, kubernetes-external-secrets must be installed on the target cluster. Kubernetes External Secrets allows you to use external secret management systems (e.g., AWS Secrets Manager, Hashicorp Vault, etc) to securely add secrets in Kubernetes.
To install the chart with the release named my-release:
To install the chart with AWS IAM Roles for Service Accounts:
To add secrets from AWS secret manager, navigate to Secrets of the application and follow the steps mentioned below :
Click on Add Secret to add a new secret.
Select AWS Secret Manager from dropdown of Data type.
Provide a name to your secret.
Select how you want to use the secret. You may leave it selected as environment variable and also you may leave Role ARN empty.
In Data section, you will have to provide data in key-value format.
All the required field to pass your data to fetch secrets on devtron are described below :
key
Secret key in backend
name
Name for this key in the generated secret
property
Property to extract if secret in backend is a JSON object
isBinary
Set this to true if configuring an item for a binary file stored else set false
To add secrets in AWS secret manager, do the following steps :
Go to AWS secret manager console.
Click on Store a new secret.
Add and save your secret.
Info:
A CI Pipeline can be created in one of the three ways:
Each of these methods has different use-cases that can be tailored to the needs of the organization.
Continuous Integration Pipeline allows you to build the container image from a source code repository.
From the Applications menu, select your application.
On the App Configuration page, select Workflow Editor.
Select + New Build Pipeline.
Select Continuous Integration.
Enter the following fields on the Create build pipeline screen:
The advanced CI Pipeline includes the following stages:
Pre-build stage: The tasks in this stage run before the image is built.
Build stage: In this stage, the build is triggered from the source code that you provide.
Post-build stage: The tasks in this stage are triggered once the build is complete.
To Perform the security scan after the container image is built, enable the Scan for vulnerabilities toggle in the build stage.
The Build stage allows you to configure a build pipeline from the source code.
From the Create build pipeline screen, select Advanced Options.
Select Build stage.
Select Update Pipeline.
The Source type - "Branch Fixed" allows you to trigger a CI build whenever there is a code change on the specified branch.
Select the Source type as "Branch Fixed" and enter the Branch Name.
Info: If you choose "Pull Request" or "Tag Creation" as the source type, you must first configure the Webhook for GitHub/Bitbucket as a prerequisite step.
Go to the Settings page of your repository and select Webhooks.
Select Add webhook.
In the Payload URL field, enter the Webhook URL that you get on selecting the source type as "Pull Request" or "Tag Creation" in Devtron the dashboard.
Change the Content-type to application/json.
In the Secret field, enter the secret from Devtron the dashboard when you select the source type as "Pull Request" or "Tag Creation".
Under Which events would you like to trigger this webhook?, select Let me select individual events. to trigger the webhook to build CI Pipeline.
Select Branch or tag creation and Pull Requests.
Select Add webhook.
Go to the Repository settings page of your Bitbucket repository.
Select Webhooks and then select Add webhook.
Enter a Title for the webhook.
In the URL field, enter the Webhook URL that you get on selecting the source type as "Pull Request" or "Tag Creation" in the Devtron dashboard.
Select the event triggers for which you want to trigger the webhook.
Select Save to save your configurations.
The Source type - "Pull Request" allows you to configure the CI Pipeline using the PR raised in your repository.
To trigger the build from specific PRs, you can filter the PRs based on the following keys:
Select the appropriate filter and pass the matching condition as a regular expression (regex).
Select Create Pipeline.
The Source type - "Tag Creation" allows you to build the CI pipeline from a tag.
To trigger the build from specific tags, you can filter the tags based on the author and/or the tag name.
Select the appropriate filter and pass the matching condition as a regular expression (regex).
Select Create Pipeline.
Note
(a) You can provide pre-build and post-build stages via the Devtron tool’s console or can also provide these details by creating a file
devtron-ci.yamlinside your repository. There is a pre-defined format to write this file. And we will run these stages using this YAML file. You can also provide some stages on the Devtron tool’s console and some stages in the devtron-ci.yaml file. But stages defined through theDevtrondashboard are first executed then the stages defined in thedevtron-ci.yamlfile.(b) The total timeout for the execution of the CI pipeline is by default set as 3600 seconds. This default timeout is configurable according to the use case. The timeout can be edited in the configmap of the orchestrator service in the env variable as
env:"DEFAULT_TIMEOUT" envDefault:"3600"
If one code is shared across multiple applications, Linked CI Pipeline can be used, and only one image will be built for multiple applications because if there is only one build, it is not advisable to create multiple CI Pipelines.
From the Applications menu, select your application.
On the App Configuration page, select Workflow Editor.
Select + New Build Pipeline.
Select Linked CI Pipeline.
Enter the following fields on the Create linked build pipeline screen:
Select the application in which the source CI pipeline is present.
Select the source CI pipeline from the application that you selected above.
Enter a name for the linked CI pipeline.
Select Create Linked CI Pipeline.
After creating a linked CI pipeline, you can create a CD pipeline. Builds cannot be triggered from a linked CI pipeline; they can only be triggered from the source CI pipeline. There will be no images to deploy in the CD pipeline created from the 'linked CI pipeline' at first. To see the images in the CD pipeline of the linked CI pipeline, trigger build in the source CI pipeline. The build images will now be listed in the CD pipeline of the 'linked CI pipeline' whenever you trigger a build in the source CI pipeline.
The CI pipeline receives container images from an external source via a webhook service.
You can use Devtron for deployments on Kubernetes while using your CI tool such as Jenkins. External CI features can be used when the CI tool is hosted outside the Devtron platform.
From the Applications menu, select your application.
On the App Configuration page, select Workflow Editor.
Select + New Build Pipeline.
Select Incoming Webhook.
Select Save and Generate URL. This generates the Payload format and Webhook URL.
You can send the Payload script to your CI tools such as Jenkins and Devtron will receive the build image every time the CI Service is triggered or you can use the Webhook URL which will build an image every time CI Service is triggered using Devtron Dashboard.
You can update the configurations of an existing CI Pipeline except for the pipeline's name. To update a pipeline, select your CI pipeline. In the Edit build pipeline window, edit the required stages and select Update Pipeline.
You can only delete a CI pipeline if there is no CD pipeline created in your workflow.
To delete a CI pipeline, go to App Configurations > Workflow Editor and select Delete Pipeline.
Create a if you haven't done that already!
Create a task from -
Create a task from -
|
The task type of the custom script may be a or a .
Trigger the
Provide the Data Type of your secret. To know about different Data Types available click on
For Devtron version older than v0.4.0, please refer the page.
The Pre-Build and Post-Build stages allow you to create Pre/Post-Build CI tasks as explained .
Before you begin, for either GitHub or Bitbucket.
The "Pull Request" source type feature only works for the host GitHub or Bitbucket cloud for now. To request support for a different Git host, please create a github issue .
Devtron uses regexp library, view . You can test your custom regex from .
Before you begin, for either GitHub or Bitbucket.
Author
Author of the PR
Source branch name
Branch from which the Pull Request is generated
Target branch name
Branch to which the Pull request will be merged
Title
Title of the Pull Request
State
State of the PR. Default is "open" and cannot be changed
Author
The one who created the tag
Tag name
Name of the tag for which the webhook will be triggered
Pipeline Name
Required
Name of the pipeline
Source Type
Required
‘Branch Fixed’ or ‘Tag Regex’
Branch Name
Required
Name of the branch


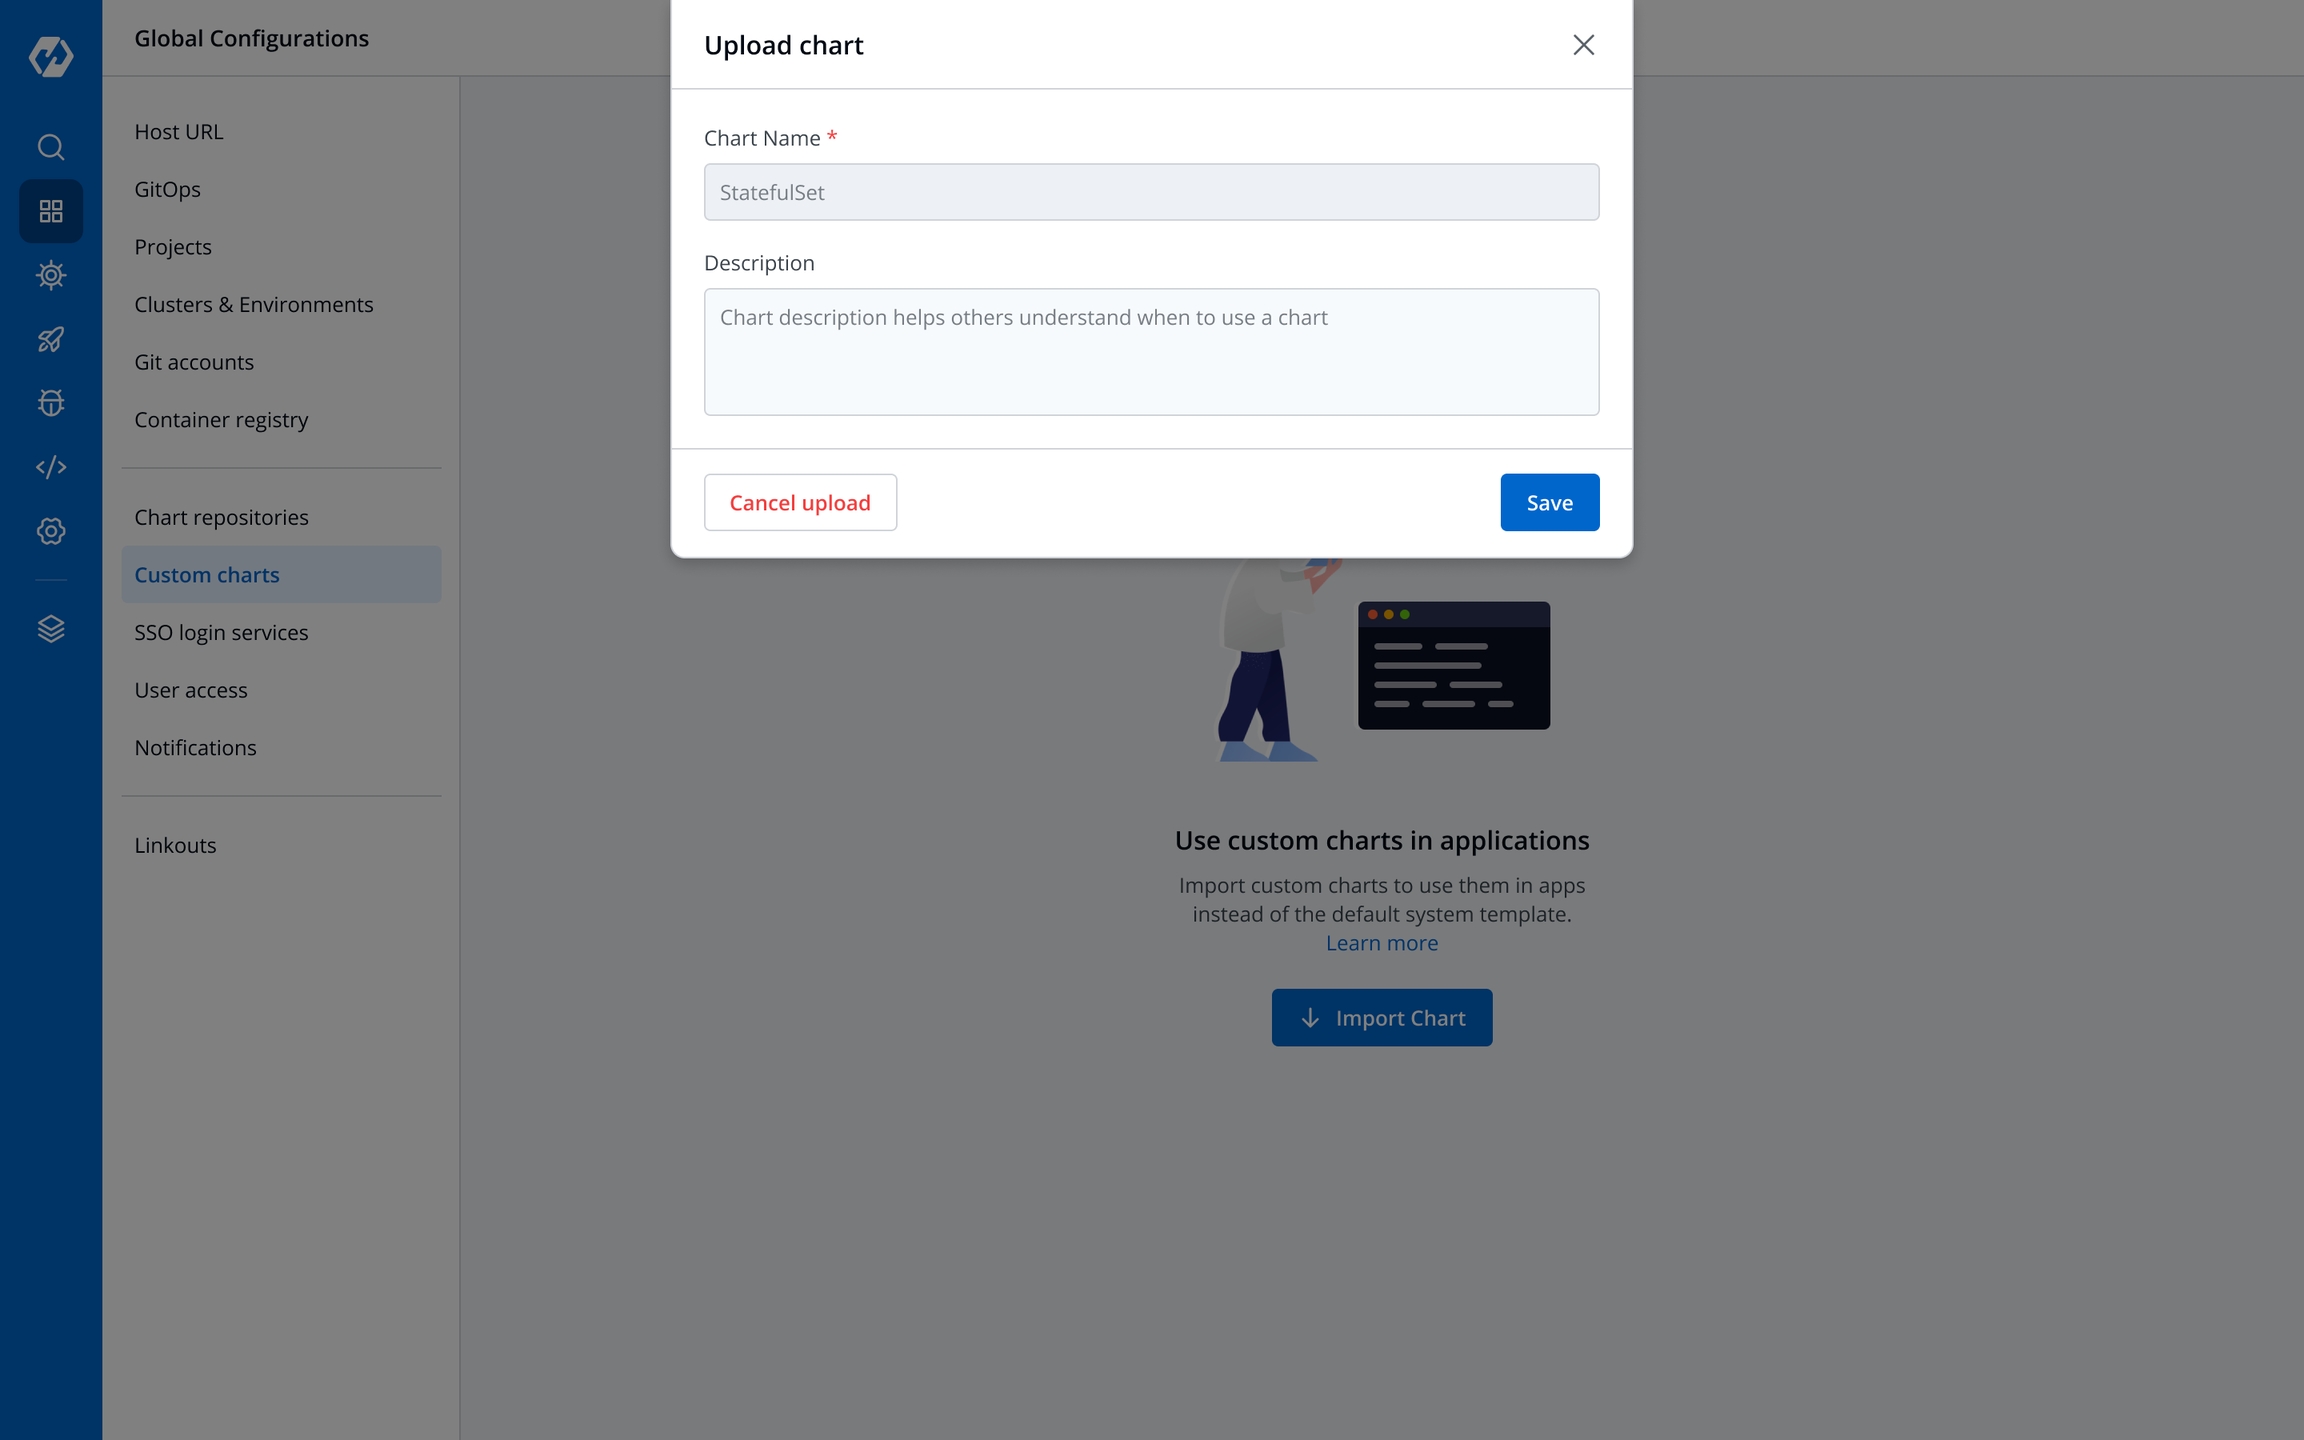
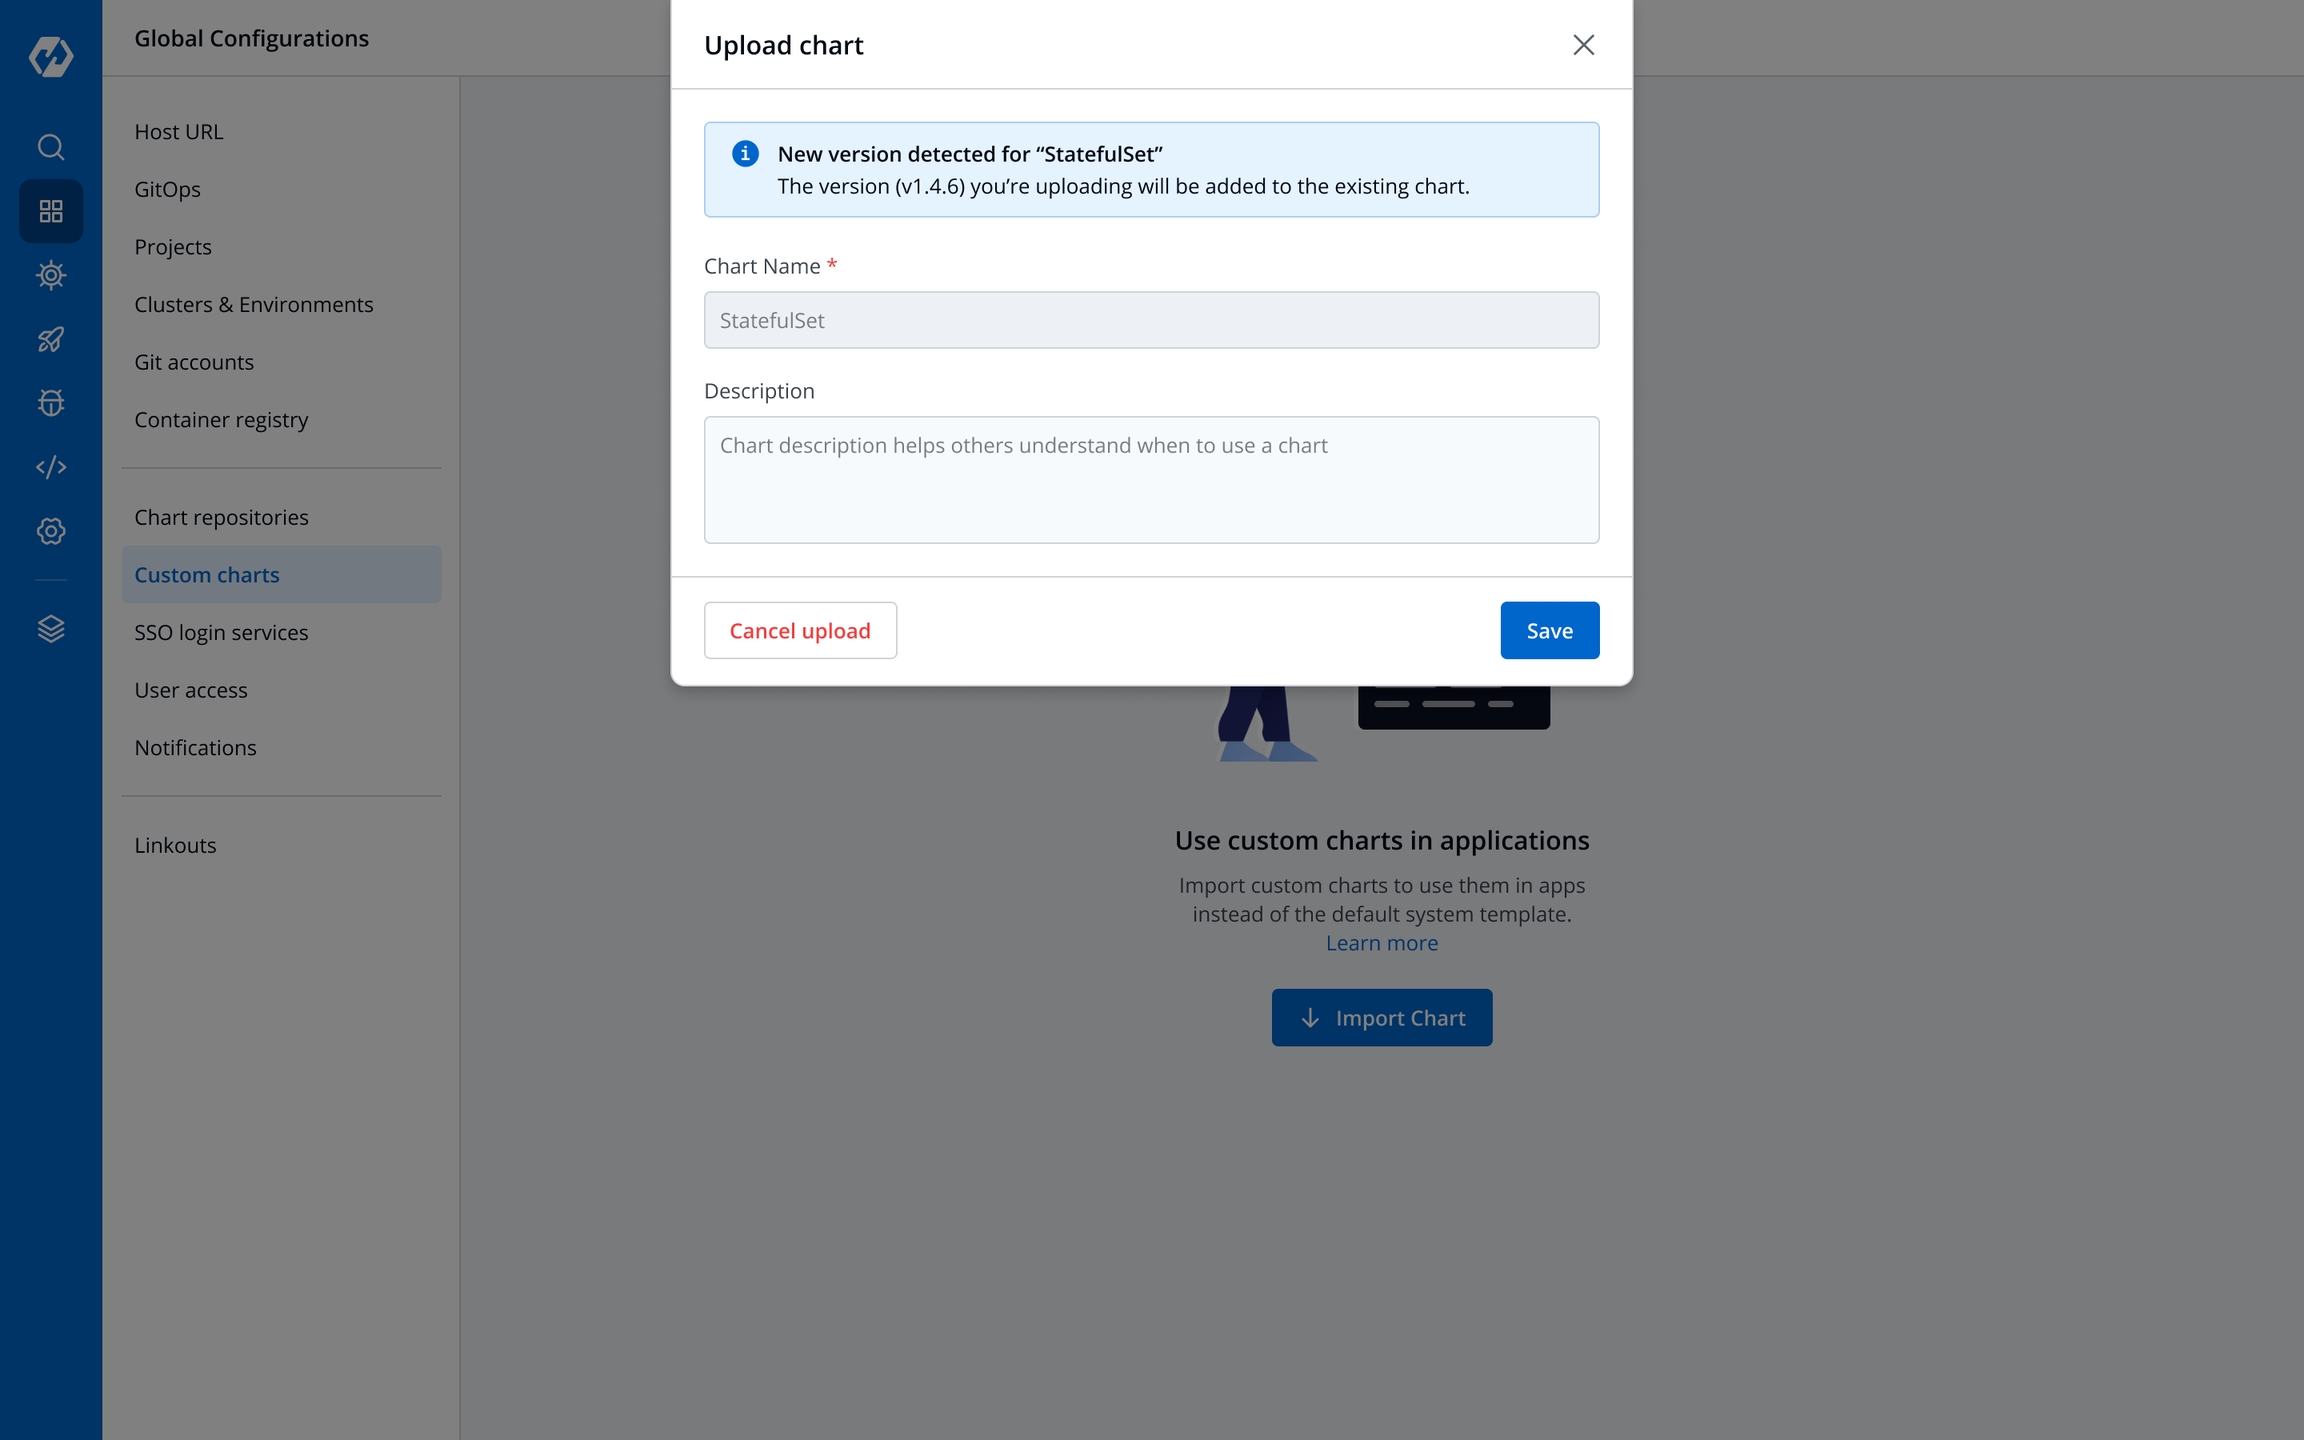
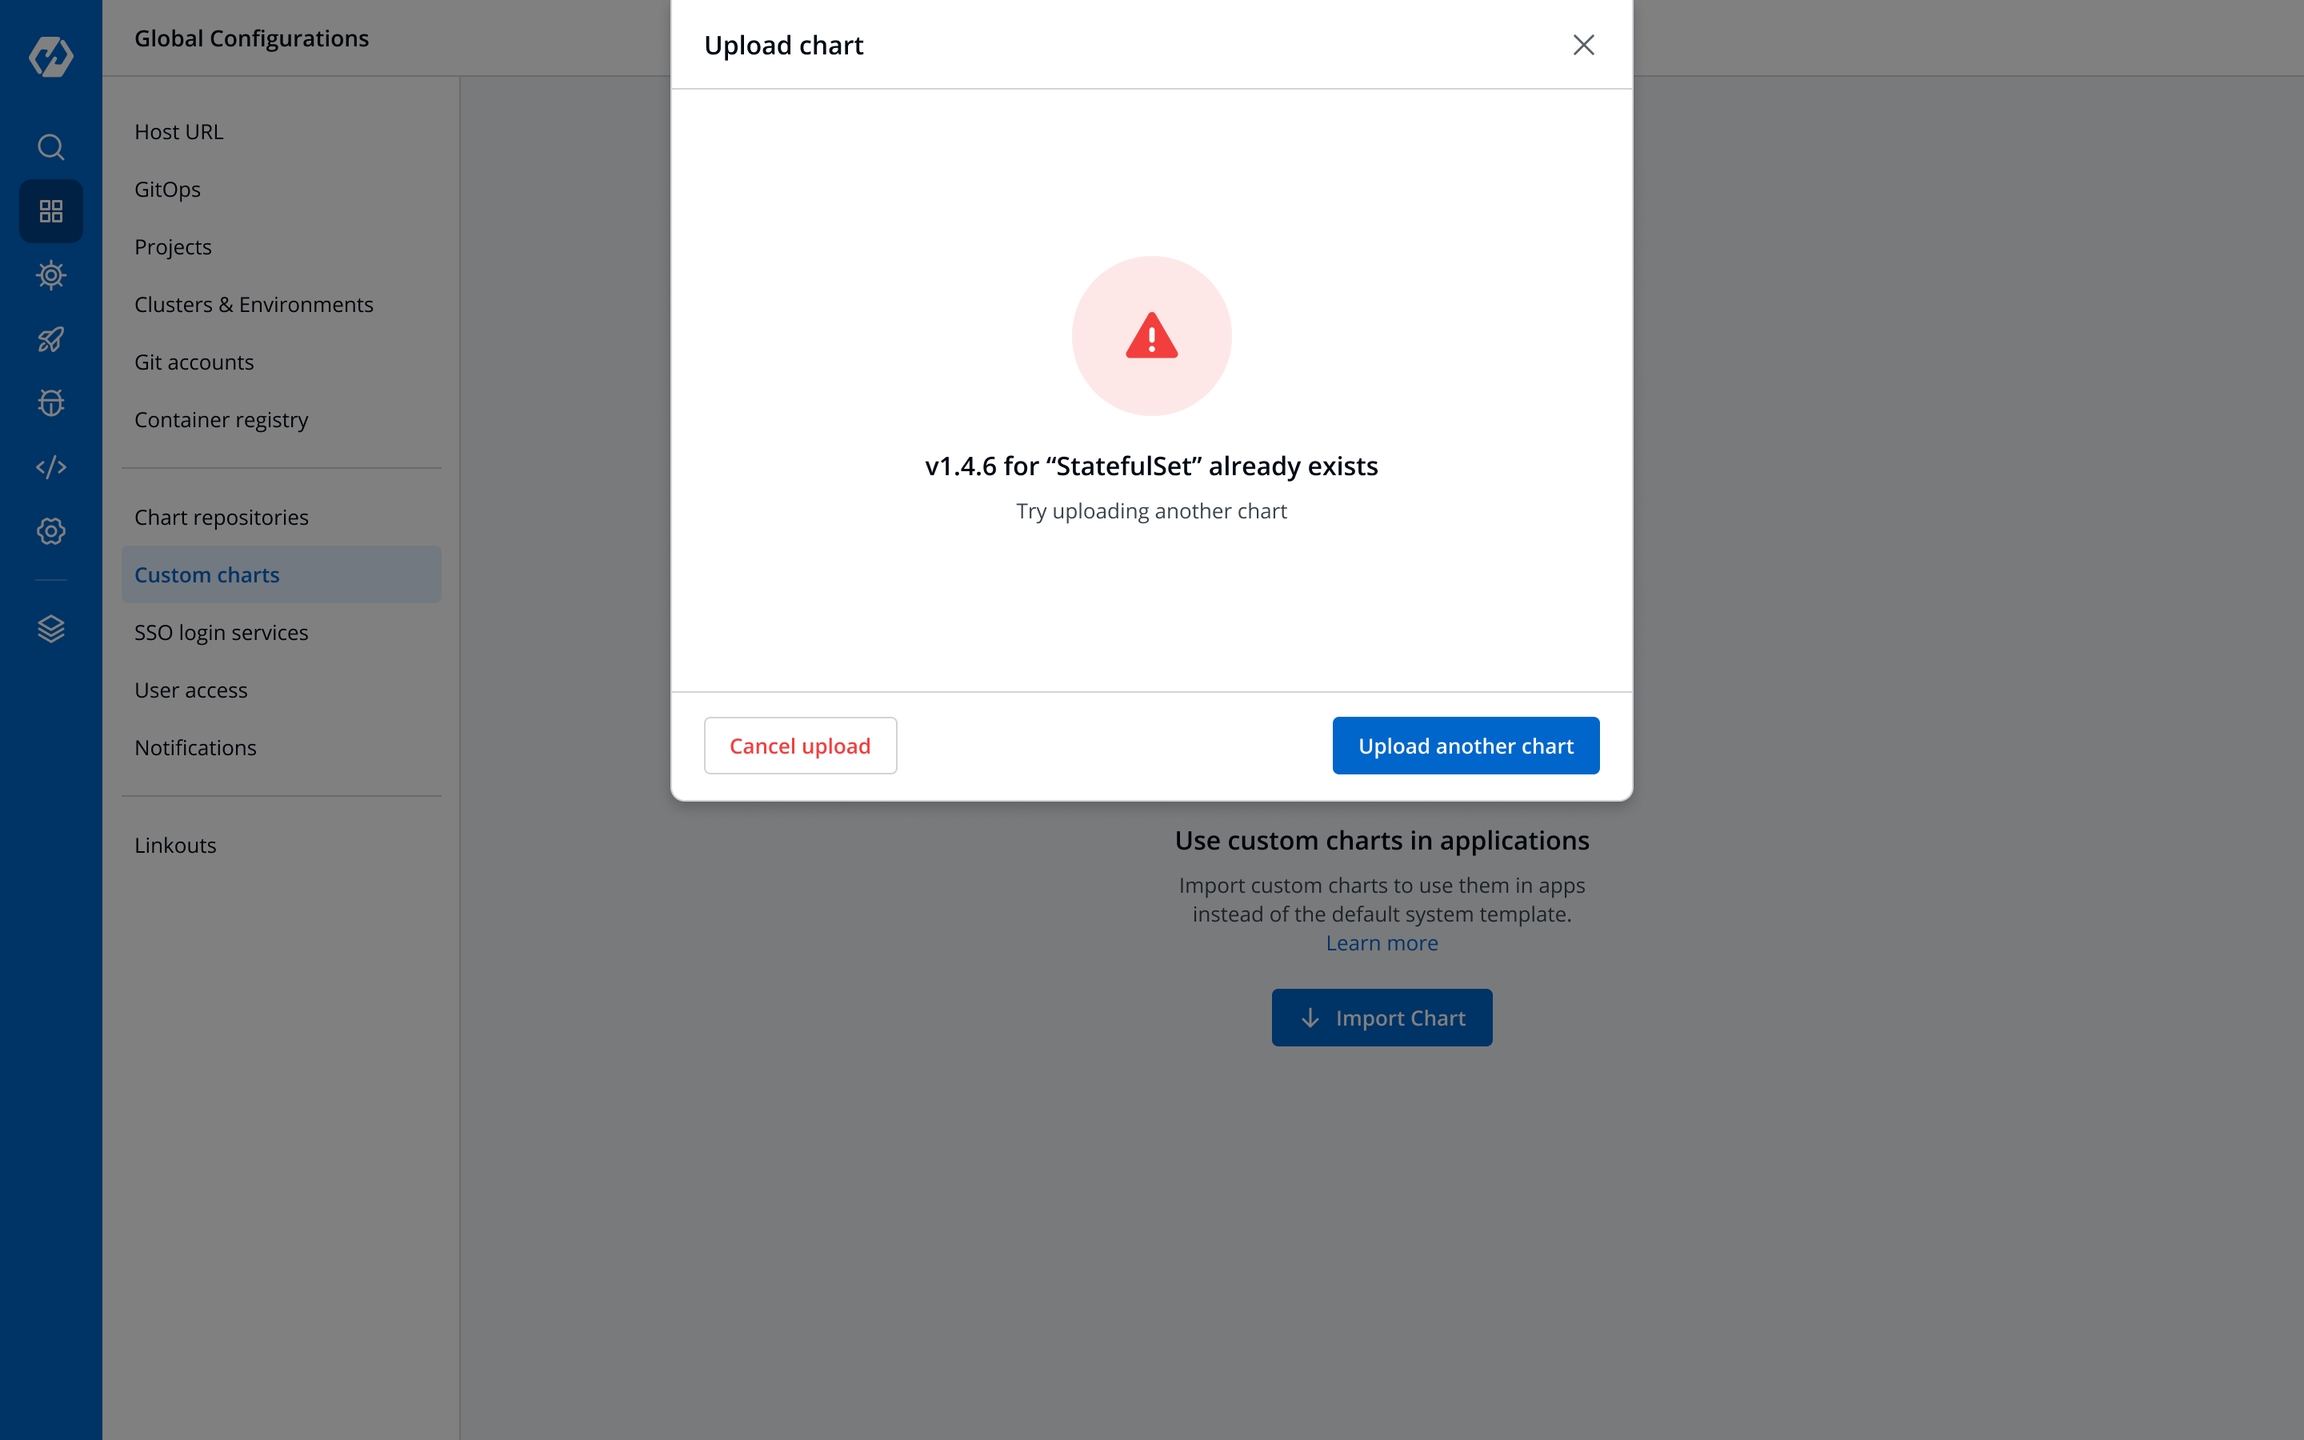
Source type
Required
Branch Name
Required
Branch that triggers the CI build
Advanced Options
Optional
Create Pre-Build, Build, and Post-Build tasks
TRIGGER BUILD PIPELINE
Required
The build execution may be set to:
Automatically (default): Build is triggered automatically as the Git source code changes.
Manually: Build is triggered manually.
Pipeline Name
Required
A name for the pipeline
Source type
Required
Branch Name
Required
Branch that triggers the CI build
Docker build arguments
Optional
Override docker build configurations for this pipeline.
Key: Field name
Value: Field value
You will see all your environments associated with an application under the Environment Overrides section.
You can customize your Deployment template, ConfigMap, Secrets in Environment Overrides section to add separate customizations for different environments such as dev, test, integration, prod, etc.
If you want to deploy an application in a non-production environment and then in production environment once testing is done in non-prod environment, then you do not need to create a new application for prod environment. Your existing pipeline(non-prod env) will work for both the environments with little customization in your deployment template under Environment overrides.
In a Non-production environment, you may have specified 100m CPU resources in the deployment template but in the Production environment you may want to have 500m CPU resources as the traffic on Pods will be higher than traffic on non-prod env.
Configuring the Deployment template inside Environment Overrides for a specific environment will not affect the other environments because Environment Overrides will configure deployment templates on environment basis. And at the time of deployment, it will always pick the overridden deployment template if any.
If there are no overrides specified for an environment in the Environment Overrides section, the deployment template will be the one you specified in the deployment template section of the app creation.
(Note: This example is meant only for a representational purpose. You can choose to add any customizations you want in your deployment templates in the Environment Overrides tab)
Any changes in the configuration will not be added to the template, instead, it will make a copy of the template and lets you customize it for each particular environment. And now this overridden template will be used only for the specified Environment.
This will save you the trouble to manually create deployment files separately for each environment. Instead, all you have to do is to change the required variables in the deployment template.
In the Environment Overrides section, click on Allow Override and make changes to your Deployment template and click on Save to save your changes of the Deployment template.
The same goes for ConfigMap and Secrets. You can also create an environment-specific configmap and Secrets inside the Environment override section.
Click on Update ConfigMap to update Configmaps.
Click on Update Secrets to update Secrets.
CI Pipeline can be created in three different ways, Continuous Integration, Linked CI Pipeline and Incoming Webhook.
Each of these methods have different use-cases which can be used according to the needs of the organization. Let’s begin with Continuous Integration.
Click on Continuous Integration, a prompt comes up in which we need to provide our custom configurations. Below is the description of some configurations which are required.
Pipeline Name
Name of the pipeline
Pipeline Execution (Advanced)
Select from automatic or manual execution depending upon your use-case
Source Type
Select the source through which the CI Pipeline will be triggered
Stages (Advanced)
1.Pre-build Stages- Scripts to be executed before building an image. 2.Docker build Stages- Provide a new argument and override an old argument in key-value pair. 3. Post-build Stages- Scripts to be executed after building image
Scan for vulnerabilities (Advanced)
It will scan your image and find if any vulnerabilities present
[Note] Options such as pipeline execution, stages and scan for vulnerabilities, will be visible after clicking on advanced options present in the bottom left corner.
Pipeline name is an auto-generated name which can also be renamed by clicking on Advanced options.
You can select the method you want to execute the pipeline. By default the value is automatic. In this case it will get automatically triggered if any changes are made to the respective git repository. You can set it to manual if you want to trigger the pipeline manually.
In source type, we can observe that we have three types of mechanisms which can be used for building your CI Pipeline. In the drop-down you can observe we have Branch Fixed, Pull Request and Tag Creation.
If you select the Branch Fixed as your source type for building CI Pipeline, then you need to provide the corresponding Branch Name.
Branch Name is the name of the corresponding branch (eg. main or master, or any other branch)
If you select the Pull Request option, you can configure the CI Pipeline using the generated PR. For this mechanism you need to configure a webhook for the repository added in the Git Material.
Prerequisites for Pull Request
If using GitHub - To use this mechanism, as stated above you need to create a webhook for the corresponding repository of your Git Provider. In Github to create a webhook for the repository -
Go to settings of that particular repository
Click on webhook section under options tab
In the Payload URL section, please copy paste the Webhook URL which can be found at Devtron Dashboard when you select source type as Pull Request as seen in above image.
Change content type to - application/json
Copy paste the Secret as well from the Dashboard when you select the source type as Pull Request
Now, scroll down and select the custom events for which you want to trigger the webhook to build CI Pipeline -
Check the radio button for Let me select individual events
Then, check the Branch or Tag Creation and Pull Request radio buttons under the individual events as mentioned in image below.
[Note] If you select Branch or Tag Creation, it will work for the Tag Creation mechanism as well.
After selecting the respective options, click on the generate the webhook button to create a webhook for your respective repository.
If using Bitbucket Cloud - If you are using Bitbucket cloud as your git provider, you need to create a webhook for that as we created for Github in the above section. Follow the steps to create webhook -
Go to Repository Settings on left sidebar of repository window
Click on Webhooks and then click on Add webhook as shown in the image.
Give any appropriate title as per your choice and then copy-paste the url which you can get from Devtron Dashboard when you select Pull Request as source type in case of Bitbucket Cloud as Git Host.
Check the Pull Request events for which you want to trigger the webhook and then save the configurations.
Filters
Now, coming back to the Pull Request mechanism, you can observe we have the option to add filters. In a single repository we have multiple PRs generated, so to have the exact PR for which you want to build the CI Pipeline, we have this feature of filters.
You can add a few filters which can be seen in the dropdown to sort the exact PR which you want to use for building the pipeline.
Below are the details of different filters which you can use as per your requirement. Please select any of the filters and pass the value in regex format as one has already given for example and then click on Create Pipeline.
Source branch name
Branch from which the Pull Request is generated.
Target branch name
Branch to which the Pull request will be merged.
Author
The one who created the Pull Request.
Title
Title provided to the Pull Request.
State
It shows the state of PR and as of now it is fixed to Open which cannot be changed.
The third option i.e, Tag Creation. In this mechanism you need to provide the tag name or author to specify the exact tag for which you want to build the CI Pipeline. To work with this feature as well, you need to configure the webhook for either Github or Bitbucket as we did in the previous mechanism i.e, Pull Request.
In this process as well you can find the option to filter the specific tags with certain filter parameters. Select the appropriate filter as per your requirement and pass the value in form of regex, one of the examples is already given.
Author
The one who created the tag.
Tag name
Name of the tag for which the webhook will be triggered.
Select the appropriate filter and pass the value in the form of regex and then click on Create Pipeline.
When you click on the advanced options button which can be seen at the bottom-left of the screen, you can see some more configuration options which includes pipeline execution, stages and scan for vulnerabilities.
There are 3 dropdowns given below:
Pre-build
Docker build
Post-build
(a) Pre-build
This section is used for those steps which you want to execute before building the Docker image. To add a Pre-build stage, click on Add Stage and provide a name to your pre-stage and write your script as per your requirement. These stages will run in sequence before the docker image is built. Optionally, you can also provide the path of the directory where the output of the script will be stored locally.
You can add one or more than one stage in a CI Pipeline.
(b) Docker build
Though we have the option available in the Docker build configuration section to add arguments in key-value pairs for the docker build image. But one can also provide docker build arguments here as well. This is useful, in case you want to override them or want to add new arguments to build your docker image.
(c) Post-build
The post-build stage is similar to the pre-build stage. The difference between the post-build stage and the pre-build stage is that the post-build will run when your CI pipeline will be executed successfully.
Adding a post-build stage is similar to adding a pre-build stage. Click on Add Stage and provide a name to your post-stage. Here you can write your script as per your requirement, which will run in sequence after the docker image is built. You can also provide the path of the directory in which the output of the script will be stored in the Remote Directory column. And this is optional to fill because many times you run scripts that do not provide any output.
NOTE:
(a) You can provide pre-build and post-build stages via the Devtron tool’s console or can also provide these details by creating a file devtron-ci.yaml inside your repository. There is a pre-defined format to write this file. And we will run these stages using this YAML file. You can also provide some stages on the Devtron tool’s console and some stages in the devtron-ci.yaml file. But stages defined through the Devtron dashboard are first executed then the stages defined in the devtron-ci.yaml file.
(b) The total timeout for the execution of the CI pipeline is by default set as 3600 seconds. This default timeout is configurable according to the use-case. The timeout can be edited in the configmap of the orchestrator service in the env variable env:"DEFAULT_TIMEOUT" envDefault:"3600"
Scan for vulnerabilities adds a security feature to your application. If you enable this option, your code will be scanned for any vulnerabilities present in your code. And you will be informed about these vulnerabilities. For more details please check doc
You have provided all the details required to create a CI pipeline, now click on Create Pipeline.
You can also update any configuration of an already created CI Pipeline, except the pipeline name. The pipeline name can not be edited.
Click on your CI pipeline, to update your CI Pipeline. A window will be popped up with all the details of the current pipeline.
Make your changes and click on Update Pipeline at the bottom to update your Pipeline.
You can only delete CI pipeline if you have no CD pipeline created in your workflow.
To delete a CI pipeline, go to the App Configurations and then click on Workflow editor
Click on Delete Pipeline at the bottom to delete the CD pipeline
The test cases given in the script will run before the test cases given in the devtron.ci.yaml
version
specify the version of yaml
appliesTo
applies the changes to a specified branch
type
branch type on which changes are to be applied, it can be BRANCH_FIXED or TAG_PATTERN
value
branch name on which changes are to be applied, it can take a value as the name of branch (“master”) or as a regular expression ("%d.%d.%d-rc")
script
A script which you want to execute, you can also execute the docker commands here
beforeDockerBuildStages
script to run before the docker build step
afterDockerBuildStages
script to run after the docker build step
outputLocation
The location where you want to see the output of the report of Test cases
If one code is shared across multiple applications, Linked CI Pipeline can be used, and only one image will be built for multiple applications because if there is only one build, it is not advisable to create multiple CI Pipelines.
To create a Linked CI Pipeline, please follow the steps mentioned below :
Click on + New Build Pipeline button.
Select Linked CI Pipeline.
Select the application in which the source CI pipeline is present.
Select the source CI pipeline.
Provide a name for linked CI pipeline.
Click on Create Linked CI Pipeline button to create linked CI pipeline.
After creating a linked CI pipeline, you can create a CD pipeline. You cannot trigger build from linked CI pipeline, it can be triggered only from source CI pipeline. Initially you will not see any images to deploy in CD pipeline created from linked CI pipeline. Trigger build in source CI pipeline to see the images in CD pipeline of linked CI pipeline. After this, whenever you trigger buld in source CI pipeline, the build images will be listed in CD pipeline of linked CI pipeline too.
You can use Devtron for deployments on Kubernetes while using your own CI tool such as Jenkins. External CI features can be used for cases where the CI tool is hosted outside the Devtron platform.
You can send the ‘Payload script’ to your CI tools such as Jenkins and Devtron will receive the build image every time the CI Service is triggered or you can use the Webhook URL which will build an image every time CI Service is triggered using Devtron Dashboard.
Pipeline Name
Name of the pipeline
Source Type
‘Branch Fixed’ or ‘Tag Regex’
Branch Name
Name of the branch
Welcome! This is the documentation for Deploying Applications
Parts of Documentation
Click on Create New and the select Custom app to create a new application.
As soon you click on Custom app, you will get a popup window on screen where you have to enter app name and project for the application. there are two radio buttons present on the popup window, one is for Blank app and another one is for Clone an existing app. For cloning an existing application, select the second one. After this, one more drop-down will appear on the window from which you can select the application that you want to clone. For this, you will have to type minimum three character to see the matching results in the drop-down. After typing the matching characters, select the applicaion that you want to clone. You also can add additional information about the application (eg. created by, Created on) using tags (only key:value allowed).
App Name
Name of the new app you want to Create
Project
Project name
Select an app to clone
Select the application that you want to clone
Tags
Additional informations about the application
Now click on Clone App to clone the selected application.
New application with a duplicate template is created.
The CI Pipeline can be triggered by selecting Select Material
CI Pipelines that are set as automatic are always triggered as soon as a new commit is made to the git branch they're sensing. However, CI pipelines can always be manually triggered as and if required.
Various commits done in the repository can be seen, here along with details like Author, Date etc. Select the commit that you want to trigger and then click on Start Build to trigger the CI pipeline.
Refresh icon, refreshes Git Commits in the CI Pipeline and fetches the latest commits from the “Repository”
Ignore Cache : This option will ignore the previous build cache and create a fresh build. If selected, will take a longer build time than usual.
It can be seen that the pipeline is triggered here and is the Running state.
Click on your CI Pipeline or click on Build History to get the details about the CI pipeline such as logs, reports etc.
You can read the logs of the CI Pipeline from here.
Click on Source code to view the details such as commit id, Author and commit message of the Git Material that you have selected for the build.
Click on Artifacts to download the reports of the Pre-CI and Post-CI stages if any.
If you want to check the current version of Devtron you are using, please use the following command.
Fetch the latest Devtron helm chart
Input the target Devtron version that you want to upgrade to. You can find the latest releases from Devtron on Github https://github.com/devtron-labs/devtron/releases
Upgrade Devtron
Input the target Devtron version that you want to upgrade to. You can find the latest releases from Devtron on Github https://github.com/devtron-labs/devtron/releases
Patch Devtron Installer
API tokens are like ordinary OAuth access tokens. They can be used instead of username and password for programmatic access to API. API token allows users to generate API tokens with the desired access. Only super admin users can generate tokens and see generated tokens.
Enter a name for the token
Add Description.
Now click on Generate Token.
Once devtron api token has been generated, you can use this token to hit devtron apis using any api testing tool like Jmeter, postman, citrus. Using postman here.
Open postman. Enter the request URL with POST method and under HEADERS, enter the API token as shown in the image below.
Now, under body, provide the api payload as shown below and click on Send.
As soon as you click on send, the create application api will be triggered and a new devtron app will be created as you mentioned in the payload.
To set a new expiration date or to make changes in permissions assigned to the token, we need to update the API token. To update the API token, click over the token name or click on the edit icon.
To delete an API token, click on the delete icon. Any applications or scripts using this token will no longer be able to access the Devtron API.
Welcome! This is the documentation for Deploying Charts.
Parts of Documentation
After CI pipeline is complete, CD pipeline can be triggered by clicking on Select Image.
Select an image to deploy and then click on Deploy to trigger the CD pipeline.
The current deployed images are tagged as Deployed on <Environment name>.
The status of the current deployment can be viewed by Clicking on App Details that will show the Progressingstate for 1-2 minutes and then gradually shows Healthy state or Hibernating state, based on the deployment strategy.
Here, triggering CD pipeline is successful and the deployment is in "Healthy" state.
Source type to trigger the CI. Available options: | |
Select the source type to build the CI pipeline: | |
If you want to configure your ConfigMap and secrets at the application level then you can provide them in and , but if you want to have environment-specific ConfigMap and secrets then provide them under the Environment override Section. At the time of deployment, it will pick both of them and provide them inside your cluster.
[Note] It only works if Git Host is Github or Bitbucket Cloud as of now. In case you need support for any other Git Host, please create a .
Devtron uses regexp library, view . You can test your custom regex from .
Users can run the test case using the Devtron dashboard or by including the test cases in the devtron.ci.yaml file in the source git repository. For reference, check:
Click on security to see if there is any vulnerabilitiesin the build image. You can see the vulnerabilities here only if you have enabled Scan for vulnerabilities before building image from advanced options of CI pipeline. To know more about this feature, follow our .
To generate API tokens, go to global configurations -> Authorizations -> API tokens and click on Generate New Token.
Select an Expiration date for the token(7 days, 30 days, 60 days, 90 days, custom and no expiration) To select a custom expiration date, select Custom from the drop-down. This will pop-up a calender from where you can select your custom expiration date for the API token.
Assign permissions to the token. To generate a token with super admin permission, select super admin permission. Or select specific permission if you want to generate a token with a specific role over a particular Devtron app or Helm app or chart group.
A pop-up window will appear over the screen from where you can copy the API token.
To set a new expiration date, you can regenerate the API token. Any scripts or applications using this token will need to be updated. To regenerate a token, click on regenerate token. A pop-up window will appear on the screen from where you can select a new expiration date and then click on regenerate token.
Select a new expiration date and click on regenerated token. This will generated a new token with new expiration date.
To update API token permissions, give the permissions as you want to and click on update token.


Once you are done creating your CI pipeline, you can move start building your CD pipeline. Devtron enables you to design your CD pipeline in a way that fully automates your deployments.
Click on “+” sign on CI Pipeline to attach a CD Pipeline to it. A basic Create deployment modal will pop up.
This section expects two inputs:
Select Environment
Deployment Strategy
This section further including two inputs:
(a) Deploy to Environment
Select the environment where you want to deploy your application.
(b) Namespace
This field will be automatically populated with the Namespace corresponding to the Environment selected in the previous step.
Click on Create Pipeline to create a CD pipeline.
One can have a single CD pipeline or multiple CD pipelines connected to the same CI Pipeline. Each CD pipeline corresponds to only one environment, or in other words, any single environment of an application can have only one CD pipeline. So, the images created by the CI pipeline can be deployed into multiple environments through different CD pipelines originating from a single CI pipeline. If you already have one CD pipeline and want to add more, you can add them by clicking on the
+sign and then choosing the environment in which you want to deploy your application. Once a new CD Pipeline is created for the environment of your choosing, you can move ahead and configure the CD pipeline as required. Your CD pipeline can be configured for the pre-deployment stage, the deployment stage, and the post-deployment stage. You can also select the deployment strategy of your choice. You can add your configurations as explained below:
To configure the advance CD option click on Advance Options at the bottom.
Pipeline Name
Enter the name of the pipeline to be created
Environment
Select the environment in which you want to deploy
Pre-deployment stage
Run any configuration and provide secrets before the deployment
Deployment stage
Select how and when you want the deployment to be triggered - Automatic or manual triggering of your CD Pipeline
Deployment Strategy
Select the type of deployment strategy that you want to enable by clicking Add Deployment Strategy
Post-deployment stage
If you need to run any configurations and provide secrets after the deployment, mention those here
Pipeline name will be autogenerated.
As we discussed above, Select the environment where you want to deploy your application. Once you select the environment, it will display the Namespace corresponding to your selected environment automatically.
There are 3 dropdowns given below:
Pre-deployment stage
Deployment stage
Post-deployment stage
Sometimes one has a requirement where certain actions like DB migration are to be executed before deployment, the Pre-deployment stage should be used to configure these actions.
Pre-deployment stages can be configured to be executed automatically or manually.
If you select automatic, Pre-deployment Stage will be triggered automatically after the CI pipeline gets executed and before the CD pipeline starts executing itself. But, if you select a manual, then you have to trigger your stage via console.
If you want to use some configuration files and secrets in pre-deployment stages or post-deployment stages, then you can use the Config Maps & Secrets options.
Config Maps can be used to define configuration files. And Secrets can be defined to store the private data of your application.
Once you are done defining Config Maps & Secrets, you will get them as a drop-down in the pre-deployment stage and you can select them as part of your pre-deployment stage.
These Pre-deployment CD / Post-deployment CD pods can be created in your deployment cluster or the devtron build cluster. It is recommended that you run these pods in the Deployment cluster so that your scripts (if there are any) can interact with the cluster services that may not be publicly exposed.
If you want to run it inside your application, then you have to check the Execute in application Environment option else leave it unchecked to run it within the Devtron build cluster.
Make sure your cluster has devtron-agent installed if you check the Execute in the application Environment option.
(a) Deploy to Environment
Select the environment where you want to deploy your application. Once you select the environment, it will display the Namespace corresponding to your selected environment automatically.
(b)We support two methods of deployments - Manual and Automatic. If you choose automatic, it will trigger your CD pipeline automatically once the corresponding CI pipeline has been executed successfully.
If you have defined pre-deployment stages, then the CD Pipeline will be triggered automatically after the successful execution of your CI pipeline followed by the successful execution of your pre-deployment stages. But if you choose the manual option, then you have to trigger your deployment manually via console.
(c) Deployment Strategy
Devtron's tool has 4 types of deployment strategies. Click on Add Deployment strategy and select from the available options:
(a) Recreate
(b) Canary
(c) Blue Green
(d) Rolling
If you want to Configure actions like Jira ticket close, that you want to run after the deployment, you can configure such actions in the post-deployment stages.
Post-deployment stages are similar to pre-deployment stages. The difference is, pre-deployment executes before the CD pipeline execution and post-deployment executes after the CD pipeline execution. The configuration of post-deployment stages is similar to the pre-deployment stages.
You can use Config Map and Secrets in post deployments as well, as defined in the Pre-Deployment stages.
Once you have configured the CD pipeline, click on Create Pipeline to save it. You can see your newly created CD Pipeline on the Workflow tab attached to the corresponding CI Pipeline.
You can update the deployment stages and the deployment strategy of the CD Pipeline whenever you require it. But, you cannot change the name of a CD Pipeline or its Deployment Environment. If you need to change such configurations, you need to make another CD Pipeline from scratch.
To Update a CD Pipeline, go to the App Configurations section, Click on Workflow editor and then click on the CD Pipeline you want to Update.
Make changes as needed and click on Update Pipeline to update this CD Pipeline.
If you no longer require the CD Pipeline, you can also Delete the Pipeline.
To Delete a CD Pipeline, go to the App Configurations and then click on the Workflow editor. Now click on the pipeline you want to delete. A pop will be displayed with CD details. Verify the name and the details to ensure that you are not accidentally deleting the wrong CD pipeline and then click on the Delete Pipeline option to delete the CD Pipeline.
A deployment strategy is a way to make changes to an application, without downtime in a way that the user barely notices the changes. There are different types of deployment strategies like Blue/green Strategy, Rolling Strategy, Canary Strategy, Recreate Strategy. These deployment configuration-based strategies are discussed in this section.
Blue Green Strategy
Blue-green deployments involve running two versions of an application at the same time and moving traffic from the in-production version (the green version) to the newer version (the blue version).
autoPromotionSeconds
It will make the rollout automatically promote the new ReplicaSet to active Service after this time has passed
scaleDownDelaySeconds
It is used to delay scaling down the old ReplicaSet after the active Service is switched to the new ReplicaSet.
previewReplicaCount
It will indicate the number of replicas that the new version of an application should run
autoPromotionEnabled
It will make the rollout automatically promote the new ReplicaSet to the active service.
Rolling Strategy
A rolling deployment slowly replaces instances of the previous version of an application with instances of the new version of the application. Rolling deployment typically waits for new pods to become ready via a readiness check before scaling down the old components. If a significant issue occurs, the rolling deployment can be aborted.
maxSurge
No. of replicas allowed above the scheduled quantity.
maxUnavailable
Maximum number of pods allowed to be unavailable.
Canary Strategy
Canary deployments are a pattern for rolling out releases to a subset of users or servers. The idea is to first deploy the change to a small subset of servers, test it, and then roll the change out to the rest of the servers. The canary deployment serves as an early warning indicator with less impact on downtime: if the canary deployment fails, the rest of the servers aren't impacted.
maxSurge
It defines the maximum number of replicas the rollout can create to move to the correct ratio set by the last setWeight
maxUnavailable
The maximum number of pods that can be unavailable during the update
setWeight
It is the required percent of pods to move to the next step
duration
It is used to set the duration to wait to move to the next step.
Recreate
The recreate strategy is a dummy deployment that consists of shutting down version A then deploying version B after version A is turned off. A recreate deployment incurs downtime because, for a brief period, no instances of your application are running. However, your old code and new code do not run at the same time.
It terminates the old version and releases the new one.
Devtron now supports attaching multiple deployment pipelines to a single build pipeline, in its workflow editor. This feature lets you deploy an image first to stage, run tests and then deploy the same image to production.
Please follow the steps mentioned below to create sequential pipelines :
After creating CI/build pipeline, create a CD pipeline by clicking on the + sign on CI pipeline and configure the CD pipeline as per your requirements.
To add another CD Pipeline sequentially after previous one, again click on + sign on the last CD pipeline.
Similarly, you can add multiple CD pipelines by clicking + sign of the last CD pipeline, each deploying in different environments.
Note: Deleting a CD pipeline also deletes all the K8s resources associated with it and will bring a disruption in the deployed micro-service. Before deleting a CD pipeline, please ensure that the associated resources are not being used in any production workload.
This Documentation guides you to Deploy different Helm Charts available on Devtron.
Parts of Documentation


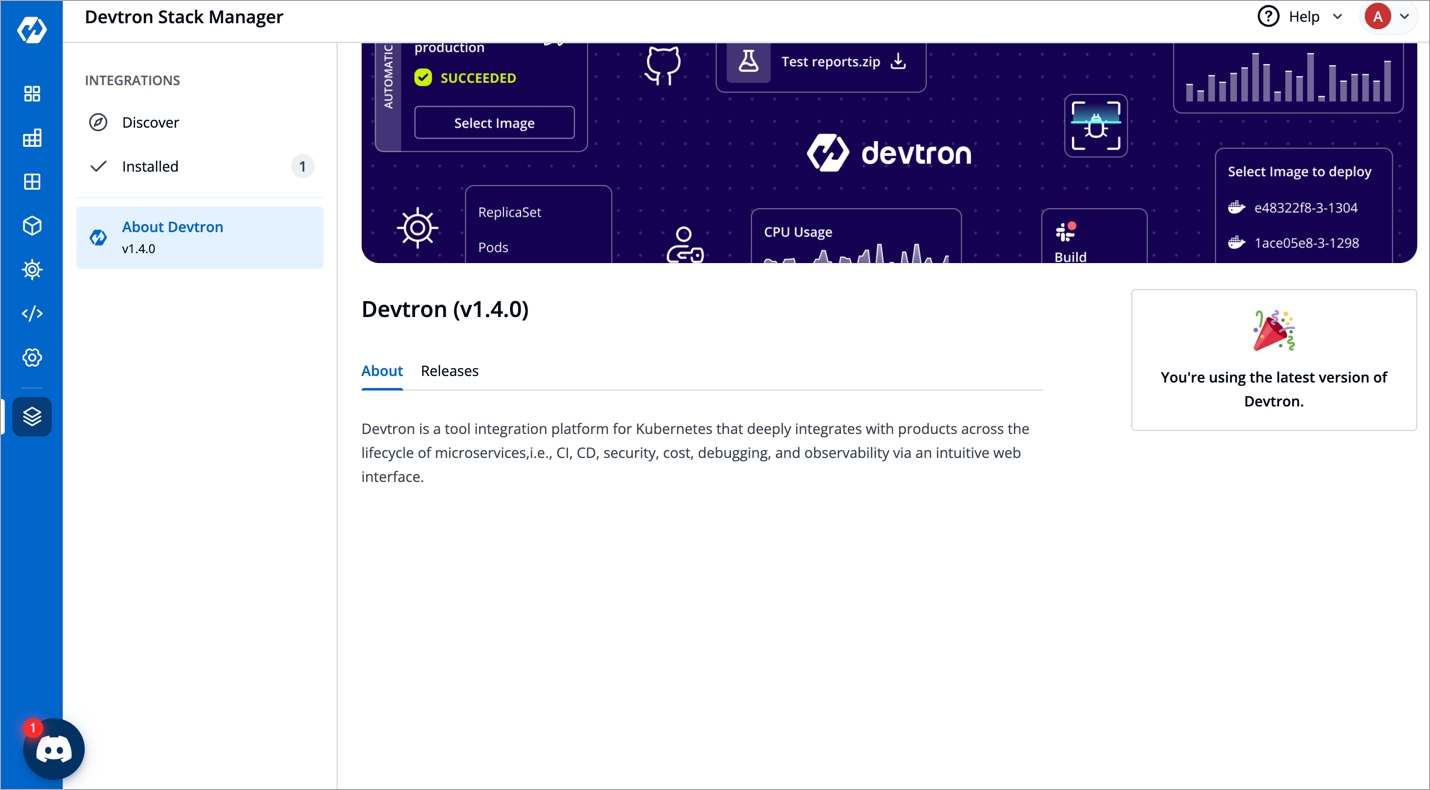

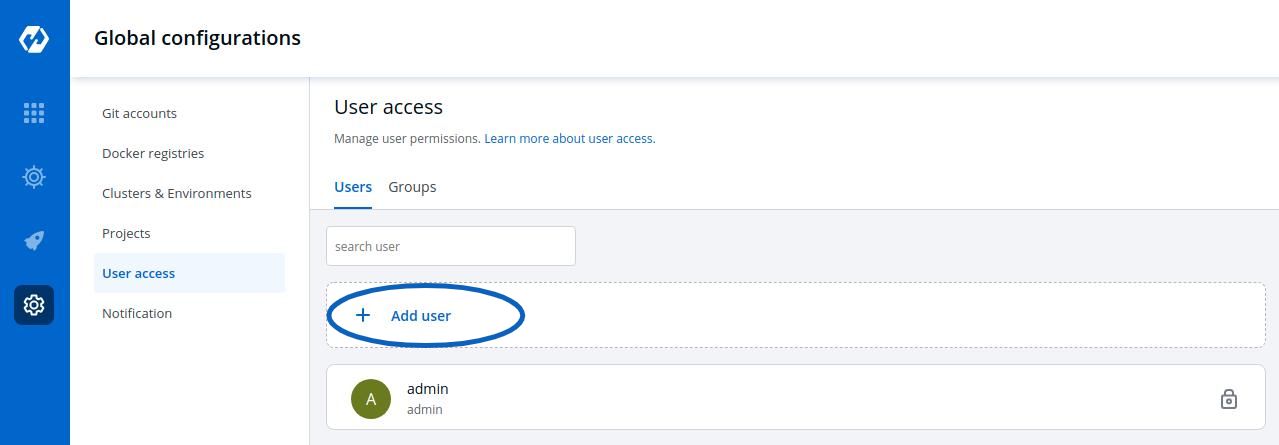
Using Devtron UI, one or more Helm charts can be grouped and deployed together with a single click.
In the left pane, select Charts.
On the Chart Store page, select Create Group from the upper-right corner.
In the Create Chart Group screen, enter name and description(optional) for the chart group, and then select Create Group.
Once you create the group, you can now select and add the charts to this chart group.
To add a chart to the group, click the + sign at the top-right corner of a chart, and then select Save.
Click on Group Detail to see all the running instances and group details. You can also edit the chart group from here.
You can see all the charts in the chart group in the right panel.
Select Deploy to...
In the Deploy Selected Charts, select the Project and Deploy to Environment values where you want to deploy the chart group.
Select Advanced Options for more deploy options, such as editing the values.yaml or changing the Environment and Project for each chart.


This feature helps you to update Deployment Template, ConfigMaps & Secrets for multiple apps in one go! You can filter the apps on the basis of environments, global flag, and app names(we provide support for both substrings included and excluded in the app name).
Need to make some common changes across multiple devtron applications? Bulk Edit allows you to do that.
Eg. You can change the value for MaxReplicas in Deployment Templates of multiple Devtron applications or you can add key-value pairs in multiple ConfigMaps & Secrets.
Bulk edit is currently supported for:
Deployment Template
ConfigMaps
Secrets
Click on the Bulk Edit option in the main navigation. This is where you can write and execute scripts to perform bulk updates in Devtron objects.
To help you get started, a script template is provided under the See Samples section.
Copy and Paste the Sample Script in the code editor and make desired changes. Refer Payload Configuration in the Readme to understand the parameters.
Example below will select all applications having abc and xyz present in their name and out of those will exclude applications having abcd and xyza in their name. Since global flag is false and envId 23 is provided, it will make changes in envId 23 and not in global deployment template for this application.
If you want to update globally then please set global: true. If you have provided an envId but deployment template, configMap or secret is not overridden for that particular environment then it will not apply the changes. Also, of all the provided names of configMaps/secrets, for every app & environment override only the names that are present in them will be considered.
This is the piece of code which works as the input and has to be pasted in the code editor for achieving bulk updation task.
The following tables list the configurable parameters of the Payload component in the Script and their description along with example. Also, if you do not need to apply updates on all the tasks, i.e. Deployment Template, ConfigMaps & Secrets, leave the Spec object empty for that respective task.
includes.names
Will filter apps having exact string or similar substrings
["app%","%abc", "xyz"] (will include all apps having "app%" OR "%abc" as one of their substring, example - app1, app-test, test-abc etc. OR application with name xyz)
excludes.names
Will filter apps not having exact string or similar substrings.
["%z","%y", "abc"] (will filter out all apps having "%z" OR "%y" as one of their substring, example - appz, test-app-y etc. OR application with name abc)
envIds
List of envIds to be updated for the selected applications.
[1,2,3]
global
Flag to update global deployment template of applications.
true,false
deploymentTemplate.spec.patchJson
'[ { "op": "add", "path": "/MaxSurge", "value": 1 }, { "op": "replace", "path": "/GracePeriod", "value": "30" }]'
configMap.spec.names
Names of all ConfigMaps to be updated.
configmap1,configmap2,configmap3
secret.spec.names
Names of all Secrets to be updated.
secret1,secret2
configMap.spec.patchJson / secret.spec.patchJson
'[{ "op": "add", "path": "/{key}", "value": "{value}" },{"op": "replace","path":"/{key}","value": "{value}"}]'(Replace the {key} part to the key you want to perform operation on & the {value}is the key's corresponding value
Once you have modified the script, you can click on the Show Impacted Objects button to see the names of all applications that will be modified when the script is Run.
Click on the Run button to execute the script. Status/Output of the script execution will be shown in the Output section of the bottom drawer.
String having the update operation(you can apply more than one changes at a time). It supports specifications for update.
String having the update operation for ConfigMaps/Secrets(you can apply more than one changes at a time). It supports specifications for update.


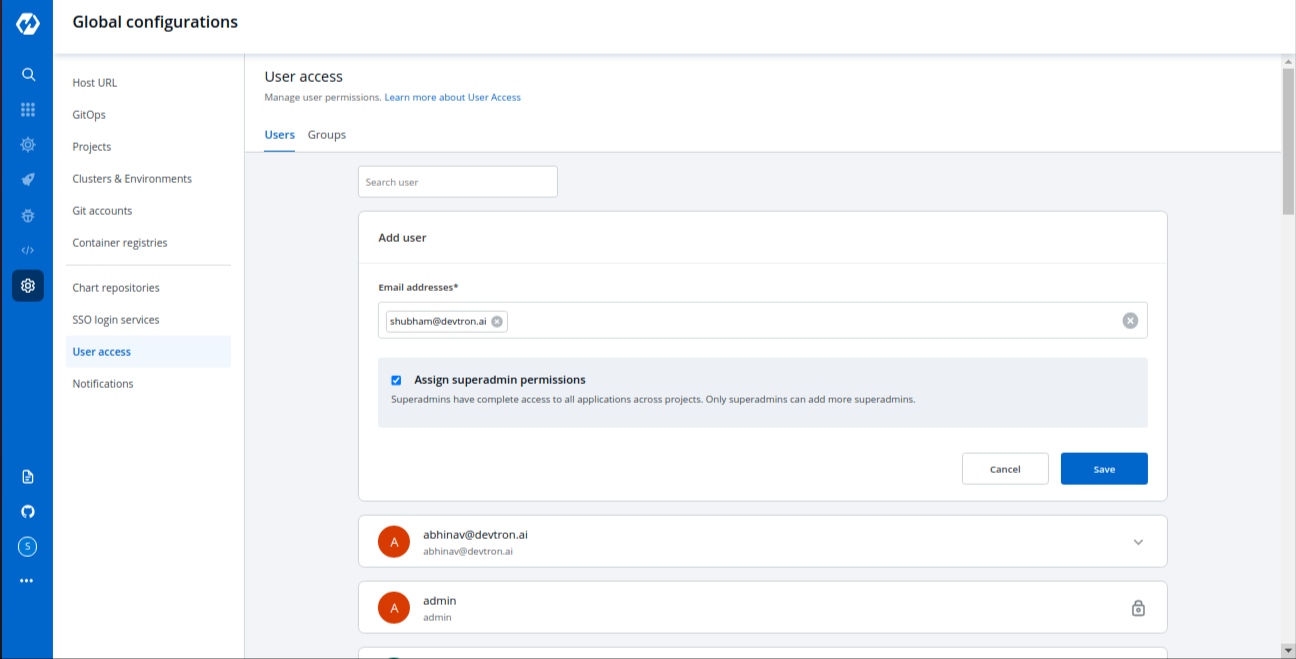
If the deployment of your application is not successful, then debugging needs to be done to check the cause of the error.
This can be done through App Details section which you can access in the following way:-
Applications->AppName->App Details
Over here, you can see the status of the app as Healthy. If there are some errors with deployment then the status would not be in a Healthy state.
Events of the application are accessible from the bottom left corner.
Events section displays you the events that took place during the deployment of an app. These events are available until 15 minutes of deployment of the application.
Logs contain the logs of the Pods and Containers deployed which you can use for the process of debugging.
The Manifest shows the critical information such as Container-image, restartCount, state, phase, podIP, startTime etc. and status of the pods deployed.
You might run into a situation where you need to delete Pods. You may need to bounce or restart a pod.
Deleting a Pod is not an irksome task, it can simply be deleted by Clicking on Delete Pod.
Suppose you want to setup a new environment, you can delete a pod and thereafter a new pod will be created automatically depending upon the replica count.
You can view Application Objects in this section of App Details, such as:
Workloads
ReplicaSet(ensures how many replica of pod should be running), Status of Pod(status of the Pod)
Networking
Service(an abstraction which defines a logical set of Pods), Endpoints(names of the endpoints that implement a Service), Ingress(API object that manages external access to the services in a cluster)
Config & Storage
ConfigMap( API object used to store non-confidential data in key-value pairs)
Custom Resource
Rollout(new Pods will be scheduled on Nodes with available resources), ServiceMonitor(specifies how groups of services should be monitored)
You can monitor the application in the App Details section.
Metrics like CPU Usage, Memory Usage, Throughput and Latency can be viewed here.
CPU Usage
Percentage of CPU's cycles used by the app.
Memory Usage
Amount of memory used by app.
Throughput
Performance of the app.
Latency
Delay caused while transmitting the data.
Welcome, this document consists of Devtron Use Cases


Charts can be deployed individually or by creating a group of Charts. Both methods are mentioned here.
To deploy any chart or chart group, visit the Charts section from the left panel and then select the chart that you want to use.
Click on README.md to get more ideas about the configurations of the chart.
Select the Chart Version that you want to use and Chart Value, you can either use the Default Values or Custom Values.
The configuration values can be edited in the section given below Chart Version.
App Name
Name of the app
Project
Project of the app
Environment
Environment of the app to be deployed in
Chart Version
Version of the chart to be used
Readme.md present on the left can be used by the user to set configuration values.
Click on Deploy Chart to deploy the chart.
Click on App Details to see the status and details of the deployed chart and click on Values to reconfigure the deployment.
Configuration values can be edited over here by the help of Readme.md.
Click on Update And Deploy to update new settings. You can also see deployment history of Helm application and values.yaml corresponding to the deployment by clicking on Deployment history.
You can use the default values or create Custom value by clicking on Create Custom.
You can name your Custom Value, select the Chart Version and change the configurations in YAML file.
Click on Save Template to save the configurations.
You can deploy multiple applications and work with them simultaneously by creating Chart Group. To create chart group click on Create Group.
Add the Group Name and Description(optional), and select Create Group.
You can select the Charts that you want to add to your Chart Group by clicking on '+' sign. You also can add multiple copies of the same chart in the chart group according to your requirements.
Select the Version and Values for your charts. You can use Default Values or the Custom Values, just make sure the value that you select for the chart is compatible with the version of the chart that you are using.
To edit the chart configuration, Click on Edit.
You can Add more charts or Delete charts from your existing Chart Group. After making any changes, click on Save to save changes for the Chart Group.
If you wish to edit the chart configuration of any chart in the chart group, click on that Chart and edit the configurations in YAML file. You also can edit the App Name, Chart Version, Values, Deploy Environment and the YAML file from here.
App Name
Name of the app
Project
Name of Project in which app has to be created
Environment
Name of the Environment in which app has to be deployed
Chart Version
Select the Version of the chart to be used
After changing the configurations, click on Deploy to initiate the deployment of the chart in the Chart Group.
To know about Custom Values, Click On:
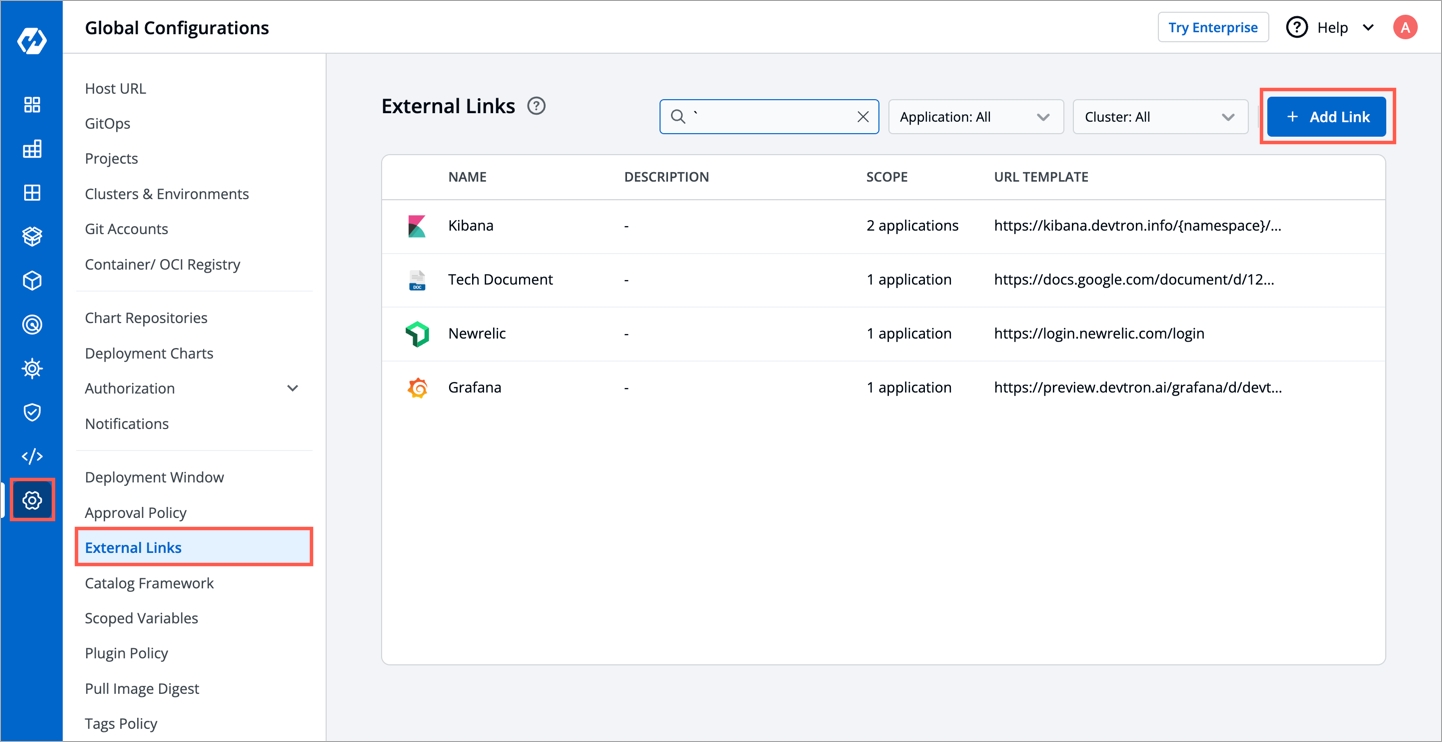
You can discover over 200 Charts from the Devtron Chart store to perform different tasks such as to deploy a YAML file.
You can use Devtron-generic-Helm Chart to run the cron jobs or one time job.
Select the Devtron-generic Helm Chart from the Devtron Chart Store.
Select the Chart Version and the Chart Value of the Chart.
And, then click on Deploy
Configure Devtron-generic-helm chart
Click on Deploy Chart
App Name
Name of the app
Project
Name of the Project
Environment
Select the Environment in which you want to deploy app
Chart Version
Select the Version of the chart
Chart Values
Select the Chart Value or Create a Custom Value
In values.yaml, you can specify the YAML file that schedules the cron job for your application.


This document will help you to deploy a sample Spring Boot Application, using mysql Helm Chart
Set the database configuration in this file.
In this example, we are using the url of the forked Git repository.
Give, the path of the Dockerfile.
Enable Ingress, and give the path on which you want to host the application.
Set up the CI/CD pipelines. You can set them to trigger automatically or manually.
Trigger the CI Pipeline, build should be Successful. Then trigger the CD Pipeline, deployment pipeline will be initiated, after some time the status should be Healthy.
It exposes 3 REST endpoints for it's users to create, to view specific student record and view all student records.
To test Rest API, you can use curl command line tool
Create a new Student Record
Create a new POST request to create a new Transaction. Once the transaction is successfully created, you will get the student id as a response.
Curl Request is as follows:
View All Student's Data
To view all student records, GET Request is:
path will be the one that you have given in Step 3 while configuring the Deployment Template.
http://<hostname>/<path>/viewAll
View student's data By student ID
To view student data by student id, GET Request is:
http://<hostname>/<path>/view/<id>
path will be the one that you have given in Step 3 while configuring the Deployment Template.
To deploy mysql Helm Chart, you can refer to our documentation on
For this example, we are using the following , you can clone this repository and make following changes in the files.
To learn how to create an application on Devtron, refer to our documentation on


Welcome! This is the documentation for Creating Applications
Parts of Documentation
In this application, you will learn about how to create a Expressjs Application that connects to mongoDb.
Follow the below-mentioned steps, to deploy the application on Devtron using mongoDb Helm Chart.
This is the Dockerfile. This exposes our expressjs application to port number 8080
This file will be used to connect to our database. This will include the service-name of the mongoDb Helm Chart, that you have deployed in Step1.
The syntax is as follows:
<service-name>:27017/<database-name>
This maps our service name to mongoDb's port number 27017.
In this example, we are using the url of the forked Git Repository.
Give, the path of the Dockerfile.
Enable Ingress, and give the path on which you want to host the application.
Set up the CI/CD pipelines. You can set them to trigger automatically or manually.
Trigger the CI Pipeline, build should be Successful, then trigger the CD Pipeline, deployment pipeline will be initiated, after some time the status should be Healthy
Check the Expressjs app connected to mongodb database, running successfully by hitting your application url.
The syntax is: http://<hostname>/<path>/
path will be the one that you have given in Step 3 while configuring the Deployment Template.
The output of our application would be as follows:
You can see that we are getting the JSON response. We have successfully connected our expressjs application to the mongoDb database.
To deploy mongoDb Helm Chart, you can refer to our documentation on
For this example, we are using the following , you can clone this repository and make following changes in the files.
To learn how to create an application on Devtron, refer to our documentation on


This occurs most of the time because any one or multiple jobs get failed during installation. To resolve this, you'll need to first check which jobs have failed. Follow these steps:
Run the following command and check which are the jobs with 0/1 completions:
Note down or remember the names of jobs with 0/1 completions and check if their pods are in running state still or not by running the command: kubectl get pods -n devtroncd
If they are in running condition, please wait for the jobs to be completed as it may be due to internet issue and if not in running condition, then delete those incomplete jobs using: kubectl delete jobs -n devtroncd
Now download migrator.yaml file from our github repository using the command: wget https://raw.githubusercontent.com/devtron-labs/devtron/main/manifests/yamls/migrator.yaml
Now edit the file you downloaded in step 3 and remove the postgresql-migrator secret resource creation and then apply the yaml file using the command: kubectl apply -f migrator.yaml -n devtroncd
It will re-create the failed jobs and you’ll see their pods created again. Just wait for a few minutes until the jobs gets completed then you are good to go. You should be able to save your global configurations now.
Update the rollout crds to latest version, run the following command:
Delete devtron pod once to reload the configurations using:
Check if the pods are being created when you start a new build, run the command and look if a new pod is created when you started the build:
If yes, delete kubewatch and devtron pod so that kubewatch can restart and start sharing the logs again:
Wait for 5 minutes and then trigger a new build again, if still not resolved then run the following commands one by one
Again wait for 5 minutes and your issue should be resolved
If the graphs are not visible check if prometheus is configured properly. Then go to Global Configurations > Clusters & Environments > Click on any environment for the cluster where you added prometheus endpoint and simply click Update.
If the charts are still not visible, try visiting the url: /grafana?orgId=2
If you see Not Found on this page, then follow all the given steps or if the page is accessible and you are getting panel with id 2 not found then follow from step 6:
Get grafana password using kubectl -n devtroncd get secret devtron-secret -o jsonpath='{.data.GRAFANA_PASSWORD}' | base64 -d
kubectl run --rm -it --image quay.io/devtron/k8s-utils:tutum-curl curl Run this command and it will create a pod for using curl
Copy the following and change grafana-password with your password of grafana and change the value of prometheusUrl with your prometheus endpoint
and run in the pod that we created above in step 2. 4. Now visit /grafana?orgId=2 again and you'll see grafana login page. Login using username admin and password from step 1 and check if prometheus url is updated in datasources. If not, update it in the default datasource. 5. Now from devtron UI, update any of the environment again and it's datasource will be created automatically. 6. In Grafana UI you need to be logged in and Go to Dashboards > Manage then click Import and Import the given dashboards one by one.
After that, your issue should be resolved and you should be able to see all the graphs on UI.
If you are not able to login into Devtron dashboard even after giving the correct password, it is possible that the argocd token of previous session has been stored in the cookies and is not able to override the new token that is generated for the new session. If you are facing this issue, follow the steps below -
If using Firefox -
Goto login page of Devtron and open inspect.
Navigate to storage tab in inspect.
Click on url where Devtron has been installed under Cookies tab and you could see an argocd token with its value, something similar to below image.
Now right click on token, and click on Delete All Session Cookies option.
If using Chrome -
Goto login page of Devtron and open inspect.
Navigate to Application tab, and under Storage tab click on Cookies.
Click on url under Cookie and you would be able tto see an argocd token with its value, as shown in the image below.
Now right click on token and click on delete option.
If using Safari -
Goto Safari preferences >> Advanced options and check the show develop menu as shown in the image below.
Now goto login page of Devtron and press option+command+I. It will open inspect element.
Then navigate to Storage, click on Cookies and you would be able to see an argocd token with its value as shown in the image below.
Now right click on token and select delete option.
After clearing Cookies, try again to login, you should be able to login now.
In the Devtron's Discover Chart section, if you are not able to see any charts available, goto Global Configuration >> Chart Repositories and click on Refresh Chart at the top-right as shown in the image below. After clicking the button, it might take 4-5mins to show all the charts in Discover section depending upon the chart repositories added.
In Global Configurations >> Cluters & Environments, if you try to update a cluster which has been already added in Devtron, you might get an error as {"message":"Failed to update datasource. Reload new version and try again"}. If you are facing such issue, please follow the following steps -
Edit the changes you want to make in respective cluster
Click on save after making changes and you may get error message stated above.
Go to cluster where devtron has been installed and execute - kubectl -ndevtroncd delete po -l app=devtron
Now refresh the page and you should be able to save it.
[Note: If you already have created some environments in that cluster, it needs to be updated again]
Then delete postgresql pod so that it can fetch the updated images:
You can also delete other pods which are in crashloop after postgresql is up and running so that they can restart and connect to postgresql and Devtron will be up and running again in a few moments.
To solve this, bounce the git-sensor-0 pod.
Whitelist the NAT-gateway IPs of the cluster (There can be multiple NAT-gateways if your cluster is multi-AZ)
Do the following:-
Go to Grafana and Login with the credentials.
Edit the CPU graphs and remove image!=”” from the query.
Save the dashboard.
CPU metrics should start showing up in a while.
Please use below annotation in ingress
Note:- Where m is is MiB.
To solve
Disable certificate validation by passing --kubelet-insecure-tls argument to metrics server chart.
Description of issue
ERROR: database <db-name> is being accessed by other users
DETAIL: There is 1 other session using the database.
You have to terminate the connections to the database first, for that you can use the command.
Then run the command to delete database - drop databases <db-name>
Debug
Run the command for Admin Credentials and use it for login in dashboard
kubectl -n devtroncd get secret devtron-secret -o jsonpath='{.data.ACD_PASSWORD}' | base64 -d
If you are getting an error message of “invalid username or password”, follow the solution to solve it.
Solution
Run kubectl get secret -n devtroncd and then edit the argocd-secret, remove both the admin.password lines.
Run kubectl delete po your-argocd-server-pod -n devtroncd, it will create a new pod after deletion and reset your admin password. Re-run the command for admin credentials again to get the new password.
Debug
'base64' is not recognized as an internal or external command, operable program or batch file.
Solution
The first way to debug is either install base64 encode and decode into your windows machine and use the appropriate cmd to get the admin password.
The other way is to get the password in the encoded form using the cmd
UPGRADE FAILED: cannot patch "postgresql-postgresql" while upgrading Devtron to newer versionsDebug:
Description of error
Solution: Verify if annotations & lables are set to all k8s resources in devtroncd namespace and add --set components.postgres.persistence.volumeSize=20Gi parameter in Devtron upgrade command.
We always try to make your experience of using Devtron as smooth as possible but still if you face any issues, follow the troubleshooting guide given below or join our if you couldn't find the solution for the issue you are facing.
There may be some other pods also in crashloop as they are not able to connect to database. To resolve this issue, you can either or run the following commands to fix instantly on the same version you are using:
kubectl -n devtroncd get secret devtron-secret -o jsonpath='{.data.ACD_PASSWORD}', further decode it into plaintext using an online .
Make sure to all the Devtron resources.
Delete the Application, when you are sure you no longer need it.
Clicking on Delete Application will not delete your application if you have workflows in the application.
If your Application contains workflows in the Workflow Editor. So, when you click on Delete Application, you will see the following prompt.
Click on View Workflows to view and delete your workflows in the application.
To delete the workflows in your application, you must first delete all the pipelines (CD Pipeline, CI Pipeline or Linked CI Pipeline or External CI Pipeline if there are any).
After you have deleted all the pipelines in the workflow, you can delete that particular workflow.
Similarly, delete all the workflows in the application.
Now, Click on Delete Application to delete the application.
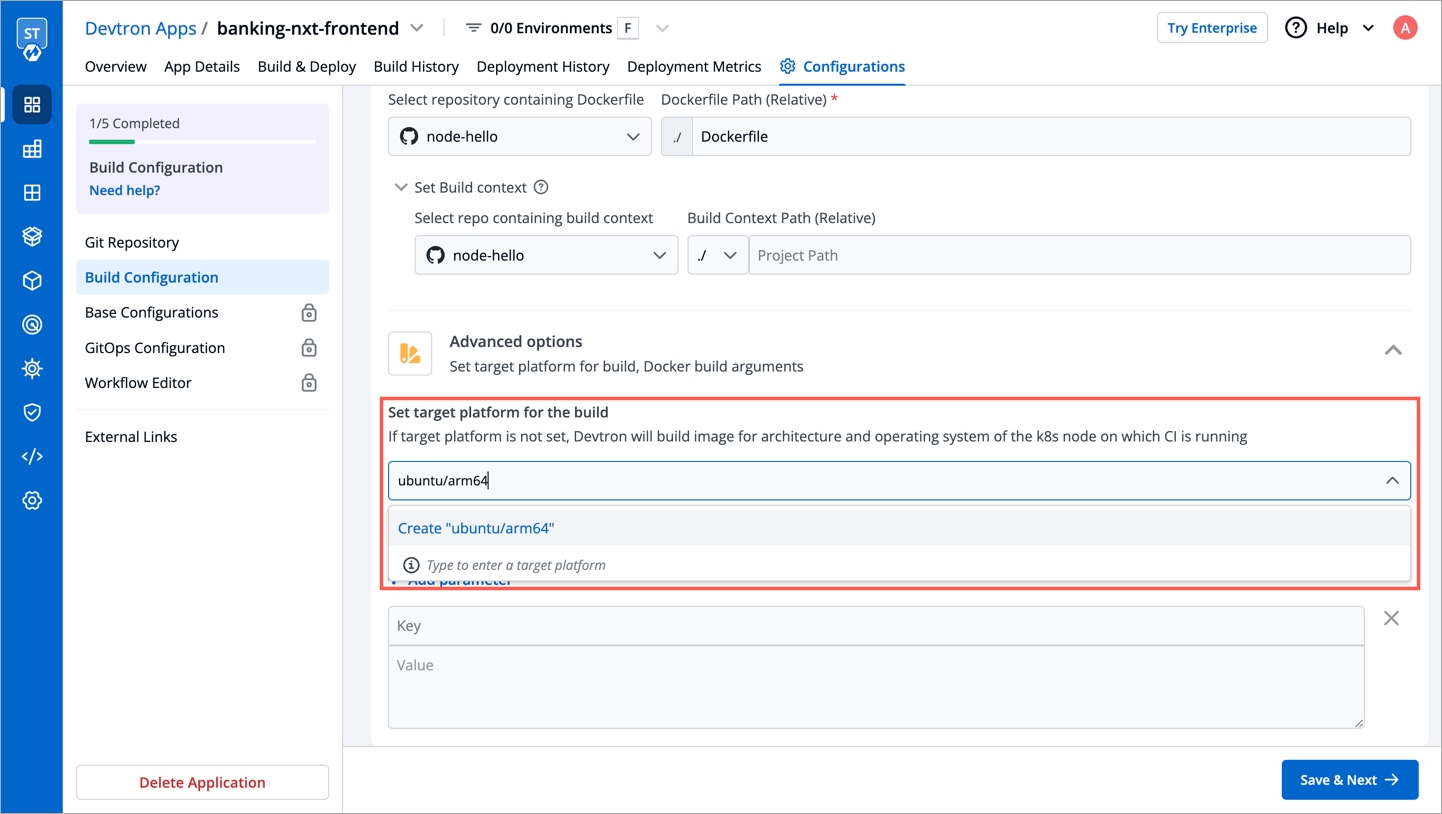
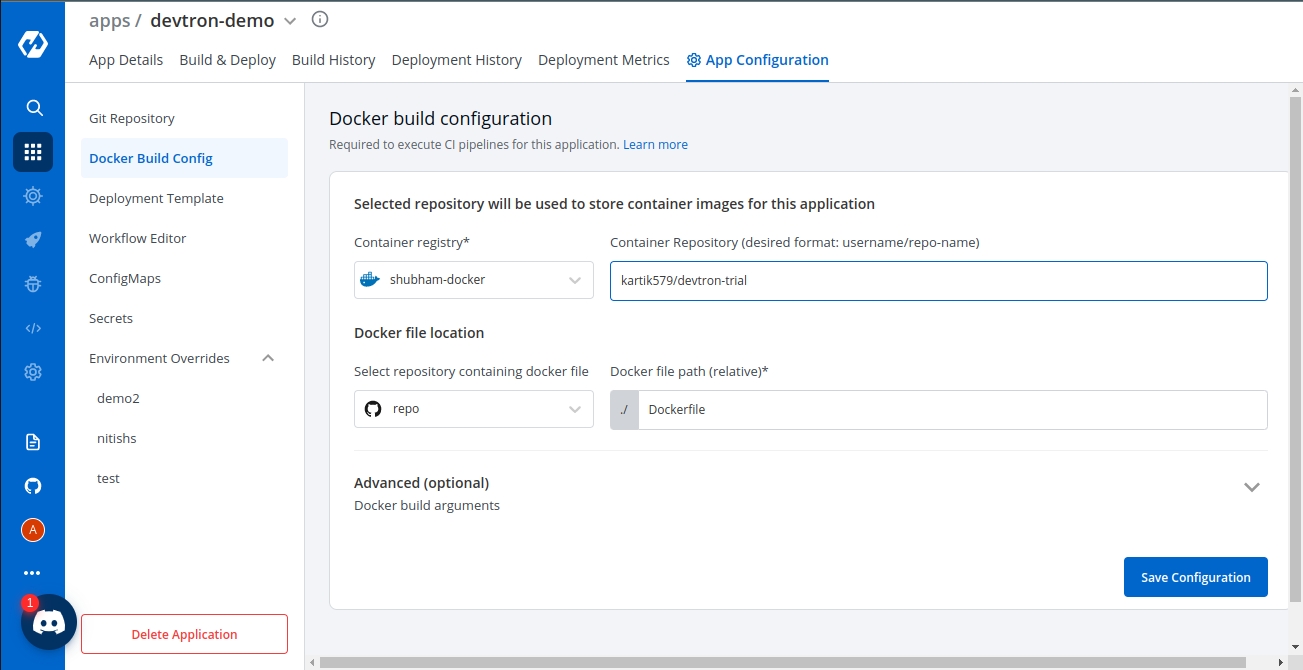
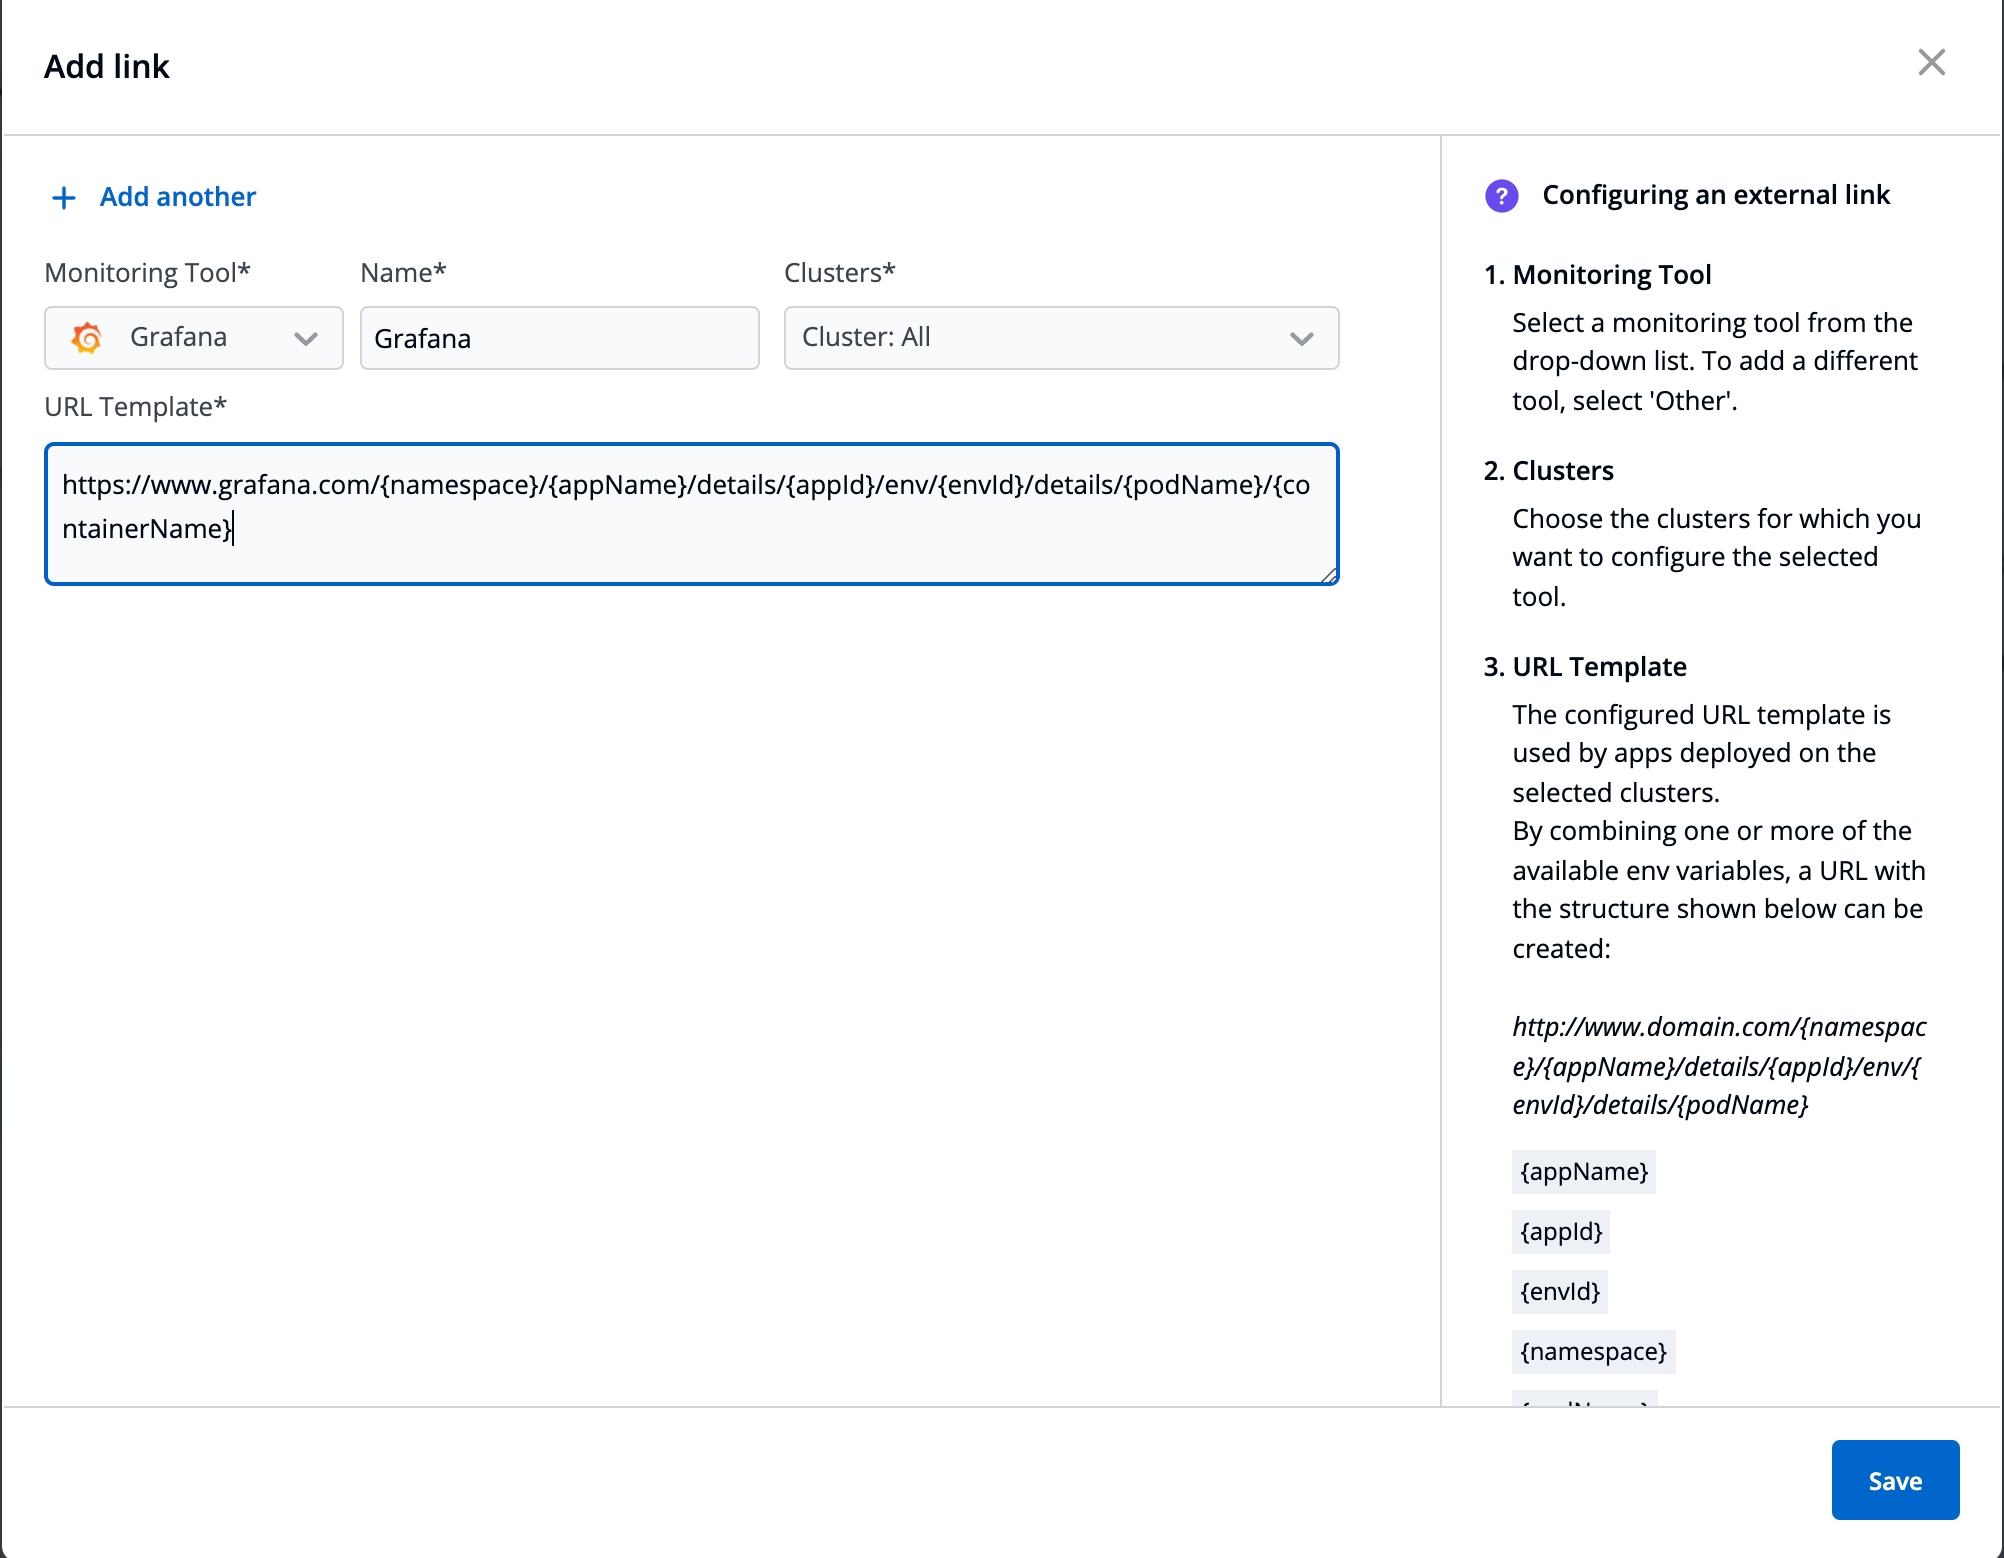
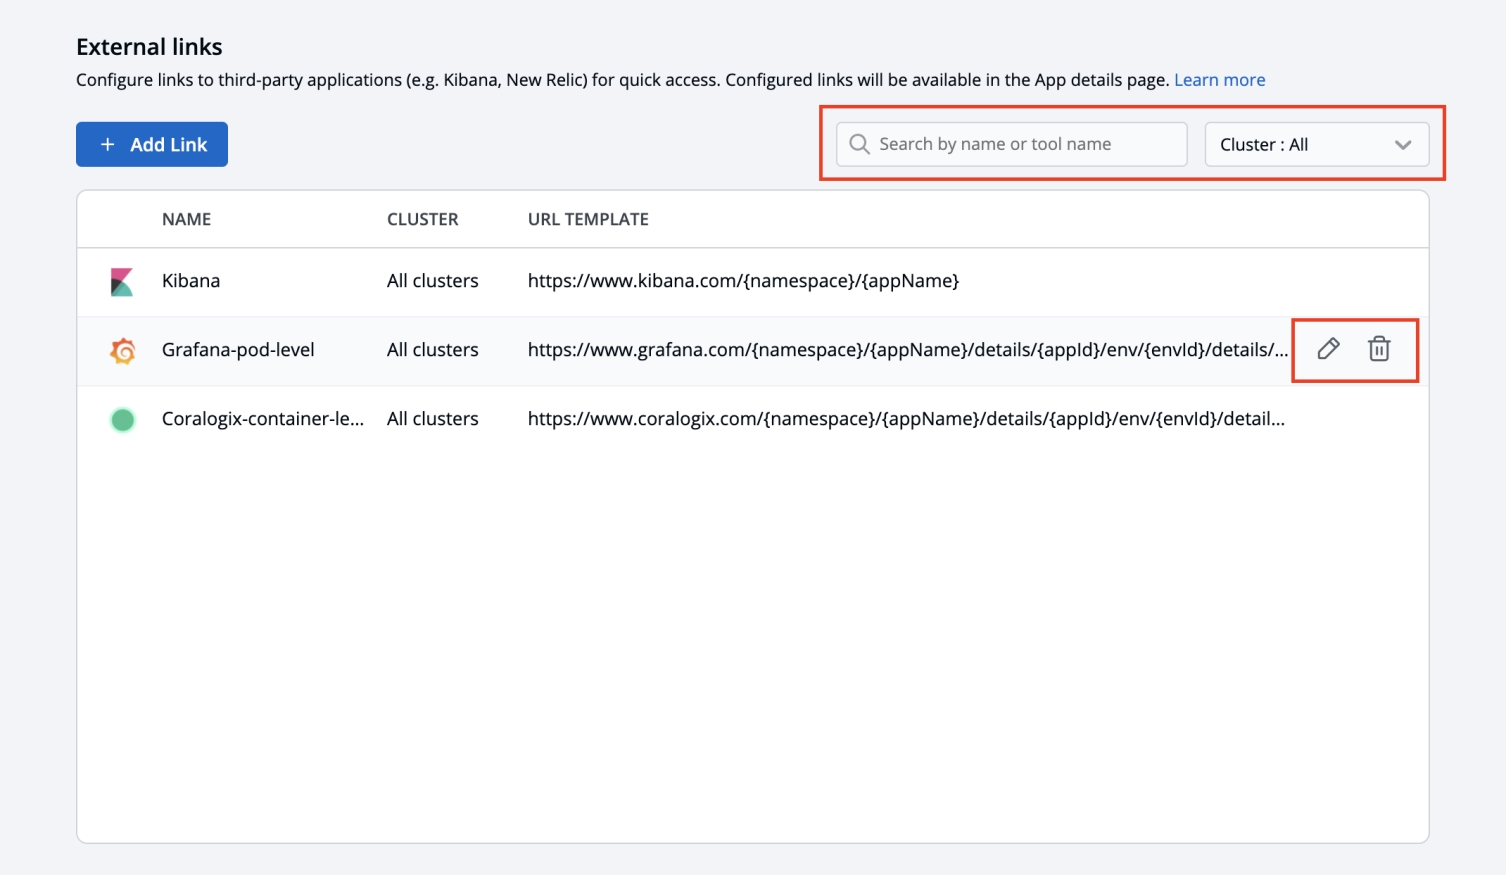
The command bar is designed to enable you to navigate across the devtron dashboard without having to click around the screen.
Top-level categories (eg. app, chart, security, global-config) are auto-filled depending upon your location on the Devtron dashboard.
You can clear the top-level category to navigate within other category locations.
Open Command bar
Cmd/Ctrl + /
Navigate
↓ ↑
Explore nested options
→
Navigate to a screen
Enter
Open command bar by clicking the 🔍 search icon on left navbar or pressing Cmd/Ctrl + /
Start typing the app name you're looking for.
Navigate using ↓ ↑ between the matching results and press → to view nested options.
Note: Pressing Enter on a highlighted option will navigate to the selected page location.
In this case, app / dashboard / configure / workflow-editor will navigate to the Workflow editor in dashboard application.
Similarly, you can use the command bar to navigate around the Devtron dashboard without a click.
We would love to know your experience with the command bar. Jump in to the


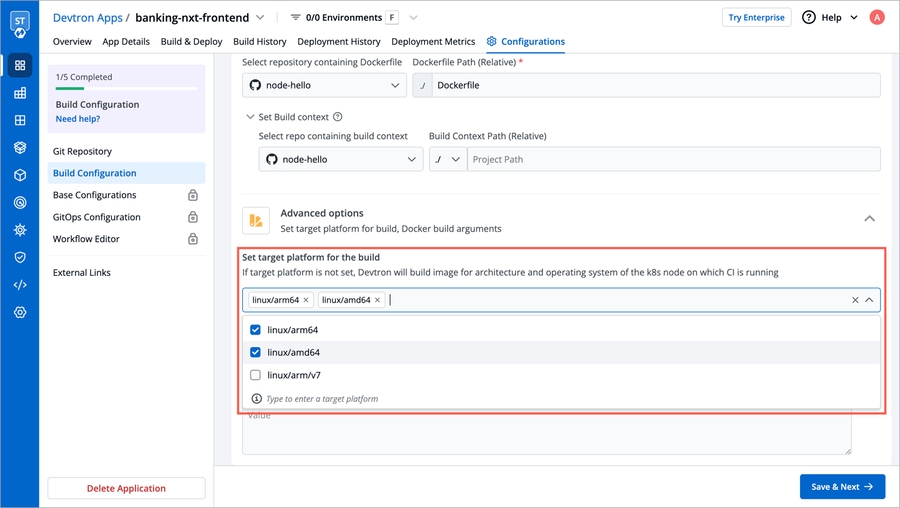
Let's assume that you are creating an application and want to use mongodb to store data of your application. You can deploy mongodb using stable/mongodb-replicaset Helm chart and connect it to your application.
This guide will introduce you to how to deploy the mongoDB's Helm chart.
Visit the Chart Store page by clicking on Charts present on left panel and find stable/mongodb-replicaset Helm Chart. You also can search mongodb chart using the search bar.
After selecting the stable/mongodb Helm chart, click on Deploy.
Enter the following details before deploying the mongoDB chart:
App Name
Name of the Chart
Project
Select the name of your Project in which you want to deploy the chart
Environment
Select the environment in which you want to deploy the chart
Chart Version
Select the latest Chart Version
Chart Value
Select the latest default value or create a custom value
values.yamlClick on Deploy Chart once you have finished configuring the chart.
After clicking on Deploy Chart, you will be redirected to App Details page that shows the deployment status of the chart. The Status of the chart should be Healthy. It might take few seconds after initiating the deployment.
In case the status of the deployment is Degraded or takes a long time to get deployed, click on Status or check the logs of the pods to debug the issue.
Copy the service name, it will be used to connect your application to mongoDB.
You can configure the values.yaml according to your project's requirements. To learn about different parameters used in the chart, you can check
Django is a free, open-source web framework written in Python programming language. It allows for scalability, re-usability, and rapid development. Django can be connected to different databases like MySQL, PostgreSQL, etc.
Go to mysite/settings.py.
The settings.py contains the configuration for your SQL database. Make sure the configurations in settings.py matches the configurations of the mysql Helm Chart, that you have deployed in Step 1.
In this example, we are using the url of the forked Git Repository.
Give, the path of the Dockerfile.
Enable Ingress, and give the path on which you want to host the application.
Set up the CI/CD pipelines. You can set them to trigger automatically or manually.
Trigger the CI Pipeline, build should be Successful, then trigger the CD Pipeline, deployment pipeline will be initiated, after some time the status should be Healthy.
Check the Django app connected to mysql database, running successfully by hitting your application url.
The syntax is: http://<hostname>/<path>/
path will be the one that you have given in Step 3 while configuring the Deployment Template.
To deploy mysql Helm Chart, you can refer to our documentation on
For this example, we are using the following , you can clone this repository and make following changes in the files.
To learn how to create an application on Devtron, refer to our documentation on


Deployment configuration is the Manifest for the application, it defines the runtime behavior of the application. You can define application behavior by providing information in three sections:
Chart Version
Yaml file
Show application metrics
Chart Version
Select the Chart Version using which you want to deploy the application.
Devtron uses helm charts for the deployments. And we are having multiple chart versions based on features it is supporting with every chart version.
One can see multiple chart version options available in the drop-down. you can select any chart version as per your requirements. By default, the latest version of the helm chart is selected in the chart version option.
Every chart version has its own YAML file. Helm charts are used to provide specifications for your application. To make it easy to use, we have created templates for the YAML file and have added some variables inside the YAML. You can provide or change the values of these variables as per your requirement.
Application Metrics is not supported for Chart version older than 3.7 version.
This defines ports on which application services will be exposed to other services
envoyPort
envoy port for the container.
envoyTimeout
envoy Timeout for the container,envoy supports a wide range of timeouts that may need to be configured depending on the deployment.By default the envoytimeout is 15s.
idleTimeout
the duration of time that a connection is idle before the connection is terminated.
name
name of the port.
port
port for the container.
servicePort
port of the corresponding kubernetes service.
supportStreaming
Used for high performance protocols like grpc where timeout needs to be disabled.
useHTTP2
Envoy container can accept HTTP2 requests.
EnvVariables provide run-time information to containers and allow to customize how the application works and the behavior of the applications on the system.
Here we can pass the list of env variables , every record is an object which contain the name of variable along with value.
To set environment variables for the containers that run in the Pod.
IMP Docker image should have env variables, whatever we want to set.
But ConfigMap and Secret are the prefered way to inject env variables. So we can create this in App Configuration Section
It is a centralized storage, specific to k8s namespace where key-value pairs are stored in plain text.
It is a centralized storage, specific to k8s namespace where we can store the key-value pairs in plain text as well as in encrypted(Base64) form.
IMP All key-values of Secret and CofigMap will reflect to your application.
If this check fails, kubernetes restarts the pod. This should return error code in case of non-recoverable error.
Path
It define the path where the liveness needs to be checked.
initialDelaySeconds
It defines the time to wait before a given container is checked for liveliness.
periodSeconds
It defines the time to check a given container for liveness.
successThreshold
It defines the number of successes required before a given container is said to fulfil the liveness probe.
timeoutSeconds
It defines the time for checking timeout.
failureThreshold
It defines the maximum number of failures that are acceptable before a given container is not considered as live.
command
The mentioned command is executed to perform the livenessProbe. If the command returns a non-zero value, it's equivalent to a failed probe.
httpHeaders
Custom headers to set in the request. HTTP allows repeated headers,You can override the default headers by defining .httpHeaders for the probe.
scheme
Scheme to use for connecting to the host (HTTP or HTTPS). Defaults to HTTP.
tcp
The kubelet will attempt to open a socket to your container on the specified port. If it can establish a connection, the container is considered healthy.
The maximum number of pods that can be unavailable during the update process. The value of "MaxUnavailable: " can be an absolute number or percentage of the replicas count. The default value of "MaxUnavailable: " is 25%.
The maximum number of pods that can be created over the desired number of pods. For "MaxSurge: " also, the value can be an absolute number or percentage of the replicas count. The default value of "MaxSurge: " is 25%.
This specifies the minimum number of seconds for which a newly created Pod should be ready without any of its containers crashing, for it to be considered available. This defaults to 0 (the Pod will be considered available as soon as it is ready).
If this check fails, kubernetes stops sending traffic to the application. This should return error code in case of errors which can be recovered from if traffic is stopped.
Path
It define the path where the readiness needs to be checked.
initialDelaySeconds
It defines the time to wait before a given container is checked for readiness.
periodSeconds
It defines the time to check a given container for readiness.
successThreshold
It defines the number of successes required before a given container is said to fulfill the readiness probe.
timeoutSeconds
It defines the time for checking timeout.
failureThreshold
It defines the maximum number of failures that are acceptable before a given container is not considered as ready.
command
The mentioned command is executed to perform the readinessProbe. If the command returns a non-zero value, it's equivalent to a failed probe.
httpHeaders
Custom headers to set in the request. HTTP allows repeated headers,You can override the default headers by defining .httpHeaders for the probe.
scheme
Scheme to use for connecting to the host (HTTP or HTTPS). Defaults to HTTP.
tcp
The kubelet will attempt to open a socket to your container on the specified port. If it can establish a connection, the container is considered healthy.
This is connected to HPA and controls scaling up and down in response to request load.
enabled
Set true to enable autoscaling else set false.
MinReplicas
Minimum number of replicas allowed for scaling.
MaxReplicas
Maximum number of replicas allowed for scaling.
TargetCPUUtilizationPercentage
The target CPU utilization that is expected for a container.
TargetMemoryUtilizationPercentage
The target memory utilization that is expected for a container.
extraMetrics
Used to give external metrics for autoscaling.
fullnameOverride replaces the release fullname created by default by devtron, which is used to construct Kubernetes object names. By default, devtron uses {app-name}-{environment-name} as release fullname.
Image is used to access images in kubernetes, pullpolicy is used to define the instances calling the image, here the image is pulled when the image is not present,it can also be set as "Always".
imagePullSecrets contains the docker credentials that are used for accessing a registry.
This allows public access to the url, please ensure you are using right nginx annotation for nginx class, its default value is nginx
Legacy deployment-template ingress format
enabled
Enable or disable ingress
annotations
To configure some options depending on the Ingress controller
host
Host name
pathType
Path in an Ingress is required to have a corresponding path type. Supported path types are ImplementationSpecific, Exact and Prefix.
path
Path name
tls
It contains security details
This allows private access to the url, please ensure you are using right nginx annotation for nginx class, its default value is nginx
enabled
Enable or disable ingress
annotations
To configure some options depending on the Ingress controller
host
Host name
pathType
Path in an Ingress is required to have a corresponding path type. Supported path types are ImplementationSpecific, Exact and Prefix.
path
Path name
pathType
Supported path types are ImplementationSpecific, Exact and Prefix.
tls
It contains security details
Specialized containers that run before app containers in a Pod. Init containers can contain utilities or setup scripts not present in an app image. One can use base image inside initContainer by setting the reuseContainerImage flag to true.
To wait for given period of time before switch active the container.
These define minimum and maximum RAM and CPU available to the application.
Resources are required to set CPU and memory usage.
Limits make sure a container never goes above a certain value. The container is only allowed to go up to the limit, and then it is restricted.
Requests are what the container is guaranteed to get.
This defines annotations and the type of service, optionally can define name also.
type
Select the type of service, default ClusterIP
annotations
Annotations are widely used to attach metadata and configs in Kubernetes.
name
Optional field to assign name to service
loadBalancerSourceRanges
If service type is LoadBalancer, Provide a list of whitelisted IPs CIDR that will be allowed to use the Load Balancer.
Note - If loadBalancerSourceRanges is not set, Kubernetes allows traffic from 0.0.0.0/0 to the LoadBalancer / Node Security Group(s).
It is required when some values need to be read from or written to an external disk.
It is used to provide mounts to the volume.
Spec is used to define the desire state of the given container.
Node Affinity allows you to constrain which nodes your pod is eligible to schedule on, based on labels of the node.
Inter-pod affinity allow you to constrain which nodes your pod is eligible to be scheduled based on labels on pods.
Key part of the label for node selection, this should be same as that on node. Please confirm with devops team.
Value part of the label for node selection, this should be same as that on node. Please confirm with devops team.
Taints are the opposite, they allow a node to repel a set of pods.
A given pod can access the given node and avoid the given taint only if the given pod satisfies a given taint.
Taints and tolerations are a mechanism which work together that allows you to ensure that pods are not placed on inappropriate nodes. Taints are added to nodes, while tolerations are defined in the pod specification. When you taint a node, it will repel all the pods except those that have a toleration for that taint. A node can have one or many taints associated with it.
This is used to give arguments to command.
It contains the commands to run inside the container.
enabled
To enable or disable the command.
value
It contains the commands.
workingDir
It is used to specify the working directory where commands will be executed.
Containers section can be used to run side-car containers along with your main container within same pod. Containers running within same pod can share volumes and IP Address and can address each other @localhost.
It is a kubernetes monitoring tool and the name of the file to be monitored as monitoring in the given case.It describes the state of the prometheus.
Accepts an array of Kubernetes objects. You can specify any kubernetes yaml here and it will be applied when your app gets deployed.
Kubernetes waits for the specified time called the termination grace period before terminating the pods. By default, this is 30 seconds. If your pod usually takes longer than 30 seconds to shut down gracefully, make sure you increase the GracePeriod.
A Graceful termination in practice means that your application needs to handle the SIGTERM message and begin shutting down when it receives it. This means saving all data that needs to be saved, closing down network connections, finishing any work that is left, and other similar tasks.
There are many reasons why Kubernetes might terminate a perfectly healthy container. If you update your deployment with a rolling update, Kubernetes slowly terminates old pods while spinning up new ones. If you drain a node, Kubernetes terminates all pods on that node. If a node runs out of resources, Kubernetes terminates pods to free those resources. It’s important that your application handle termination gracefully so that there is minimal impact on the end user and the time-to-recovery is as fast as possible.
It is used for providing server configurations.
It gives the details for deployment.
image_tag
It is the image tag
image
It is the URL of the image
It gives the set of targets to be monitored.
It is used to configure database migration.
Application metrics can be enabled to see your application's metrics-CPUService Monito usage,Memory Usage,Status,Throughput and Latency.
It gives the realtime metrics of the deployed applications
Deployment Frequency
It shows how often this app is deployed to production
Change Failure Rate
It shows how often the respective pipeline fails.
Mean Lead Time
It shows the average time taken to deliver a change to production.
Mean Time to Recovery
It shows the average time taken to fix a failed pipeline.
A service account provides an identity for the processes that run in a Pod.
When you access the cluster, you are authenticated by the API server as a particular User Account. Processes in containers inside pod can also contact the API server. When you are authenticated as a particular Service Account.
When you create a pod, if you do not create a service account, it is automatically assigned the default service account in the namespace.
You can create PodDisruptionBudget for each application. A PDB limits the number of pods of a replicated application that are down simultaneously from voluntary disruptions. For example, an application would like to ensure the number of replicas running is never brought below the certain number.
You can specify maxUnavailable and minAvailable in a PodDisruptionBudget.
With minAvailable of 1, evictions are allowed as long as they leave behind 1 or more healthy pods of the total number of desired replicas.
With maxAvailable of 1, evictions are allowed as long as at most 1 unhealthy replica among the total number of desired replicas.
Envoy is attached as a sidecar to the application container to collect metrics like 4XX, 5XX, Throughput and latency. You can now configure the envoy settings such as idleTimeout, resources etc.
Alerting rules allow you to define alert conditions based on Prometheus expressions and to send notifications about firing alerts to an external service.
In this case, Prometheus will check that the alert continues to be active during each evaluation for 1 minute before firing the alert. Elements that are active, but not firing yet, are in the pending state.
Labels are key/value pairs that are attached to pods. Labels are intended to be used to specify identifying attributes of objects that are meaningful and relevant to users, but do not directly imply semantics to the core system. Labels can be used to organize and to select subsets of objects.
Pod Annotations are widely used to attach metadata and configs in Kubernetes.
HPA, by default is configured to work with CPU and Memory metrics. These metrics are useful for internal cluster sizing, but you might want to configure wider set of metrics like service latency, I/O load etc. The custom metrics in HPA can help you to achieve this.
Wait for given period of time before scaling down the container.
If you want to see application metrics like different HTTP status codes metrics, application throughput, latency, response time. Enable the Application metrics from below the deployment template Save button. After enabling it, you should be able to see all metrics on App detail page. By default it remains disabled.
Helm Chart json schema is used to validate the deployment template values.
reference-chart_3-12-0
reference-chart_3-11-0
reference-chart_3-10-0
reference-chart_3-9-0
The values of CPU and Memory in limits must be greater than or equal to in requests respectively. Similarly, In case of envoyproxy, the values of limits are greater than or equal to requests as mentioned below.
Example for autosccaling with KEDA using Prometheus metrics is given below:
Example for autosccaling with KEDA based on kafka is given below :
A security context defines privilege and access control settings for a Pod or Container.
To add a security context for main container:
To add a security context on pod level:
You can use topology spread constraints to control how Pods are spread across your cluster among failure-domains such as regions, zones, nodes, and other user-defined topology domains. This can help to achieve high availability as well as efficient resource utilization.
Devtron’s tool is also providing you Security Features to identify the vulnerabilities inside your code and to protect your code from external attacks.
The system will scan your code and inform you if there are any Vulnerabilities present in your code. Also to make this feature more flexible to use, we have added a capability using which you can whitelist or block any vulnerability, and your code will be scanned considering the defined whitelist or blocked vulnerabilities.
We have created Security features to identify the vulnerabilities inside your code and to protect you from external attacks.
This Security Feature has two processes:
Scanning
Policy
This process starts executing after the successful execution of the CI pipeline and before the deployment(CD) process starts.
It scans your code to find any potential threat and shows you the list of vulnerabilities as an output of the CI pipeline if it finds any.
We will discuss later how you will see the list of your found vulnerabilities.
Vulnerabilities have different levels like Critical, Moderate, and Low. Users can define policy according to the level of vulnerability. Users can also block the vulnerability or allow(whitelist) the vulnerability for their code.
If any vulnerability is found which is blocked by the user, then it will not deploy the application. And if it finds any vulnerability which is whitelisted by the user, then the build image can be deployed.
The user gets informed in both cases if it finds any vulnerability or doesn't find any.
How to Check Vulnerability
You can find the Vulnerabilities Build History Page if you have enabled the Scan for vulnerabilities option.
Your Application-> Build History-> Select pipeline-> Go to Security Tab.
Here you can see all the vulnerabilities found in the build image.
Every vulnerability has CVE ID, Severity Level, Package, Current Version, and Fixed In Version.
CVE ID- Common Vulnerability ID
Severity Level- informs you about the severity of the vulnerability, it is defined as Critical, Medium, and Low.
Package- column contains some meta-data of vulnerability.
Current Version- is the version of that vulnerability
Fixed In Version- column contains version name if it has been fixed in any version, else it remains blank
Find Vulnerabilities on the Trigger Page
You can find Vulnerabilities on the Trigger page also. Image having vulnerabilities will be marked as Security Issues Found and you won’t be able to select the image to deploy it.
You can see details of these vulnerabilities by expanding the Show Source Info.
See the below image.
Click on the Show Source Info option. A window will be expanded with two options- Changes and Security. Click on the Security tab to view details about the vulnerabilities in the code.
Find Vulnerabilities on the App Details Page
You can find Vulnerabilities on the App Details page too. Here we are displaying the total number of vulnerabilities found in the code and their Severity Level wise segregation.
You can check Vulnerabilities for all your applications in one place. On the Home page, there is an option named Security. Here, you can see a list of applications under the Security Scan tab. Here all the applications are listed which have the Scan for Vulnerabilities feature enabled. You can see the vulnerability count along with the Severity Level for all your applications.
Note:-
It displays the “Vulnerability count and Severity Level” on a priority basis. And critical level has the highest priority, so it displays the critical level vulnerabilities and there counts if any application is having critical vulnerability in it.
You can directly Search your application using the Search bar or you can filter out your requirement according to Severity, Clusters, and Environment.
Now if you click on the severity level of vulnerability it will show you the list of all vulnerabilities along with other details.
Users can define Security policies for their vulnerabilities under Security Policies Tab.
Home Page-> Security - > Security Policies
Policies can be defined to different levels-
Global
Cluster
Environment
Application
Note:-
Policies work in hierarchical order.
Order to be followed- First Global and second Cluster and so on as you can see the order of the options
Some examples of how policies can be defined
Users can block all the critical vulnerabilities and allow the moderate and low vulnerabilities or Users can block all vulnerabilities or users can block all vulnerabilities for one application and can block only Critical vulnerabilities for other applications.
To configure these policies, click on the drop-down option of the severity levels and select Block or Allow.
In the Global Security Policies, there are only two options available- Block and Allow. But in other options, we have an extra option named Inherit.
As the name itself gives you an idea about this option, it fetches the policy of its upper-level options, if we choose to inherit in the drop-down.
Example-if you block critical severity levels in Global, then critical levels will be blocked in Cluster Security Policy. In case we change critical policy globally and allow it there, then it will be allowed in Cluster Security Policies too. But you can change these policies explicitly.
If you want to block Critical Vulnerabilities in Global Security Policies but want to allow them in some clusters, then select your cluster and change the critical drop-down to allow. It will not affect the policy of other clusters and global also.
Again we have three options to define a policy- Block, Allow, and Inherit.
Environment Security Policy inherits the policy from Cluster Security Policy. Each level inherits the policy of its upper level.
Select any environment here, you will find it is inheriting the policy of Cluster.
Example- If you have blocked critical level vulnerabilities in Global Security Policy but allowed them in Cluster Security Policy, then Environment Security Policy will inherit the policy of cluster not global, Hence critical level vulnerabilities will be allowed in the Environment Security Policy.
Though, You can change the policy explicitly.
The same thing goes with the Application Security Policy. But in Application, the policy is set with the combination of Environment option and Application option. If you change the policy in a dev environment that it will apply to all the applications which are in the dev environment.
Here is the last option Check CVE Policy, If you want to configure a security policy specific to any Vulnerability, you can use this option.
Click on this option, it will show you a search bar, copy any CVE ID or vulnerability ID, and click on Search. It will display the details regarding that CVE ID and you can configure the policy to that particular CVE ID.
Select Applications from the left navigation pane.
After selecting a configured application, select the App Details tab.
Note: The external link configured on the cluster where your app is located is the only one that is visible.
As shown in the screenshot, the monitoring tool appears at the configured component level:
Click on an external link to access the Monitoring Tool.
Workflow is a logical sequence of different stages used for continuous integration and continuous deployment of an application.
Click on New Build Pipeline to create a new workflow
On clicking New Build Pipeline, three options appear as mentioned below:
Continuous Integration: Choose this option if you want Devtron to build the image of source code.
Linked CI Pipeline: Choose this option if you want to use an image created by an existing CI pipeline in Devtron.
Incoming Webhook: Choose this if you want to build your image outside Devtron, it will receive a docker image from an external source via the incoming webhook.
Then, create CI/CD Pipelines for your application.
The test cases given in the script will run before the test cases given in the devtron.ci.yaml
Application metrics can be enabled to see your application's metrics.
Devtron provides certain metrics (CPU and Memory utilization) for each application by default i.e. you do not need to enable “Application metrics”. However, prometheus needs to be present in the cluster and the endpoint of the same should be updated in Global Configurations --> Clusters & Environments section.
There are certain advanced metrics (like Latency, Throughput, 4xx, 5xx, 2xx) which are only available when "Application metrics" is enabled from the Deployment Template. When you enable these advanced metrics, devtron attaches a envoy sidecar container to your main container which runs as a transparent proxy and passes each request through it to measure the advanced metrics.
Note: Since, all the requests are passed through envoy, any misconfiguration in envoy configs can bring your application down, so please test the configurations in a non-production environment extensively.
CPU usage is a utilization metric that shows the overall utilization of cpu by an application. It is available as both, aggregated or per pod.
Memory usage is a utilization metric that shows the overall utilization of memory by an application. It is available as both, aggregated or per pod.
This application metrics indicates the number of request processed by an application per minute.
This metrics indicates the application’s response to client’s request with a specific status code i.e 1xx(Communicate transfer protocol leve information), 2xx(Client’s request was accepted successfully), 3xx(Client must take some additional action to complete their request), 4xx(Client side error) or 5xx(Server side error).
Latency metrics shows the latency for an application. Latency measures the delay between an action and a response.
99.9th percentile latency: The maximum latency, in seconds, for the fastest 99.9% of requests.
99th percentile latency: The maximum latency, in seconds, for the fastest 99% of requests.
95th percentile latency: The maximum latency, in seconds, for the fastest 95% of requests.
Note: We also support custom percentile input inside the dropdown .A latency measurement based on a single request is not meaningful.
A Job creates one or more Pods and will continue to retry execution of the Pods until a specified number of them successfully terminate. As pods successfully complete, the Job tracks the successful completions. When a specified number of successful completions is reached, the task (ie, Job) is complete. Deleting a Job will clean up the Pods it created. Suspeding a Job will delete its active Pods until the Job is resumed again.
A Cronjob creates Jobs on a repeating schedule , One Cronjob object is like one line of a crontab (cron table) file. It runs a job periodically on a given schedule, written in Cron format. Cronjobs are meant for performing regular scheduled actions such as backups, report generation, and so on. Each of those tasks should be configured to recur indefinitely (for example: once a day / week / month); you can define the point in time within that interval when the job should start.
The ConfigMap API resource holds key-value pairs of the configuration data that can be consumed by pods or used to store configuration data for system components such as controllers. ConfigMap is similar to Secrets, but designed to more conveniently support working with strings that do not contain sensitive information.
Click on Add ConfigMap to add a config map to your application.
You can configure a configmap in two ways-
(a) Using data type Kubernetes ConfigMap
(b) Using data type Kubernetes External ConfigMap
1. Data Type
Select the Data Type as Kubernetes ConfigMap, if you wish to use the ConfigMap created by Devtron.
2. Name
Provide a name to your configmap.
3. Use ConfigMap as
Here we are providing two options, one can select any of them as per your requirement
-Environment Variable as part of your configMap or you want to add Data Volume to your container using Config Map.
Environment Variable
Select this option if you want to add Environment Variables as a part of configMap. You can provide Environment Variables in key-value pairs, which can be seen and accessed inside a pod.
Data Volume
Select this option if you want to add a Data Volume to your container using the Config Map.
Key-value pairs that you provide here, are provided as a file to the mount path. Your application will read this file and collect the required data as configured.
4. Data
In the Data section, you provide your configmap in key-value pairs. You can provide one or more than one environment variable.
You can provide variables in two ways-
YAML (raw data)
GUI (more user friendly)
Once you have provided the config, You can click on any option-YAML or GUI to view the key and Value parameters of the ConfigMap.
Kubernetes ConfigMap using Environment Variable:
If you select Environment Variable in 3rd option, then you can provide your environment variables in key-value pairs in the Data section using YAML or GUI.
Data in YAML (please Check below screenshot)
Now, Click on Save ConfigMap to save your configmap configuration.
Kubernetes ConfigMap using Data Volume
Provide the Volume Mount folder path in Volume Mount Path, a path where the data volume needs to be mounted, which will be accessible to the Containers running in a pod.
You can add Configuration data as in YAML or GUI format as explained above.
You can click on YAML or GUI to view the key and Value parameters of the ConfigMap that you have created.
You can click on Save ConfigMap to save the configMap.
For multiple files mount at the same location you need to check sub path bool field, it will use the file name (key) as sub path. Sub Path feature is not applicable in case of external configmap.
File permission will be provide at the configmap level not on the each key of the configmap. It will take 3 digit standard permission for the file.
You can select Kubernetes External ConfigMap in the data type field if you have created a ConfigMap using the kubectl command.
By default, the data type is set to Kubernetes ConfigMap.
Kubernetes External ConfigMap is created using the kubectl create configmap command. If you are using Kubernetes External ConfigMap, make sure you give the name of ConfigMap the same as the name that you have given using kubectl create Configmap <configmap-name> <data source> command, otherwise, it might result in an error during the built.
You have to ensure that the External ConfigMap exists and is available to the pod.
The config map is created.
You can update your configmap anytime later but you cannot change the name of your configmap. If you want to change the name of the configmap then you have to create a new configmap. To update configmap, click on the configmap you have created make changes as required.
Click on Update Configmap to update your configmap.
You can delete your configmap. Click on your configmap and click on the delete sign to delete your configmap.
If you want to see (For example Status codes 2xx, 3xx, 5xx; throughput, and latency) for your application, then you need to select the latest chart version.
regcred is the secret that contains the docker credentials that are used for accessing a registry. Devtron will not create this secret automatically, you'll have to create this secret using dt-secrets helm chart in the App store or create one using kubectl. You can follow this documentation Pull an Image from a Private Registry .
Once all the Deployment template configurations are done, click on Save to save your deployment configuration. Now you are ready to create to do CI/CD.
is a Kubernetes-based Event Driven Autoscaler. With KEDA, you can drive the scaling of any container in Kubernetes based on the number of events needing to be processed. KEDA can be installed into any Kubernetes cluster and can work alongside standard Kubernetes components like the Horizontal Pod Autoscaler(HPA).
Remember, we discussed the option in the CI pipeline. You can enable this feature from the CI Pipeline page. The system will scan your code and will show you all vulnerabilities present in your code.
The users can access the on the App Details page.
The link opens in a new tab with the context you specified as env variables in the section.
To know how to create the CI pipeline for your application, click on:
To know how to create the CD pipeline for your application, click on:
Users can run the test case using the Devtron dashboard or by including the test cases in the devtron.ci.yaml file in the source git repository. For reference, check:
version
specify the version of yaml
appliesTo
applies the changes to a specified branch
type
branch type on which changes are to be applied, it can be BRANCH_FIXED or TAG_PATTERN
value
branch name on which changes are to be applied, it can take a value as the name of branch (“master”) or as a regular expression ("%d.%d.%d-rc")
script
A script which you want to execute, you can also execute the docker commands here
beforeDockerBuildStages
script to run before the docker build step
afterDockerBuildStages
script to run after the docker build step
outputLocation
The location where you want to see the output of the report of Test cases
activeDeadlineSeconds
Another way to terminate a Job is by setting an active deadline. Do this by setting the activeDeadlineSeconds field of the Job to a number of seconds. The activeDeadlineSeconds applies to the duration of the job, no matter how many Pods are created. Once a Job reaches activeDeadlineSeconds, all of its running Pods are terminated and the Job status will become type: Failed with reason: DeadlineExceeded.
backoffLimit
There are situations where you want to fail a Job after some amount of retries due to a logical error in configuration etc. To do so, set backoffLimit to specify the number of retries before considering a Job as failed. The back-off limit is set by default to 6. Failed Pods associated with the Job are recreated by the Job controller with an exponential back-off delay (10s, 20s, 40s ...) capped at six minutes. The back-off count is reset when a Job's Pod is deleted or successful without any other Pods for the Job failing around that time.
completions
Jobs with fixed completion count - that is , jobs that have non null completions - can have a completion mode that is specified in completionMode.
parallelism
The requested parallelism can be set to any non-negative value. If it is unspecified, it defaults to 1. If it is specified as 0, then the Job is effectively paused until it is increased.
suspend
The suspend field is also optional. If it is set to true, all subsequent executions are suspended. This setting does not apply to already started executions. Defaults to false.
ttlSecondsAfterFinished
The TTL controller only supports Jobs for now. A cluster operator can use this feature to clean up finished Jobs (either Complete or Failed) automatically by specifying the ttlSecondsAfterFinished field of a Job, as in this example. The TTL controller will assume that a resource is eligible to be cleaned up TTL seconds after the resource has finished, in other words, when the TTL has expired. When the TTL controller cleans up a resource, it will delete it cascadingly, that is to say it will delete its dependent objects together with it. Note that when the resource is deleted, its lifecycle guarantees, such as finalizers, will be honored.
kind
As with all other Kubernetes config, a Job and cronjob needs apiVersion, kind.cronjob and job also needs a section fields which is optional . these fields specify to deploy which job (conjob or job) should be kept. by default, they are set job.
concurrencyPolicy
A CronJob is counted as missed if it has failed to be created at its scheduled time. For example, If concurrencyPolicy is set to Forbid and a CronJob was attempted to be scheduled when there was a previous schedule still running, then it would count as missed,Acceptable values: Allow / Forbid.
failedJobsHistoryLimit
The failedJobsHistoryLimit fields are optional. These fields specify how many completed and failed jobs should be kept. By default, they are set to 3 and 1 respectively. Setting a limit to 0 corresponds to keeping none of the corresponding kind of jobs after they finish.
restartPolicy
The spec of a Pod has a restartPolicy field with possible values Always, OnFailure, and Never. The default value is Always.The restartPolicy applies to all containers in the Pod. restartPolicy only refers to restarts of the containers by the kubelet on the same node. After containers in a Pod exit, the kubelet restarts them with an exponential back-off delay (10s, 20s, 40s, …), that is capped at five minutes. Once a container has executed for 10 minutes without any problems, the kubelet resets the restart backoff timer for that container, Acceptable values: Always / OnFailure / Never.
schedule
To generate Cronjob schedule expressions, you can also use web tools like https://crontab.guru/.
startingDeadlineSeconds
If startingDeadlineSeconds is set to a large value or left unset (the default) and if concurrencyPolicy is set to Allow, the jobs will always run at least once.
successfulJobsHistoryLimit
The successfulJobsHistoryLimit fields are optional. These fields specify how many completed and failed jobs should be kept. By default, they are set to 3 and 1 respectively. Setting a limit to 0 corresponds to keeping none of the corresponding kind of jobs after they finish.
suspend
The suspend field is also optional. If it is set to true, all subsequent executions are suspended. This setting does not apply to already started executions. Defaults to false.
kind
As with all other Kubernetes config, a Job and cronjob needs apiVersion, kind.cronjob and job also needs a section fields which is optional . these fields specify to deploy which job (conjob or job) should be kept. by default, they are set cronjob.
Data Type (Kubernetes ConfigMap)
Select your preferred data type for Kubernetes ConfigMap or Kubernetes External ConfigMap
Name
Provide a name to this ConfigMap.
Use configmap as Environment Variable
Select this option if you want to inject Environment Variables in pods using ConfigMap.
Use configmap as Data Volume
Select this option, if you want to configure a Data Volume that is accessible to Containers running in a pod and provide a Volume mount path.
Key-Value
Provide the actual key-value configuration data here. Key and corresponding value to the provided key.


Kubernetes namespaces can be seen as a logical entity used to represent cluster resources for usage of a particular set of users. This logical entity can also be termed as a virtual cluster. One physical cluster can be represented as a set of multiple such virtual clusters (namespaces).
Namespaces are intended for use in environments with many users spread across multiple teams, or projects. Names of resources need to be unique within a namespace, but not across namespaces. Namespaces can not be nested inside one another and each Kubernetes resource can only be in one namespace
One of the advantages that Kubernetes provides is the ability to manage various environments easier and better than traditional deployment strategies. For most nontrivial applications, you have test, staging, and production environments. You can spin up a separate cluster of resources, such as VMs, with the same configuration in staging and production, but that can be costly and managing the differences between the environments can be difficult. Kubernetes includes a cool feature called namespaces, which enables you to manage different environments within the same cluster. For example, you can have different test and staging environments in the same cluster of machines, potentially saving resources.
Environments in Devtron can be accessed from:-
Global Configuration->Clusters & Environments
Here multiple environments can be created.
Discover, Create, Deploy, Update, Upgrade, Delete charts.
Select the Charts section from the left pane, you will be landed to the Chart Store page. Search nginx or any other charts in search filter.
Click on chart and it will redirect you to Chart Details page where you can see a number of instances deployed by using the same chart.
After selecting the version and values, click on Deploy
Enter the following details, to deploy chart:
you can choose any chart version, values and update it on values.yaml
Click on Deploy to deploy the Chart
After clicking on Deploy you will land on a page that shows the status of the deployment of the Chart.
The status of the chart should be Healthy. It might take a few seconds after initiating the deployment of the chart. In case the status of the deployment is Degraded or takes a long time to get deployed, click on Details in Application Status section on the same page or check the logs of the pods to debug the issue.
Shows status of deployed chart.
Shows the controller service accounts being used.
Clicking on values will land you on the page where you can update, upgrade or delete chart.
Clicking on View Chart will land you to the page where you can see all the running instances of this chart.
To see deployment history of Helm application, click on Deployment history from App details page.
For update you can change its chart version or values.yaml and then click on Update And Deploy.
For upgrade click on Repo/Chart field and search any chart name like nginx-ingress and change values corresponding to that chart and Click on Update And Deploy.
After an update or upgrade you again will land on App Detail page, where you can check pods and service name.
By clicking on View Chart in Chart Used section on App Details page, it will redirect you to Chart Details page where you can see number of instances installed by this chart and also you can delete the chart instance from here.
Devtron collects anonymous telemetry data that helps the Devtron team in understanding how the product is being used and in deciding what to focus on next.
The data collected is minimal, non PII, statistical in nature and cannot be used to uniquely identify an user.
Please see the next section to see what data is collected and sent. Access to collected data is strictly limited to the Devtron team.
As a growing community, it is very valuable in helping us make the Devtron a better product for everyone!
Here is a sample event JSON which is collected and sent:
Inception sends the installation and upgradation events of the Devtron tool to measure the churn rate.
Events which are sent by Inception :
InstallationStart
InstallationInProgress
InstallationSuccess
UpgradeStart
UpgradeInProgress
UpgradeSuccess
Event is same as sample json with event name mentioned above.
Orchestrator sends the summary events of the Devtron tool to measure the daily usage.
Events which are sent by Orchestrator :
Heartbeat
Summary
Orchestrator sends the Summary event once in 24 hours with the daily operation done by user.
Here is a sample summary JSON which is available under properties:
Dashboard sends the events to measure dashboard visit of the Devtron tool.
Events which are sent by Orchestrator : * identify
Dashboard sends the identify event when user visits the Dashboard for the first time.
The data is sent to Posthog server.
stable/mysql Helm chart bootstraps a single node MySQL deployment on a Kubernetes cluster using the Helm package manager.
Select Charts from the left panel to visit the Chart Store page. You will see numerous of charts on the page from which you have to find stable/mysql chart. You also can use the search bar to search the MySQL chart.
After selecting the stable/mysql Helm chart, click on Deploy.
Enter the following details, to deploy MySQL chart:
values.yamlSet the following parameters in the chart, to be later used to connect MySQL with your Django Application.
Click on Deploy Chart to deploy the Chart.
After clicking on Deploy you will be redirected to app details page where you can see deployment status of the chart. The Status of the chart should be Healthy. It might take few seconds after initiating the deployment of the chart.
In case the Status, of the deployment is Degraded or takes a long time to get deployed. Click on the Status or check the logs of the pods to debug the issue.
Copy the service name, it will be used to connect your application to MySQL.
App Name
Name of the Chart Unique
Project
Project in which you want to deploy the chart
Environment
Environment in which you want to deploy the chart
Chart Version
Chart version
Chart Value
Latest default value or create a custom value
event
Name of the event
distinct_id
Unique user id or client id
devtronVersion
devtron version
serverVersion
kubernetes cluster version
eventType
event type
ucid
Unique client id
cdCountPerDay
cd pipeline created in last 24 hour
ciCountPerDay
ci pipeline created in last 24 hour
clusterCount
total cluster in the system
environmentCount
total environment in the system
nonProdAppCount
total non prod apps created
userCount
total user created in the system
App Name
Name of the Chart
Project
Select the name of your Project in which you want to deploy the chart
Environment
Select the environment in which you want to deploy the chart
Chart Version
Select the latest Chart Version
Chart Value
Select the default value or create a custom value
mysqlRootPassword
Password for the root user. Ignored if existing secret is provided
mysqlDatabase
Name of your MySQL database
mysqluser
Username of new user to create
mysqlPassword
Password for the new user. Ignored if existing secret is provided